SlideShare a Scribd company logo
Bed Bath & Beyond (NYSE:BBBY) Confidential
CMP:USD 71.5
Market Capitalisation: USD 13.2 Billion
Overview
Bed bath & Beyond (or “the Company”) is a chain of domestic merchandise retail stores in United States and
Canada. The Company retails house furnishing products for bedroom, bathroom, kitchen and dining room.
This business fits within my investment theme of repetitive consumer demand. I think it’s a great investment
since a) The Company enjoys leadership position in the market. b) The Company will continue to generate
strong cash flows c) The Company trades at a P/E of 13.48x compared to its peers which trade much higher.
Hence, I would initiate a buy on the stock with an upside of 25% from current levels.
Industry
The US home furnishing and furniture category grew by 4.4% during 2013. Sales in the retail segment was $
101 billion ( $52 million in furniture and $49 million home furnishings) in line with levels in 03-04 but
significantly below the peak levels of $113 billion. The industry is expected to grow at a faster rate buoyed by
the general economic recovery in US and the bounce back in the housing market.
Company Overview
The Company is the largest player in the housewares and domestic merchandise sector and operates in United
States, Canada, and Mexico with over 1,550 stores spread over 42.6 million square feet.
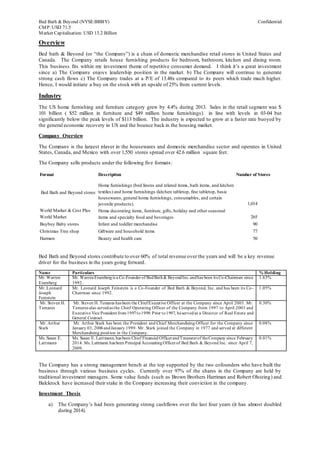
The Company sells products under the following five formats:
Bed Bath and Beyond stores contribute to over 60% of total revenue over the years and will be a key revenue
driver for the business in the years going forward.
Name Particulars % Holding
Mr. Warren
Eisenberg
Mr. WarrenEisenbergis a Co-Founder of BedBath& BeyondInc.andhas been its Co-Chairman since
1992.
1.63%
Mr. Leonard
Joseph
Feinstein
Mr. Leonard Joseph Feinstein is a Co-Founder of Bed Bath & Beyond, Inc. and has been its Co-
Chairman since 1992.
1.05%
Mr. Steven H.
Temares
Mr. Steven H. Temares has been the ChiefExecutive Officer at the Company since April 2003. Mr.
Temares also servedas the Chief Operating Officer of the Company from 1997 to April 2003 and
Executive Vice President from1997to1999. Prior to1997, heservedas a Director of Real Estate and
General Counsel.
0.30%
Mr. Arthur
Stark
Mr. Arthur Stark has been the President and Chief Merchandising Officer for the Company since
January 03, 2006andJanuary 1999. Mr. Stark joined the Company in 1977 and served at different
Merchandising position in the Company.
0.08%
Ms. Susan E.
Lattmann
Ms. Susan E. Lattmann, has been Chief Financial OfficerandTreasurerof theCompany since February
2014. Ms. Lattmann has been Principal AccountingOfficerof Bed Bath & Beyond Inc. since April 7,
2009.
0.01%
The Company has a strong management bench at the top supported by the two cofounders who have built the
business through various business cycles. Currently over 97% of the shares in the Company are held by
traditional investment managers. Some value funds (such as Brown Brothers Harriman and Robert Olsteing) and
Balckrock have increased their stake in the Company increasing their conviction in the company.
Investment Thesis
a) The Company’s had been generating strong cashflows over the last four years (it has almost doubled
during 2014).
Format Description Number of Stores
Bed Bath and Beyond stores
1,014
World Market & Cost Plus
World Market 265
Buybuy Baby stores 90
Christmas Tree shop Giftware and household items 77
Harmon Beauty and health care 50
Home furnishings (bed linens and related items, bath items, and kitchen
textiles) and home furnishings (kitchen tabletop, fine tabletop, basic
housewares, general home furnishings, consumables, and certain
juvenile products).
Home decorating items, furniture, gifts, holiday and other seasonal
items and specialty food and beverages
Infant and toddler merchandise
2
b) The Company has grown at a five year CAGR of 9.8% while sustaining its operating margins in the
high teens over the last five years.
c) The Company has been utilising its operating cash flows to buy back shares and has bought back USD
6.6 billion shares from investors in the last decade. The Company has recently raised USD 1.5 billion
as debt to buyback equity aggregating to USD 2.7 billion at an average cost of 4-5% which will boost
its returns.
d) The Company has consistently delivered mid teen returns ROE’s and ROCE’s.
e) The stock price had been under pressure due to results below expectations and low management
guidance for the year.
Key Risks
a) The Company’s P/E ratio has fallen from 30 times to 14 times earnings in the past decade. This points
either to a deterioration in the business model or slower growth in the business. The multiples have
declined due to i) The Company facing intense competition from online retailers (such as Amazon) and
ii) slow growth from existing stores. The Company has entered into the online space which should
pick pace. Further, as a consumer psyche I think that the consumers would still want to actually see the
product before buying. Second, of the last 10 years growth during five years were lost on account of
the slowdown in the housing market. If the business scenario improves the Company will clock in
higher growth rates. Even in the bad years the Company has been generating cash flows.
b) The housing market might not recover and consumers would start curtailing their expenses. During the
last decade the Company has had only a one year of negative same store sales growth whereas its
competitors have not fared well post the crisis. Further, with a strong cash position the Company will
be ready to takeover the existing competitors.
c) Pressure on Gross Margins: There has been a severe pressure on the Company’s gross margins over
the past few years. In fact it has come down below 40% for the first time in decades. The industry has
been undergoing a many structural changes which has led to competitors raking a price war. The
Company has to tackle such price war by lowering prices. Though the business can recover s uch
margins due to its scale of purchasing power.
Valuation
On a comparable valuation analysis we observe that the Company is trading at a significant discount to its
market competitors. Given the leadership position of the Company in the market coupled with the recent push
towards new channels for growth (i.e. online) and strong cash flows to support it we believe that the market has
been undervaluing the Company due to low growth. The market should give some kind of premium to the
market leader in the industry. Further, given the online initiative launched by the Company there might be an
growth surprise. We have recalibrated the valuation of the Company considering various P/E scenarios.
Company Name Revenue Market Cap Net Debt Gross Margin % EBITDA % Debt/Capital % NTM TEV/Forward EBITDA NTM Forward P/E
Bed Bath & Beyond Inc. (NasdaqGS:BBBY) 12,146.96 13,250.1 213.4 39.3% 15.4% 33.8% 7.45x 13.50x
Williams-Sonoma Inc. (NYSE:WSM) 4,859.84 6,510.4 (68.6) 38.7% 13.9% 0.2% 9.53x 20.94x
The Home Depot, Inc. (NYSE:HD) 84,581.81 1,32,223.4 12,520.0 34.8% 14.3% 59.4% 11.42x 20.05x
Pier 1 Imports, Inc. (NYSE:PIR) 1,945.03 1,258.1 165.0 56.9% 11.2% 38.9% 6.71x 13.71x
Restoration Hardware Holdings, Inc. (NYSE:RH) 2,024.54 3,267.7 166.6 36.5% 12.2% 36.2% 15.35x 32.70x
Mean 10.1x 20.2x
Median 9.5x 20.1x
P/E 2016 2017
13.5x 74.9 81.4
14.0x 77.7 84.4
14.5x 80.5 87.4
15.0x 83.3 90.4
15.5x 86.0 93.4
16.0x 88.8 96.5
17.0x 94.4 102.5
18.0x 99.9 108.5
19.0x 105.5 114.5
20.0x 111.0 120.6
3
Valuing the Company at an average multiple of 16x we arrive at a price of USD 89 (an upside potential of
25%). If we value the Company at the median (20x) then we arrive at a valuation of USD 111 per share (a 56%
increase) although we feel that real impact on earnings as a result of share buybacks will come in 2017 and later
years. Hence, if we take a multiple benchmark of 14x FY 17 earnings we arrive at a valuation of USD 85.
We ran a DCF analysis on the cash flows of the Company assuming that the Company retains its current growth
trajectory and gross margins. We have assumed that the Company buys back shares aggregating to USD 2.7
billion over the next three years. The WACC for the Company has been calculated at 7.84% considering the
current leverage. Terminal Value has been calculated assuming a terminal growth of 2.5%.
Considering dcf valuation the value of the Company works out to USD 91.4 given the strong cash flows of the
Company in the coming years.
Conclusion
Taking an average of the prices derived from the above two methods we arrive at a price of USD 90.2.
(USD Million) FY 2015 FY 2016 FY 2017
FCFF 921.3 1,012.9 1,045.3
TV 19,574.1
Discounted 854.3 871.0 16,441.2
Enterprise Value 18,166.5
Less Debt 1,500.0
Equity Value (per share) 91.4
4
Annexure
Income Statement
Cash Flow
USD Million FY2004 FY2005 FY2006 FY2007 FY2008 FY2009 FY2010 FY2011 FY2012 FY2013 FY2014
Revenue 4,478.0 5,147.7 5,809.6 6,617.4 7,048.9 7,208.3 7,828.8 8,758.5 9,499.9 10,914.6 11,504.0
Other Revenue - - - - - - - - - - -
Total Revenue 4,478.0 5,147.7 5,809.6 6,617.4 7,048.9 7,208.3 7,828.8 8,758.5 9,499.9 10,914.6 11,504.0
Cost Of Goods Sold 2,601.3 2,961.4 3,323.8 3,782.0 4,123.7 4,335.1 4,620.7 5,135.6 5,569.0 6,525.8 6,938.4
Gross Profit 1,876.7 2,186.3 2,485.7 2,835.4 2,925.2 2,873.2 3,208.1 3,622.9 3,930.9 4,388.8 4,565.6
Selling General & Admin Exp. 1,237.3 1,393.9 1,606.6 1,946.0 2,087.2 2,199.3 2,227.4 2,334.5 2,362.6 2,750.5 2,951.0
R & D Exp. - - - - - - - - - - -
Depreciation & Amort. - - - - - - - - - - -
Other Operating Expense/(Income) - - - - - - - - - - -
Other Operating Exp., Total 1,237.3 1,393.9 1,606.6 1,946.0 2,087.2 2,199.3 2,227.4 2,334.5 2,362.6 2,750.5 2,951.0
Operating Income 639.3 792.4 879.2 889.4 838.0 673.9 980.7 1,288.5 1,568.4 1,638.2 1,614.6
Interest Expense - - - - - - - - - (4.2) (1.1)
Interest and Invest. Income 10.2 18.8 35.9 43.5 27.2 9.4 4.6 4.5 1.1 - -
Net Interest Exp. 10.2 18.8 35.9 43.5 27.2 9.4 4.6 4.5 1.1 (4.2) (1.1)
Other Non-Operating Inc. (Exp.) - - - - - - - - - - -
EBT Excl. Unusual Items 649.5 811.2 915.1 932.9 865.2 683.3 985.3 1,293.0 1,569.5 1,634.1 1,613.4
Impairment of Goodwill - - - - - - - - - - -
Other Unusual Items - - - - - - - - - - -
EBT Incl. Unusual Items 649.5 811.2 915.1 932.9 865.2 683.3 985.3 1,293.0 1,569.5 1,634.1 1,613.4
Income TaxExpense 250.1 306.2 342.2 338.6 302.4 258.2 385.2 501.6 580.0 596.3 591.2
Earnings from Cont. Ops. 399.5 505.0 572.8 594.2 562.8 425.1 600.0 791.3 989.5 1,037.8 1,022.3
Earnings of Discontinued Ops. - - - - - - - - - - -
Extraord. Item& Account. Change - - - - - - - - - - -
Net Income to Company 399.5 505.0 572.8 594.2 562.8 425.1 600.0 791.3 989.5 1,037.8 1,022.3
Minority Int. in Earnings - - - - - - - - - - -
Net Income 399.5 505.0 572.8 594.2 562.8 425.1 600.0 791.3 989.5 1,037.8 1,022.3
Per Share Items
Basic EPS $1.35 $1.68 $1.95 $2.12 $2.13 $1.66 $2.33 $3.11 $4.12 $4.62 $4.85
Diluted EPS $1.31 $1.65 $1.92 $2.09 $2.1 $1.64 $2.3 $3.07 $4.06 $4.56 $4.79
Diluted EPS Excl. Extra Items 1.31 1.65 1.92 2.09 2.1 1.64 2.3 3.07 4.06 4.56 4.79
Weighted Avg. Diluted Shares Out. 304.7 306.6 299.0 285.0 268.4 258.6 260.4 258.1 243.9 227.7 213.4
5
Balance Sheet
(USD Million) FY2004 FY2005 FY2006 FY2007 FY2008 FY2009 FY2010 FY2011 FY2012 FY2013 FY2014
Net Income 399.5 505.0 572.8 594.2 562.8 425.1 600.0 791.3 989.5 1,037.8 1,022.3
Depreciation & Amort. 84.6 97.5 111.1 133.0 157.8 175.6 184.2 183.8 183.9 194.7 218.8
Depreciation & Amort., Total 84.6 97.5 111.1 133.0 157.8 175.6 184.2 183.8 183.9 194.7 218.8
(Gain) Loss On Sale Of Invest. - - 3.2 3.5 1.5 - - - - - -
Stock-Based Compensation - - 26.4 52.6 43.8 43.7 44.2 44.3 45.2 47.2 56.2
Tax Benefit from Stock Options 64.8 27.0 20.0 6.7 2.7 (1.2) (6.0) (3.5) 0.1 13.2 12.8
Other Operating Activities (1.9) 5.7 (25.9) (87.2) 2.3 (21.8) (23.2) (17.7) 28.6 18.3 10.1
Change in Trad. Asset Securities - - (0.4) (3.0) (3.0) 0 (5.6) (5.5) (4.5) (6.2) (11.4)
Change In Inventories (27.1) (139.7) (149.7) (204.1) (96.7) (25.4) (117.4) (209.2) (103.0) (198.4) (112.7)
Change in Acc. Payable 15.3 42.5 64.9 75.9 (31.8) (40.9) 96.3 102.3 31.6 105.3 178.1
Change in Unearned Rev. 19.0 23.9 26.5 30.2 24.4 (5.6) 7.2 20.3 16.6 36.9 32.7
Change in Inc. Taxes (38.0) 47.5 10.7 21.6 (74.5) 24.7 70.5 25.5 (37.4) 6.6 (4.5)
Change in Other Net Operating Assets 28.1 (2.4) 0.8 (9.8) 25.2 9.8 55.1 55.8 74.7 (62.3) (19.3)
Cash from Ops. 544.4 607.0 660.4 613.6 614.5 584.0 905.4 987.4 1,225.3 1,193.0 1,383.2
Capital Expenditure (109.0) (181.4) (220.4) (317.5) (358.2) (215.9) (153.7) (183.5) (243.4) (314.7) (317.2)
Cash Acquisitions (175.5) - - - (85.9) - - - - (643.1) -
Divestitures - - - - - - - - - - -
Sale (Purchase) of Intangible assets - - - - - - - - - (40.0) -
Invest. in Marketable & Equity Securt. (398.7) (172.3) 152.8 (80.2) 545.8 102.8 (335.0) (157.5) (120.6) 332.0 (42.6)
Net (Inc.) Dec. in Loans Originated/Sold - - - - - - - - - - -
Other Investing Activities - - - - - - - - - - -
Cash from Investing (683.2) (353.7) (67.6) (397.7) 101.7 (113.1) (488.7) (341.0) (364.0) (665.8) (359.8)
Short Term Debt Issued - - - - - - - - - - -
Long-Term Debt Issued - - - - - - - - - - -
Total Debt Issued - - - - - - - - - - -
Short Term Debt Repaid - - - - - - - - - - -
Long-Term Debt Repaid (21.2) - - - - - - - - (25.5) -
Total Debt Repaid (21.2) - - - - - - - - (25.5) -
Issuance of Common Stock 74.6 31.1 35.0 43.4 22.7 17.7 99.7 125.7 171.1 56.4 54.8
Repurchase of Common Stock - (350.2) (598.2) (301.0) (734.2) (48.1) (94.9) (687.6) (1,218.0) (1,001.3) (1,284.0)
Total Dividends Paid - - - - - - - - - - -
Special Dividend Paid - - - - - - - - - - -
Other Financing Activities - (6.7) (4.0) 7.3 6.0 3.7 6.3 2.9 5.2 5.0 7.3
Cash from Financing 53.4 (325.7) (567.3) (250.3) (705.5) (26.8) 11.2 (559.0) (1,041.7) (965.4) (1,221.9)
Net Change in Cash (85.4) (72.4) 25.6 (34.3) 10.7 444.1 427.9 87.5 (180.4) (438.2) (198.5)
6
Ratios
(USD Million) Aug-30-2014
ASSETS
Cash And Equivalents 1,226.6
Short Term Investments 60.0
Total Cash & ST Investments 1,286.6
Accounts Receivable -
Total Receivables -
Inventory 2,758.7
Deferred Tax Assets, Curr. -
Other Current Assets 434.4
Total Current Assets 4,479.8
Gross Property, Plant & Equipment 3,676.9
Accumulated Depreciation (2,100.0)
Net Property, Plant & Equipment 1,576.9
Long-term Investments 92.4
Goodw ill 486.3
Other Intangibles -
Deferred Tax Assets, LT -
Other Long-Term Assets 398.9
Total Assets 7,034.3
LIABILITIES
Accounts Payable 1,258.6
Accrued Exp. 407.2
Curr. Port. of Cap. Leases -
Curr. Income Taxes Payable 46.5
Unearned Revenue, Current 294.7
Other Current Liabilities -
Total Current Liabilities 2,006.9
Long-Term Debt 1,500.0
Capital Leases -
Pension & Other Post-Retire. Benefits -
Other Non-Current Liabilities 588.2
Total Liabilities 4,095.1
Common Stock 3.4
Additional Paid In Capital 1,560.1
Retained Earnings 9,006.9
Treasury Stock (7,620.6)
Comprehensive Inc. and Other (10.6)
Total Common Equity 2,939.2
Total Equity 2,939.2
Total Liabilities And Equity 7,034.3
7
(USD Million) FY2004 FY2005 FY2006 FY2007 FY2008 FY2009 FY2010 FY2011 FY2012 FY2013 FY2014
Profitability
Return on Assets % 15.8% 16.3% 16.7% 15.1% 13.4% 10.4% 13.0% 14.9% 17.2% 17.1% 16.0%
Return on Capital % 23.2% 23.6% 24.6% 22.6% 20.1% 15.1% 18.4% 21.2% 25.0% 25.2% 24.5%
Return on Equity % 23.2% 24.1% 25.7% 24.2% 21.6% 15.3% 18.0% 20.9% 25.2% 25.9% 25.5%
Return on Common Equity % 23.2% 24.1% 25.7% 24.2% 21.6% 15.3% 18.0% 20.9% 25.2% 25.9% 25.5%
Margin Analysis
Gross Margin % 41.9% 42.5% 42.8% 42.8% 41.5% 39.9% 41.0% 41.4% 41.4% 40.2% 39.7%
SG&A Margin % 27.6% 27.1% 27.7% 29.4% 29.6% 30.5% 28.5% 26.7% 24.9% 25.2% 25.7%
EBITDA Margin % 16.2% 17.3% 17.0% 15.4% 14.1% 11.8% 14.9% 16.8% 18.4% 16.8% 15.9%
Net Income Margin % 8.9% 9.8% 9.9% 9.0% 8.0% 5.9% 7.7% 9.0% 10.4% 9.5% 8.9%
Same Store Sales Grow th % 6.3% 4.5% 4.6% 4.9% 1.0% (2.4%) 4.4% 7.8% 5.9% 2.7% 2.4%
Asset Turnover
Total Asset Turnover 1.8x 1.7x 1.8x 1.8x 1.8x 1.8x 1.7x 1.6x 1.7x 1.8x 1.8x
Fixed Asset Turnover 9.5x 9.1x 8.6x 7.9x 6.9x 6.4x 6.9x 7.8x 8.2x 8.2x 7.6x
Inventory Turnover 2.7x 2.7x 2.7x 2.7x 2.6x 2.7x 2.7x 2.8x 2.8x 2.9x 2.8x
Short Term Liquidity
Current Ratio 2.6x 2.4x 2.1x 2.4x 2.1x 2.7x 3.1x 3.1x 3.1x 2.4x 2.1x
Quick Ratio 1.1x 1.0x 0.7x 0.9x 0.2x 0.7x 1.3x 1.4x 1.3x 0.6x 0.5x
Cash from Ops. to Curr. Liab. 0.7x 0.7x 0.7x 0.5x 0.6x 0.6x 0.8x 0.7x 0.9x 0.7x 0.8x
Avg. Days Inventory Out. 134.9 133.0 134.4 137.7 137.8 136.8 134.0 132.1 132.1 129.0 132.3
Avg. Days Payable Out. 51.4 49.8 51.6 53.5 51.0 45.3 43.2 45.0 46.9 44.6 52.1
Long Term Solvency
Total Debt/Equity NA NA NA NA NA NA NA NA NA 2.7% 2.8%
Total Debt/Capital NA NA NA NA NA NA NA NA NA 2.6% 2.7%
LT Debt/Equity NA NA NA NA NA NA NA NA NA 2.7% 2.7%
LT Debt/Capital NA NA NA NA NA NA NA NA NA 2.6% 2.7%
Total Liabilities/Total Assets 30.5% 31.1% 33.1% 33.1% 33.4% 29.7% 29.1% 30.4% 31.5% 35.0% 38.0%
Compound Annual Growth Rate Over Five Years
Total Revenue 26.5% 22.6% 19.4% 17.7% 14.0% 10.0% 8.7% 8.6% 7.5% 9.1% 9.8%
Gross Profit 26.6% 23.3% 20.3% 18.6% 14.0% 8.9% 8.0% 7.8% 6.8% 8.5% 9.7%
EBITDA 31.9% 29.9% 25.4% 20.1% 12.4% 3.2% 5.5% 8.3% 11.4% 13.0% 16.6%
Net Income 32.6% 30.9% 27.2% 22.0% 13.2% 1.3% 3.5% 6.7% 10.7% 13.0% 19.2%
Diluted EPS before Extra 31.0% 29.1% 26.6% 23.1% 16.0% 4.6% 6.9% 9.8% 14.2% 16.8% 23.9%
Tangible Book Value 34.7% 29.5% 20.7% 17.8% 10.2% 8.7% 10.9% 12.1% 8.3% 7.2% 2.7%

More Related Content

What's hot

Virgin mobiles pricing for the very first time
Virgin mobiles  pricing for the very first timeVirgin mobiles  pricing for the very first time
Virgin mobiles pricing for the very first timeSwapnil Soni
 
Clique Pens - Case Study Solution by Kamal Allazov (Essay type)
Clique Pens - Case Study Solution by Kamal Allazov (Essay type)Clique Pens - Case Study Solution by Kamal Allazov (Essay type)
Clique Pens - Case Study Solution by Kamal Allazov (Essay type)
Kamal Allazov (MSc.)
 
Thomas Green Case Study Presentation.
Thomas Green Case Study Presentation.Thomas Green Case Study Presentation.
Thomas Green Case Study Presentation.
Mimansha Bahadur
 
Shouldice Hospital
Shouldice HospitalShouldice Hospital
Shouldice Hospital
tarunkdl
 
Mountain Man Brewing Company - Harvard Business School Case Study
Mountain Man Brewing Company - Harvard Business School Case StudyMountain Man Brewing Company - Harvard Business School Case Study
Mountain Man Brewing Company - Harvard Business School Case Study
Shruti Sinha
 
Mountain Man Brewing Company - Case Study
Mountain Man Brewing Company - Case StudyMountain Man Brewing Company - Case Study
Mountain Man Brewing Company - Case Study
Ashwin C
 
Unilever Brazil Case
Unilever Brazil CaseUnilever Brazil Case
Unilever Brazil Case
Prakhar Jain
 
Visual Support of Brannigan Foods Exercise
Visual Support of Brannigan Foods ExerciseVisual Support of Brannigan Foods Exercise
Visual Support of Brannigan Foods Exercise
Juan Manuel Restrepo
 
Starbucks delivering customer service
Starbucks delivering customer serviceStarbucks delivering customer service
Starbucks delivering customer service
Monoj Kumar Rabha
 
Wal-Mart Stores’ Discount operations
Wal-Mart Stores’ Discount operationsWal-Mart Stores’ Discount operations
Wal-Mart Stores’ Discount operations
AJAL A J
 
Reliance Baking Soda: Optimizing Promotional Spending (HBR Brief Case)
Reliance Baking Soda: Optimizing Promotional Spending (HBR Brief Case)Reliance Baking Soda: Optimizing Promotional Spending (HBR Brief Case)
Reliance Baking Soda: Optimizing Promotional Spending (HBR Brief Case)
Siddharth Barjatya
 
Rosewood Hotels and Resorts: Branding to increase Customer Profitability and ...
Rosewood Hotels and Resorts: Branding to increase Customer Profitability and ...Rosewood Hotels and Resorts: Branding to increase Customer Profitability and ...
Rosewood Hotels and Resorts: Branding to increase Customer Profitability and ...
Pallabh Bhura
 
Starbuck's case study
Starbuck's case studyStarbuck's case study
Starbuck's case study
offofo2003
 
Colgate-Palmolive Case Study
Colgate-Palmolive Case StudyColgate-Palmolive Case Study
Colgate-Palmolive Case Study
Subho Mistri
 
Jc penney case study
Jc penney  case studyJc penney  case study
Jc penney case study
Zahid Mehraj
 
Sale soft inc
Sale soft incSale soft inc
Sale soft inc
Utkarsh Shivam
 
S51 - Ben & Jerry's in Japan
S51 - Ben & Jerry's in JapanS51 - Ben & Jerry's in Japan
S51 - Ben & Jerry's in Japan
Jochem Donkers
 
Tweeter Electronics: Marketing Case Analysis
Tweeter Electronics: Marketing Case AnalysisTweeter Electronics: Marketing Case Analysis
Tweeter Electronics: Marketing Case Analysis
Dipak Senapati
 
Optical Distortion, Inc
Optical Distortion, IncOptical Distortion, Inc
Optical Distortion, Inc
ulugbek55
 

What's hot (20)

Virgin mobiles pricing for the very first time
Virgin mobiles  pricing for the very first timeVirgin mobiles  pricing for the very first time
Virgin mobiles pricing for the very first time
 
Clique Pens - Case Study Solution by Kamal Allazov (Essay type)
Clique Pens - Case Study Solution by Kamal Allazov (Essay type)Clique Pens - Case Study Solution by Kamal Allazov (Essay type)
Clique Pens - Case Study Solution by Kamal Allazov (Essay type)
 
Thomas Green Case Study Presentation.
Thomas Green Case Study Presentation.Thomas Green Case Study Presentation.
Thomas Green Case Study Presentation.
 
Shouldice Hospital
Shouldice HospitalShouldice Hospital
Shouldice Hospital
 
Mountain Man Brewing Company - Harvard Business School Case Study
Mountain Man Brewing Company - Harvard Business School Case StudyMountain Man Brewing Company - Harvard Business School Case Study
Mountain Man Brewing Company - Harvard Business School Case Study
 
The Fashion Channel
The Fashion ChannelThe Fashion Channel
The Fashion Channel
 
Mountain Man Brewing Company - Case Study
Mountain Man Brewing Company - Case StudyMountain Man Brewing Company - Case Study
Mountain Man Brewing Company - Case Study
 
Unilever Brazil Case
Unilever Brazil CaseUnilever Brazil Case
Unilever Brazil Case
 
Visual Support of Brannigan Foods Exercise
Visual Support of Brannigan Foods ExerciseVisual Support of Brannigan Foods Exercise
Visual Support of Brannigan Foods Exercise
 
Starbucks delivering customer service
Starbucks delivering customer serviceStarbucks delivering customer service
Starbucks delivering customer service
 
Wal-Mart Stores’ Discount operations
Wal-Mart Stores’ Discount operationsWal-Mart Stores’ Discount operations
Wal-Mart Stores’ Discount operations
 
Reliance Baking Soda: Optimizing Promotional Spending (HBR Brief Case)
Reliance Baking Soda: Optimizing Promotional Spending (HBR Brief Case)Reliance Baking Soda: Optimizing Promotional Spending (HBR Brief Case)
Reliance Baking Soda: Optimizing Promotional Spending (HBR Brief Case)
 
Rosewood Hotels and Resorts: Branding to increase Customer Profitability and ...
Rosewood Hotels and Resorts: Branding to increase Customer Profitability and ...Rosewood Hotels and Resorts: Branding to increase Customer Profitability and ...
Rosewood Hotels and Resorts: Branding to increase Customer Profitability and ...
 
Starbuck's case study
Starbuck's case studyStarbuck's case study
Starbuck's case study
 
Colgate-Palmolive Case Study
Colgate-Palmolive Case StudyColgate-Palmolive Case Study
Colgate-Palmolive Case Study
 
Jc penney case study
Jc penney  case studyJc penney  case study
Jc penney case study
 
Sale soft inc
Sale soft incSale soft inc
Sale soft inc
 
S51 - Ben & Jerry's in Japan
S51 - Ben & Jerry's in JapanS51 - Ben & Jerry's in Japan
S51 - Ben & Jerry's in Japan
 
Tweeter Electronics: Marketing Case Analysis
Tweeter Electronics: Marketing Case AnalysisTweeter Electronics: Marketing Case Analysis
Tweeter Electronics: Marketing Case Analysis
 
Optical Distortion, Inc
Optical Distortion, IncOptical Distortion, Inc
Optical Distortion, Inc
 

Similar to Bed Bath and Beyond

Bed Bath & Beyond Inc. (BBBY) - Investment Report
Bed Bath & Beyond Inc. (BBBY) - Investment ReportBed Bath & Beyond Inc. (BBBY) - Investment Report
Bed Bath & Beyond Inc. (BBBY) - Investment ReportAaron Meer
 
Home depot - Stock Pitch
Home depot - Stock PitchHome depot - Stock Pitch
Home depot - Stock Pitch
Nhat Pham
 
Q and a what do i look for in a 10 k
Q and a what do i look for in a 10 kQ and a what do i look for in a 10 k
Q and a what do i look for in a 10 k
tpateraki
 
20180620 sauc oppenheimer consumer conference widescreen final
20180620 sauc oppenheimer consumer conference widescreen final20180620 sauc oppenheimer consumer conference widescreen final
20180620 sauc oppenheimer consumer conference widescreen final
drhincorporated
 
Seminar 8 creating an investment recommendation
Seminar 8   creating an investment recommendationSeminar 8   creating an investment recommendation
Seminar 8 creating an investment recommendationpvalantagul
 
CHAPTER 9—FOR THE INVESTORMULTIPLE CHOICE1.The ratio per.docx
CHAPTER 9—FOR THE INVESTORMULTIPLE CHOICE1.The ratio per.docxCHAPTER 9—FOR THE INVESTORMULTIPLE CHOICE1.The ratio per.docx
CHAPTER 9—FOR THE INVESTORMULTIPLE CHOICE1.The ratio per.docx
christinemaritza
 
Module 2 Rawhide Brewery Mini-case Template KeyProposal Summa.docx
Module 2 Rawhide Brewery Mini-case Template KeyProposal Summa.docxModule 2 Rawhide Brewery Mini-case Template KeyProposal Summa.docx
Module 2 Rawhide Brewery Mini-case Template KeyProposal Summa.docx
raju957290
 
Company Erie Presentation
Company Erie PresentationCompany Erie Presentation
Company Erie PresentationEunice Lim
 
Target by icm version 3.0
Target by icm version 3.0Target by icm version 3.0
Target by icm version 3.0
thomas paulson
 
Target by icm version 3.0
Target by icm version 3.0Target by icm version 3.0
Target by icm version 3.0
thomas paulson
 
MBA 503 Team Presentation
MBA 503 Team PresentationMBA 503 Team Presentation
MBA 503 Team PresentationTodd_Weston
 
Running Head EVALUATION OF CORPORATE PERFORMANCE .docx
Running Head EVALUATION OF CORPORATE PERFORMANCE                 .docxRunning Head EVALUATION OF CORPORATE PERFORMANCE                 .docx
Running Head EVALUATION OF CORPORATE PERFORMANCE .docx
charisellington63520
 
VF corporation case analysis
VF corporation case analysisVF corporation case analysis
VF corporation case analysis
MD. Mahmudul Hasan
 
WFM - Initiating Coverage - Report
WFM - Initiating Coverage - ReportWFM - Initiating Coverage - Report
WFM - Initiating Coverage - Report
Alessandro Masi
 
AvalonBay Communities Inc.
AvalonBay Communities Inc.AvalonBay Communities Inc.
AvalonBay Communities Inc.
Sergio Miqueleti
 
DSP Equity Oppotunities Fund
DSP Equity Oppotunities FundDSP Equity Oppotunities Fund
DSP Equity Oppotunities Fund
DSP Mutual Fund
 
DLEON INC., PART Statements and Taxes Donna Jamison, a 2009 graduat.pdf
DLEON INC., PART Statements and Taxes Donna Jamison, a 2009 graduat.pdfDLEON INC., PART Statements and Taxes Donna Jamison, a 2009 graduat.pdf
DLEON INC., PART Statements and Taxes Donna Jamison, a 2009 graduat.pdf
arsmobiles
 
L 9 chapter 9 long-term financial planning and corporate growth
L 9  chapter 9 long-term financial planning and corporate growthL 9  chapter 9 long-term financial planning and corporate growth
L 9 chapter 9 long-term financial planning and corporate growth
University of Jaen Spain
 
Cleveland Research Company Stock Pitch 2016 - Finalist
Cleveland Research Company Stock Pitch 2016 - FinalistCleveland Research Company Stock Pitch 2016 - Finalist
Cleveland Research Company Stock Pitch 2016 - Finalist
Sean Hynes
 
Big lots Research
Big lots ResearchBig lots Research
Big lots Researchjoajo
 

Similar to Bed Bath and Beyond (20)

Bed Bath & Beyond Inc. (BBBY) - Investment Report
Bed Bath & Beyond Inc. (BBBY) - Investment ReportBed Bath & Beyond Inc. (BBBY) - Investment Report
Bed Bath & Beyond Inc. (BBBY) - Investment Report
 
Home depot - Stock Pitch
Home depot - Stock PitchHome depot - Stock Pitch
Home depot - Stock Pitch
 
Q and a what do i look for in a 10 k
Q and a what do i look for in a 10 kQ and a what do i look for in a 10 k
Q and a what do i look for in a 10 k
 
20180620 sauc oppenheimer consumer conference widescreen final
20180620 sauc oppenheimer consumer conference widescreen final20180620 sauc oppenheimer consumer conference widescreen final
20180620 sauc oppenheimer consumer conference widescreen final
 
Seminar 8 creating an investment recommendation
Seminar 8   creating an investment recommendationSeminar 8   creating an investment recommendation
Seminar 8 creating an investment recommendation
 
CHAPTER 9—FOR THE INVESTORMULTIPLE CHOICE1.The ratio per.docx
CHAPTER 9—FOR THE INVESTORMULTIPLE CHOICE1.The ratio per.docxCHAPTER 9—FOR THE INVESTORMULTIPLE CHOICE1.The ratio per.docx
CHAPTER 9—FOR THE INVESTORMULTIPLE CHOICE1.The ratio per.docx
 
Module 2 Rawhide Brewery Mini-case Template KeyProposal Summa.docx
Module 2 Rawhide Brewery Mini-case Template KeyProposal Summa.docxModule 2 Rawhide Brewery Mini-case Template KeyProposal Summa.docx
Module 2 Rawhide Brewery Mini-case Template KeyProposal Summa.docx
 
Company Erie Presentation
Company Erie PresentationCompany Erie Presentation
Company Erie Presentation
 
Target by icm version 3.0
Target by icm version 3.0Target by icm version 3.0
Target by icm version 3.0
 
Target by icm version 3.0
Target by icm version 3.0Target by icm version 3.0
Target by icm version 3.0
 
MBA 503 Team Presentation
MBA 503 Team PresentationMBA 503 Team Presentation
MBA 503 Team Presentation
 
Running Head EVALUATION OF CORPORATE PERFORMANCE .docx
Running Head EVALUATION OF CORPORATE PERFORMANCE                 .docxRunning Head EVALUATION OF CORPORATE PERFORMANCE                 .docx
Running Head EVALUATION OF CORPORATE PERFORMANCE .docx
 
VF corporation case analysis
VF corporation case analysisVF corporation case analysis
VF corporation case analysis
 
WFM - Initiating Coverage - Report
WFM - Initiating Coverage - ReportWFM - Initiating Coverage - Report
WFM - Initiating Coverage - Report
 
AvalonBay Communities Inc.
AvalonBay Communities Inc.AvalonBay Communities Inc.
AvalonBay Communities Inc.
 
DSP Equity Oppotunities Fund
DSP Equity Oppotunities FundDSP Equity Oppotunities Fund
DSP Equity Oppotunities Fund
 
DLEON INC., PART Statements and Taxes Donna Jamison, a 2009 graduat.pdf
DLEON INC., PART Statements and Taxes Donna Jamison, a 2009 graduat.pdfDLEON INC., PART Statements and Taxes Donna Jamison, a 2009 graduat.pdf
DLEON INC., PART Statements and Taxes Donna Jamison, a 2009 graduat.pdf
 
L 9 chapter 9 long-term financial planning and corporate growth
L 9  chapter 9 long-term financial planning and corporate growthL 9  chapter 9 long-term financial planning and corporate growth
L 9 chapter 9 long-term financial planning and corporate growth
 
Cleveland Research Company Stock Pitch 2016 - Finalist
Cleveland Research Company Stock Pitch 2016 - FinalistCleveland Research Company Stock Pitch 2016 - Finalist
Cleveland Research Company Stock Pitch 2016 - Finalist
 
Big lots Research
Big lots ResearchBig lots Research
Big lots Research
 

Bed Bath and Beyond

  • 1. Bed Bath & Beyond (NYSE:BBBY) Confidential CMP:USD 71.5 Market Capitalisation: USD 13.2 Billion Overview Bed bath & Beyond (or “the Company”) is a chain of domestic merchandise retail stores in United States and Canada. The Company retails house furnishing products for bedroom, bathroom, kitchen and dining room. This business fits within my investment theme of repetitive consumer demand. I think it’s a great investment since a) The Company enjoys leadership position in the market. b) The Company will continue to generate strong cash flows c) The Company trades at a P/E of 13.48x compared to its peers which trade much higher. Hence, I would initiate a buy on the stock with an upside of 25% from current levels. Industry The US home furnishing and furniture category grew by 4.4% during 2013. Sales in the retail segment was $ 101 billion ( $52 million in furniture and $49 million home furnishings) in line with levels in 03-04 but significantly below the peak levels of $113 billion. The industry is expected to grow at a faster rate buoyed by the general economic recovery in US and the bounce back in the housing market. Company Overview The Company is the largest player in the housewares and domestic merchandise sector and operates in United States, Canada, and Mexico with over 1,550 stores spread over 42.6 million square feet. The Company sells products under the following five formats: Bed Bath and Beyond stores contribute to over 60% of total revenue over the years and will be a key revenue driver for the business in the years going forward. Name Particulars % Holding Mr. Warren Eisenberg Mr. WarrenEisenbergis a Co-Founder of BedBath& BeyondInc.andhas been its Co-Chairman since 1992. 1.63% Mr. Leonard Joseph Feinstein Mr. Leonard Joseph Feinstein is a Co-Founder of Bed Bath & Beyond, Inc. and has been its Co- Chairman since 1992. 1.05% Mr. Steven H. Temares Mr. Steven H. Temares has been the ChiefExecutive Officer at the Company since April 2003. Mr. Temares also servedas the Chief Operating Officer of the Company from 1997 to April 2003 and Executive Vice President from1997to1999. Prior to1997, heservedas a Director of Real Estate and General Counsel. 0.30% Mr. Arthur Stark Mr. Arthur Stark has been the President and Chief Merchandising Officer for the Company since January 03, 2006andJanuary 1999. Mr. Stark joined the Company in 1977 and served at different Merchandising position in the Company. 0.08% Ms. Susan E. Lattmann Ms. Susan E. Lattmann, has been Chief Financial OfficerandTreasurerof theCompany since February 2014. Ms. Lattmann has been Principal AccountingOfficerof Bed Bath & Beyond Inc. since April 7, 2009. 0.01% The Company has a strong management bench at the top supported by the two cofounders who have built the business through various business cycles. Currently over 97% of the shares in the Company are held by traditional investment managers. Some value funds (such as Brown Brothers Harriman and Robert Olsteing) and Balckrock have increased their stake in the Company increasing their conviction in the company. Investment Thesis a) The Company’s had been generating strong cashflows over the last four years (it has almost doubled during 2014). Format Description Number of Stores Bed Bath and Beyond stores 1,014 World Market & Cost Plus World Market 265 Buybuy Baby stores 90 Christmas Tree shop Giftware and household items 77 Harmon Beauty and health care 50 Home furnishings (bed linens and related items, bath items, and kitchen textiles) and home furnishings (kitchen tabletop, fine tabletop, basic housewares, general home furnishings, consumables, and certain juvenile products). Home decorating items, furniture, gifts, holiday and other seasonal items and specialty food and beverages Infant and toddler merchandise
  • 2. 2 b) The Company has grown at a five year CAGR of 9.8% while sustaining its operating margins in the high teens over the last five years. c) The Company has been utilising its operating cash flows to buy back shares and has bought back USD 6.6 billion shares from investors in the last decade. The Company has recently raised USD 1.5 billion as debt to buyback equity aggregating to USD 2.7 billion at an average cost of 4-5% which will boost its returns. d) The Company has consistently delivered mid teen returns ROE’s and ROCE’s. e) The stock price had been under pressure due to results below expectations and low management guidance for the year. Key Risks a) The Company’s P/E ratio has fallen from 30 times to 14 times earnings in the past decade. This points either to a deterioration in the business model or slower growth in the business. The multiples have declined due to i) The Company facing intense competition from online retailers (such as Amazon) and ii) slow growth from existing stores. The Company has entered into the online space which should pick pace. Further, as a consumer psyche I think that the consumers would still want to actually see the product before buying. Second, of the last 10 years growth during five years were lost on account of the slowdown in the housing market. If the business scenario improves the Company will clock in higher growth rates. Even in the bad years the Company has been generating cash flows. b) The housing market might not recover and consumers would start curtailing their expenses. During the last decade the Company has had only a one year of negative same store sales growth whereas its competitors have not fared well post the crisis. Further, with a strong cash position the Company will be ready to takeover the existing competitors. c) Pressure on Gross Margins: There has been a severe pressure on the Company’s gross margins over the past few years. In fact it has come down below 40% for the first time in decades. The industry has been undergoing a many structural changes which has led to competitors raking a price war. The Company has to tackle such price war by lowering prices. Though the business can recover s uch margins due to its scale of purchasing power. Valuation On a comparable valuation analysis we observe that the Company is trading at a significant discount to its market competitors. Given the leadership position of the Company in the market coupled with the recent push towards new channels for growth (i.e. online) and strong cash flows to support it we believe that the market has been undervaluing the Company due to low growth. The market should give some kind of premium to the market leader in the industry. Further, given the online initiative launched by the Company there might be an growth surprise. We have recalibrated the valuation of the Company considering various P/E scenarios. Company Name Revenue Market Cap Net Debt Gross Margin % EBITDA % Debt/Capital % NTM TEV/Forward EBITDA NTM Forward P/E Bed Bath & Beyond Inc. (NasdaqGS:BBBY) 12,146.96 13,250.1 213.4 39.3% 15.4% 33.8% 7.45x 13.50x Williams-Sonoma Inc. (NYSE:WSM) 4,859.84 6,510.4 (68.6) 38.7% 13.9% 0.2% 9.53x 20.94x The Home Depot, Inc. (NYSE:HD) 84,581.81 1,32,223.4 12,520.0 34.8% 14.3% 59.4% 11.42x 20.05x Pier 1 Imports, Inc. (NYSE:PIR) 1,945.03 1,258.1 165.0 56.9% 11.2% 38.9% 6.71x 13.71x Restoration Hardware Holdings, Inc. (NYSE:RH) 2,024.54 3,267.7 166.6 36.5% 12.2% 36.2% 15.35x 32.70x Mean 10.1x 20.2x Median 9.5x 20.1x P/E 2016 2017 13.5x 74.9 81.4 14.0x 77.7 84.4 14.5x 80.5 87.4 15.0x 83.3 90.4 15.5x 86.0 93.4 16.0x 88.8 96.5 17.0x 94.4 102.5 18.0x 99.9 108.5 19.0x 105.5 114.5 20.0x 111.0 120.6
  • 3. 3 Valuing the Company at an average multiple of 16x we arrive at a price of USD 89 (an upside potential of 25%). If we value the Company at the median (20x) then we arrive at a valuation of USD 111 per share (a 56% increase) although we feel that real impact on earnings as a result of share buybacks will come in 2017 and later years. Hence, if we take a multiple benchmark of 14x FY 17 earnings we arrive at a valuation of USD 85. We ran a DCF analysis on the cash flows of the Company assuming that the Company retains its current growth trajectory and gross margins. We have assumed that the Company buys back shares aggregating to USD 2.7 billion over the next three years. The WACC for the Company has been calculated at 7.84% considering the current leverage. Terminal Value has been calculated assuming a terminal growth of 2.5%. Considering dcf valuation the value of the Company works out to USD 91.4 given the strong cash flows of the Company in the coming years. Conclusion Taking an average of the prices derived from the above two methods we arrive at a price of USD 90.2. (USD Million) FY 2015 FY 2016 FY 2017 FCFF 921.3 1,012.9 1,045.3 TV 19,574.1 Discounted 854.3 871.0 16,441.2 Enterprise Value 18,166.5 Less Debt 1,500.0 Equity Value (per share) 91.4
  • 4. 4 Annexure Income Statement Cash Flow USD Million FY2004 FY2005 FY2006 FY2007 FY2008 FY2009 FY2010 FY2011 FY2012 FY2013 FY2014 Revenue 4,478.0 5,147.7 5,809.6 6,617.4 7,048.9 7,208.3 7,828.8 8,758.5 9,499.9 10,914.6 11,504.0 Other Revenue - - - - - - - - - - - Total Revenue 4,478.0 5,147.7 5,809.6 6,617.4 7,048.9 7,208.3 7,828.8 8,758.5 9,499.9 10,914.6 11,504.0 Cost Of Goods Sold 2,601.3 2,961.4 3,323.8 3,782.0 4,123.7 4,335.1 4,620.7 5,135.6 5,569.0 6,525.8 6,938.4 Gross Profit 1,876.7 2,186.3 2,485.7 2,835.4 2,925.2 2,873.2 3,208.1 3,622.9 3,930.9 4,388.8 4,565.6 Selling General & Admin Exp. 1,237.3 1,393.9 1,606.6 1,946.0 2,087.2 2,199.3 2,227.4 2,334.5 2,362.6 2,750.5 2,951.0 R & D Exp. - - - - - - - - - - - Depreciation & Amort. - - - - - - - - - - - Other Operating Expense/(Income) - - - - - - - - - - - Other Operating Exp., Total 1,237.3 1,393.9 1,606.6 1,946.0 2,087.2 2,199.3 2,227.4 2,334.5 2,362.6 2,750.5 2,951.0 Operating Income 639.3 792.4 879.2 889.4 838.0 673.9 980.7 1,288.5 1,568.4 1,638.2 1,614.6 Interest Expense - - - - - - - - - (4.2) (1.1) Interest and Invest. Income 10.2 18.8 35.9 43.5 27.2 9.4 4.6 4.5 1.1 - - Net Interest Exp. 10.2 18.8 35.9 43.5 27.2 9.4 4.6 4.5 1.1 (4.2) (1.1) Other Non-Operating Inc. (Exp.) - - - - - - - - - - - EBT Excl. Unusual Items 649.5 811.2 915.1 932.9 865.2 683.3 985.3 1,293.0 1,569.5 1,634.1 1,613.4 Impairment of Goodwill - - - - - - - - - - - Other Unusual Items - - - - - - - - - - - EBT Incl. Unusual Items 649.5 811.2 915.1 932.9 865.2 683.3 985.3 1,293.0 1,569.5 1,634.1 1,613.4 Income TaxExpense 250.1 306.2 342.2 338.6 302.4 258.2 385.2 501.6 580.0 596.3 591.2 Earnings from Cont. Ops. 399.5 505.0 572.8 594.2 562.8 425.1 600.0 791.3 989.5 1,037.8 1,022.3 Earnings of Discontinued Ops. - - - - - - - - - - - Extraord. Item& Account. Change - - - - - - - - - - - Net Income to Company 399.5 505.0 572.8 594.2 562.8 425.1 600.0 791.3 989.5 1,037.8 1,022.3 Minority Int. in Earnings - - - - - - - - - - - Net Income 399.5 505.0 572.8 594.2 562.8 425.1 600.0 791.3 989.5 1,037.8 1,022.3 Per Share Items Basic EPS $1.35 $1.68 $1.95 $2.12 $2.13 $1.66 $2.33 $3.11 $4.12 $4.62 $4.85 Diluted EPS $1.31 $1.65 $1.92 $2.09 $2.1 $1.64 $2.3 $3.07 $4.06 $4.56 $4.79 Diluted EPS Excl. Extra Items 1.31 1.65 1.92 2.09 2.1 1.64 2.3 3.07 4.06 4.56 4.79 Weighted Avg. Diluted Shares Out. 304.7 306.6 299.0 285.0 268.4 258.6 260.4 258.1 243.9 227.7 213.4
  • 5. 5 Balance Sheet (USD Million) FY2004 FY2005 FY2006 FY2007 FY2008 FY2009 FY2010 FY2011 FY2012 FY2013 FY2014 Net Income 399.5 505.0 572.8 594.2 562.8 425.1 600.0 791.3 989.5 1,037.8 1,022.3 Depreciation & Amort. 84.6 97.5 111.1 133.0 157.8 175.6 184.2 183.8 183.9 194.7 218.8 Depreciation & Amort., Total 84.6 97.5 111.1 133.0 157.8 175.6 184.2 183.8 183.9 194.7 218.8 (Gain) Loss On Sale Of Invest. - - 3.2 3.5 1.5 - - - - - - Stock-Based Compensation - - 26.4 52.6 43.8 43.7 44.2 44.3 45.2 47.2 56.2 Tax Benefit from Stock Options 64.8 27.0 20.0 6.7 2.7 (1.2) (6.0) (3.5) 0.1 13.2 12.8 Other Operating Activities (1.9) 5.7 (25.9) (87.2) 2.3 (21.8) (23.2) (17.7) 28.6 18.3 10.1 Change in Trad. Asset Securities - - (0.4) (3.0) (3.0) 0 (5.6) (5.5) (4.5) (6.2) (11.4) Change In Inventories (27.1) (139.7) (149.7) (204.1) (96.7) (25.4) (117.4) (209.2) (103.0) (198.4) (112.7) Change in Acc. Payable 15.3 42.5 64.9 75.9 (31.8) (40.9) 96.3 102.3 31.6 105.3 178.1 Change in Unearned Rev. 19.0 23.9 26.5 30.2 24.4 (5.6) 7.2 20.3 16.6 36.9 32.7 Change in Inc. Taxes (38.0) 47.5 10.7 21.6 (74.5) 24.7 70.5 25.5 (37.4) 6.6 (4.5) Change in Other Net Operating Assets 28.1 (2.4) 0.8 (9.8) 25.2 9.8 55.1 55.8 74.7 (62.3) (19.3) Cash from Ops. 544.4 607.0 660.4 613.6 614.5 584.0 905.4 987.4 1,225.3 1,193.0 1,383.2 Capital Expenditure (109.0) (181.4) (220.4) (317.5) (358.2) (215.9) (153.7) (183.5) (243.4) (314.7) (317.2) Cash Acquisitions (175.5) - - - (85.9) - - - - (643.1) - Divestitures - - - - - - - - - - - Sale (Purchase) of Intangible assets - - - - - - - - - (40.0) - Invest. in Marketable & Equity Securt. (398.7) (172.3) 152.8 (80.2) 545.8 102.8 (335.0) (157.5) (120.6) 332.0 (42.6) Net (Inc.) Dec. in Loans Originated/Sold - - - - - - - - - - - Other Investing Activities - - - - - - - - - - - Cash from Investing (683.2) (353.7) (67.6) (397.7) 101.7 (113.1) (488.7) (341.0) (364.0) (665.8) (359.8) Short Term Debt Issued - - - - - - - - - - - Long-Term Debt Issued - - - - - - - - - - - Total Debt Issued - - - - - - - - - - - Short Term Debt Repaid - - - - - - - - - - - Long-Term Debt Repaid (21.2) - - - - - - - - (25.5) - Total Debt Repaid (21.2) - - - - - - - - (25.5) - Issuance of Common Stock 74.6 31.1 35.0 43.4 22.7 17.7 99.7 125.7 171.1 56.4 54.8 Repurchase of Common Stock - (350.2) (598.2) (301.0) (734.2) (48.1) (94.9) (687.6) (1,218.0) (1,001.3) (1,284.0) Total Dividends Paid - - - - - - - - - - - Special Dividend Paid - - - - - - - - - - - Other Financing Activities - (6.7) (4.0) 7.3 6.0 3.7 6.3 2.9 5.2 5.0 7.3 Cash from Financing 53.4 (325.7) (567.3) (250.3) (705.5) (26.8) 11.2 (559.0) (1,041.7) (965.4) (1,221.9) Net Change in Cash (85.4) (72.4) 25.6 (34.3) 10.7 444.1 427.9 87.5 (180.4) (438.2) (198.5)
  • 6. 6 Ratios (USD Million) Aug-30-2014 ASSETS Cash And Equivalents 1,226.6 Short Term Investments 60.0 Total Cash & ST Investments 1,286.6 Accounts Receivable - Total Receivables - Inventory 2,758.7 Deferred Tax Assets, Curr. - Other Current Assets 434.4 Total Current Assets 4,479.8 Gross Property, Plant & Equipment 3,676.9 Accumulated Depreciation (2,100.0) Net Property, Plant & Equipment 1,576.9 Long-term Investments 92.4 Goodw ill 486.3 Other Intangibles - Deferred Tax Assets, LT - Other Long-Term Assets 398.9 Total Assets 7,034.3 LIABILITIES Accounts Payable 1,258.6 Accrued Exp. 407.2 Curr. Port. of Cap. Leases - Curr. Income Taxes Payable 46.5 Unearned Revenue, Current 294.7 Other Current Liabilities - Total Current Liabilities 2,006.9 Long-Term Debt 1,500.0 Capital Leases - Pension & Other Post-Retire. Benefits - Other Non-Current Liabilities 588.2 Total Liabilities 4,095.1 Common Stock 3.4 Additional Paid In Capital 1,560.1 Retained Earnings 9,006.9 Treasury Stock (7,620.6) Comprehensive Inc. and Other (10.6) Total Common Equity 2,939.2 Total Equity 2,939.2 Total Liabilities And Equity 7,034.3
  • 7. 7 (USD Million) FY2004 FY2005 FY2006 FY2007 FY2008 FY2009 FY2010 FY2011 FY2012 FY2013 FY2014 Profitability Return on Assets % 15.8% 16.3% 16.7% 15.1% 13.4% 10.4% 13.0% 14.9% 17.2% 17.1% 16.0% Return on Capital % 23.2% 23.6% 24.6% 22.6% 20.1% 15.1% 18.4% 21.2% 25.0% 25.2% 24.5% Return on Equity % 23.2% 24.1% 25.7% 24.2% 21.6% 15.3% 18.0% 20.9% 25.2% 25.9% 25.5% Return on Common Equity % 23.2% 24.1% 25.7% 24.2% 21.6% 15.3% 18.0% 20.9% 25.2% 25.9% 25.5% Margin Analysis Gross Margin % 41.9% 42.5% 42.8% 42.8% 41.5% 39.9% 41.0% 41.4% 41.4% 40.2% 39.7% SG&A Margin % 27.6% 27.1% 27.7% 29.4% 29.6% 30.5% 28.5% 26.7% 24.9% 25.2% 25.7% EBITDA Margin % 16.2% 17.3% 17.0% 15.4% 14.1% 11.8% 14.9% 16.8% 18.4% 16.8% 15.9% Net Income Margin % 8.9% 9.8% 9.9% 9.0% 8.0% 5.9% 7.7% 9.0% 10.4% 9.5% 8.9% Same Store Sales Grow th % 6.3% 4.5% 4.6% 4.9% 1.0% (2.4%) 4.4% 7.8% 5.9% 2.7% 2.4% Asset Turnover Total Asset Turnover 1.8x 1.7x 1.8x 1.8x 1.8x 1.8x 1.7x 1.6x 1.7x 1.8x 1.8x Fixed Asset Turnover 9.5x 9.1x 8.6x 7.9x 6.9x 6.4x 6.9x 7.8x 8.2x 8.2x 7.6x Inventory Turnover 2.7x 2.7x 2.7x 2.7x 2.6x 2.7x 2.7x 2.8x 2.8x 2.9x 2.8x Short Term Liquidity Current Ratio 2.6x 2.4x 2.1x 2.4x 2.1x 2.7x 3.1x 3.1x 3.1x 2.4x 2.1x Quick Ratio 1.1x 1.0x 0.7x 0.9x 0.2x 0.7x 1.3x 1.4x 1.3x 0.6x 0.5x Cash from Ops. to Curr. Liab. 0.7x 0.7x 0.7x 0.5x 0.6x 0.6x 0.8x 0.7x 0.9x 0.7x 0.8x Avg. Days Inventory Out. 134.9 133.0 134.4 137.7 137.8 136.8 134.0 132.1 132.1 129.0 132.3 Avg. Days Payable Out. 51.4 49.8 51.6 53.5 51.0 45.3 43.2 45.0 46.9 44.6 52.1 Long Term Solvency Total Debt/Equity NA NA NA NA NA NA NA NA NA 2.7% 2.8% Total Debt/Capital NA NA NA NA NA NA NA NA NA 2.6% 2.7% LT Debt/Equity NA NA NA NA NA NA NA NA NA 2.7% 2.7% LT Debt/Capital NA NA NA NA NA NA NA NA NA 2.6% 2.7% Total Liabilities/Total Assets 30.5% 31.1% 33.1% 33.1% 33.4% 29.7% 29.1% 30.4% 31.5% 35.0% 38.0% Compound Annual Growth Rate Over Five Years Total Revenue 26.5% 22.6% 19.4% 17.7% 14.0% 10.0% 8.7% 8.6% 7.5% 9.1% 9.8% Gross Profit 26.6% 23.3% 20.3% 18.6% 14.0% 8.9% 8.0% 7.8% 6.8% 8.5% 9.7% EBITDA 31.9% 29.9% 25.4% 20.1% 12.4% 3.2% 5.5% 8.3% 11.4% 13.0% 16.6% Net Income 32.6% 30.9% 27.2% 22.0% 13.2% 1.3% 3.5% 6.7% 10.7% 13.0% 19.2% Diluted EPS before Extra 31.0% 29.1% 26.6% 23.1% 16.0% 4.6% 6.9% 9.8% 14.2% 16.8% 23.9% Tangible Book Value 34.7% 29.5% 20.7% 17.8% 10.2% 8.7% 10.9% 12.1% 8.3% 7.2% 2.7%