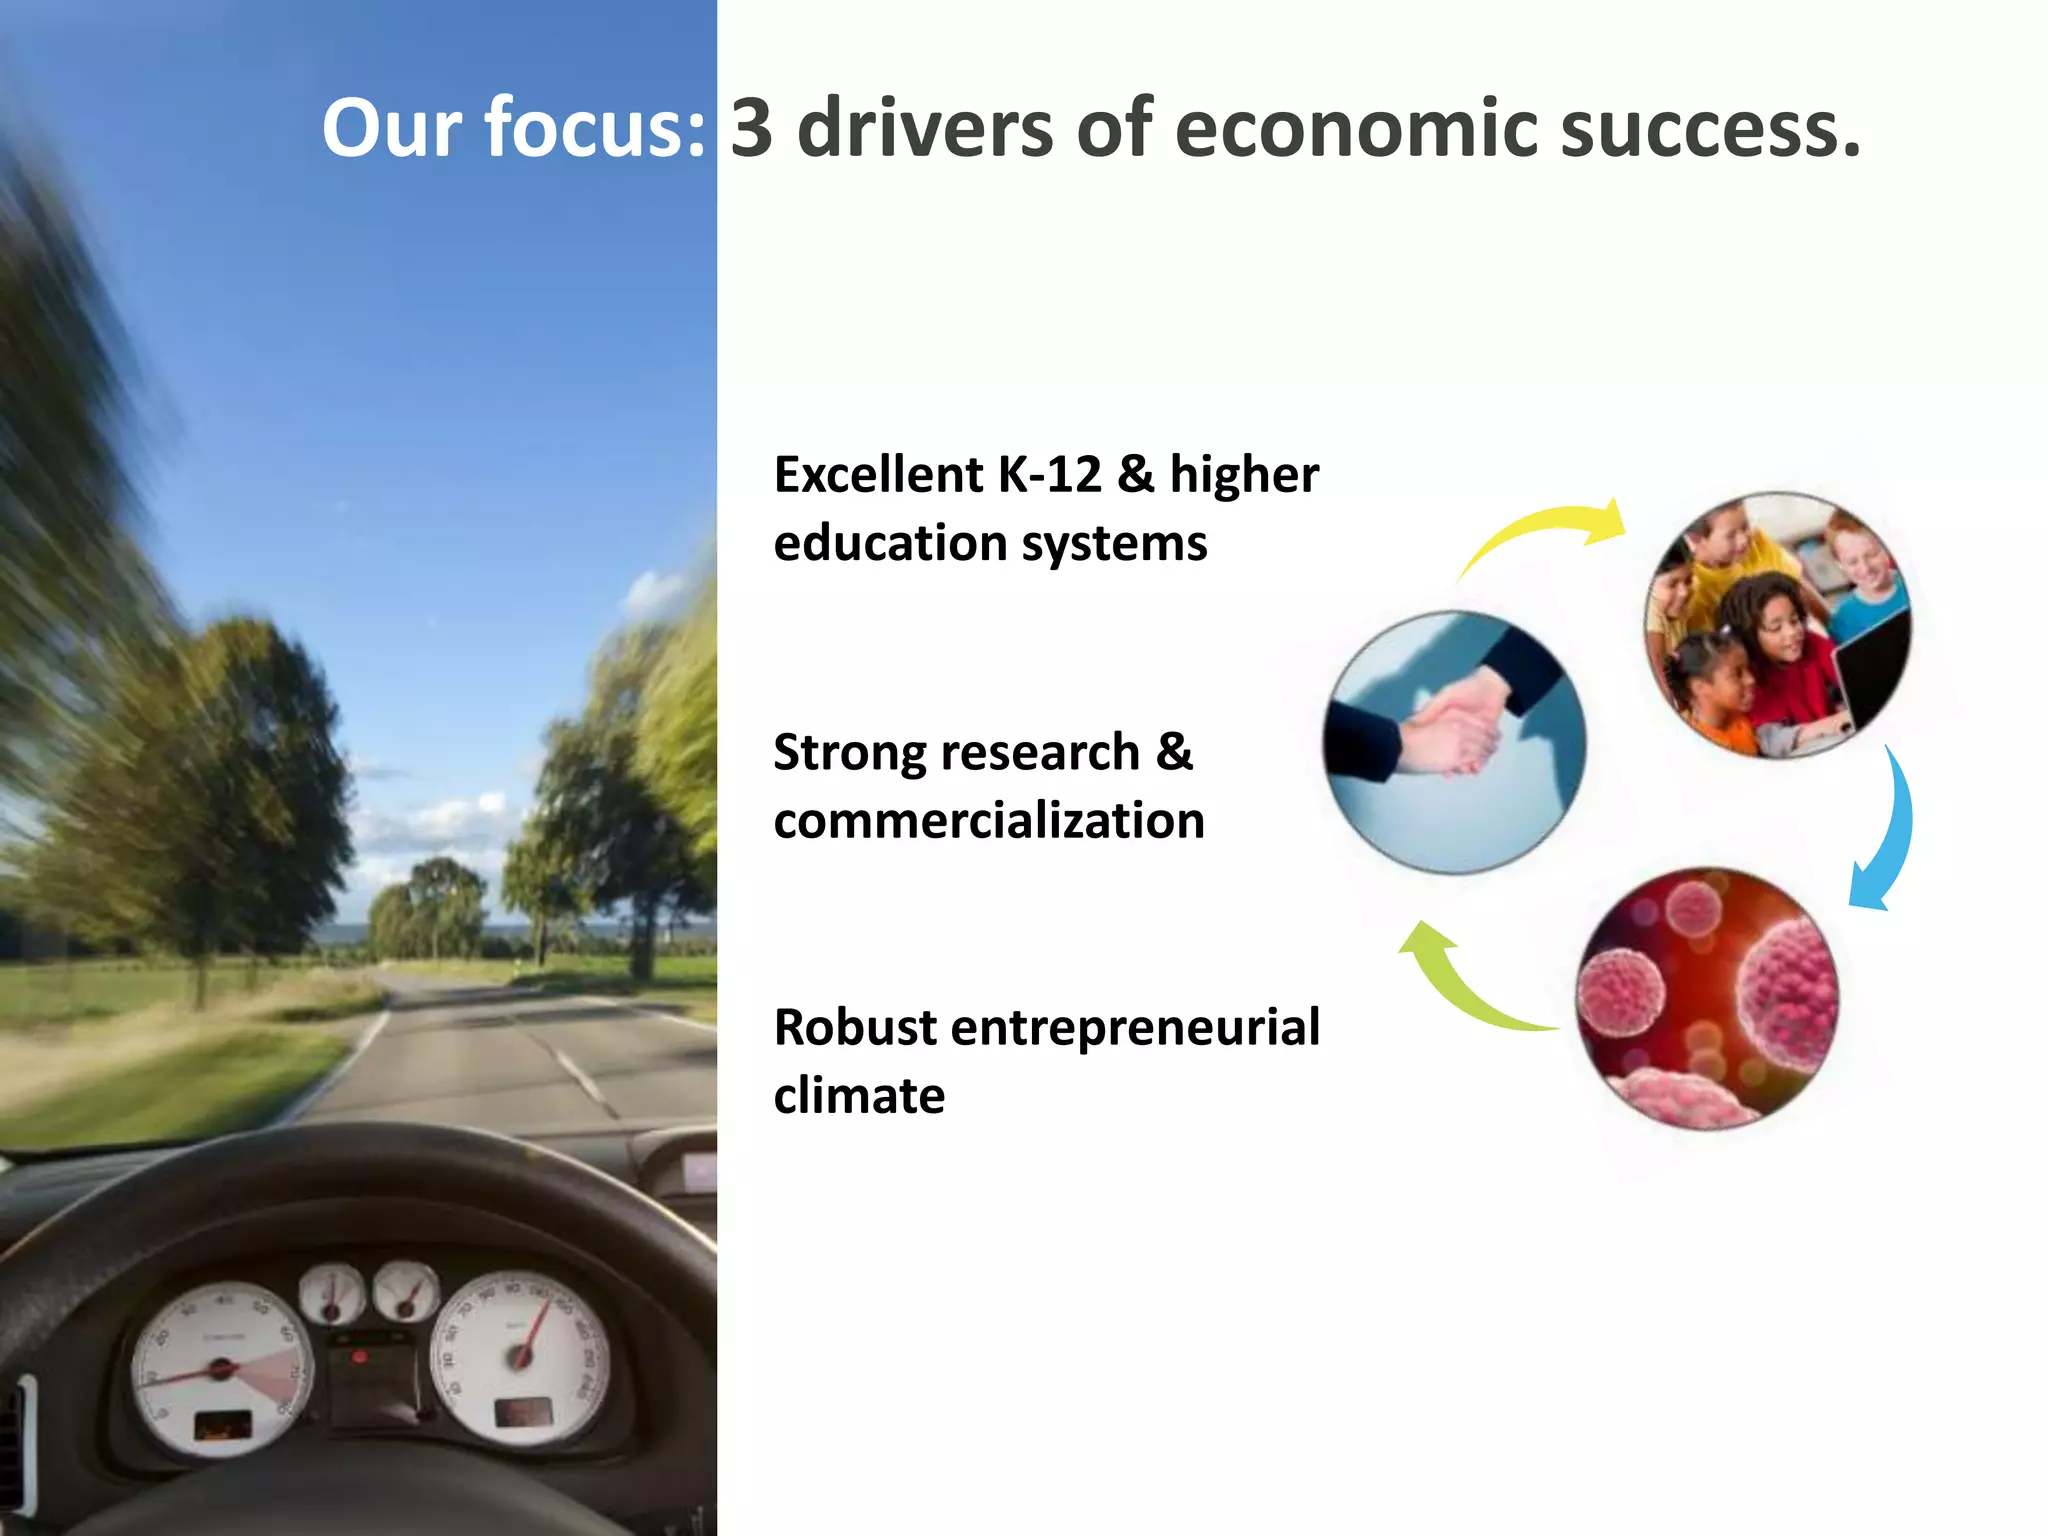
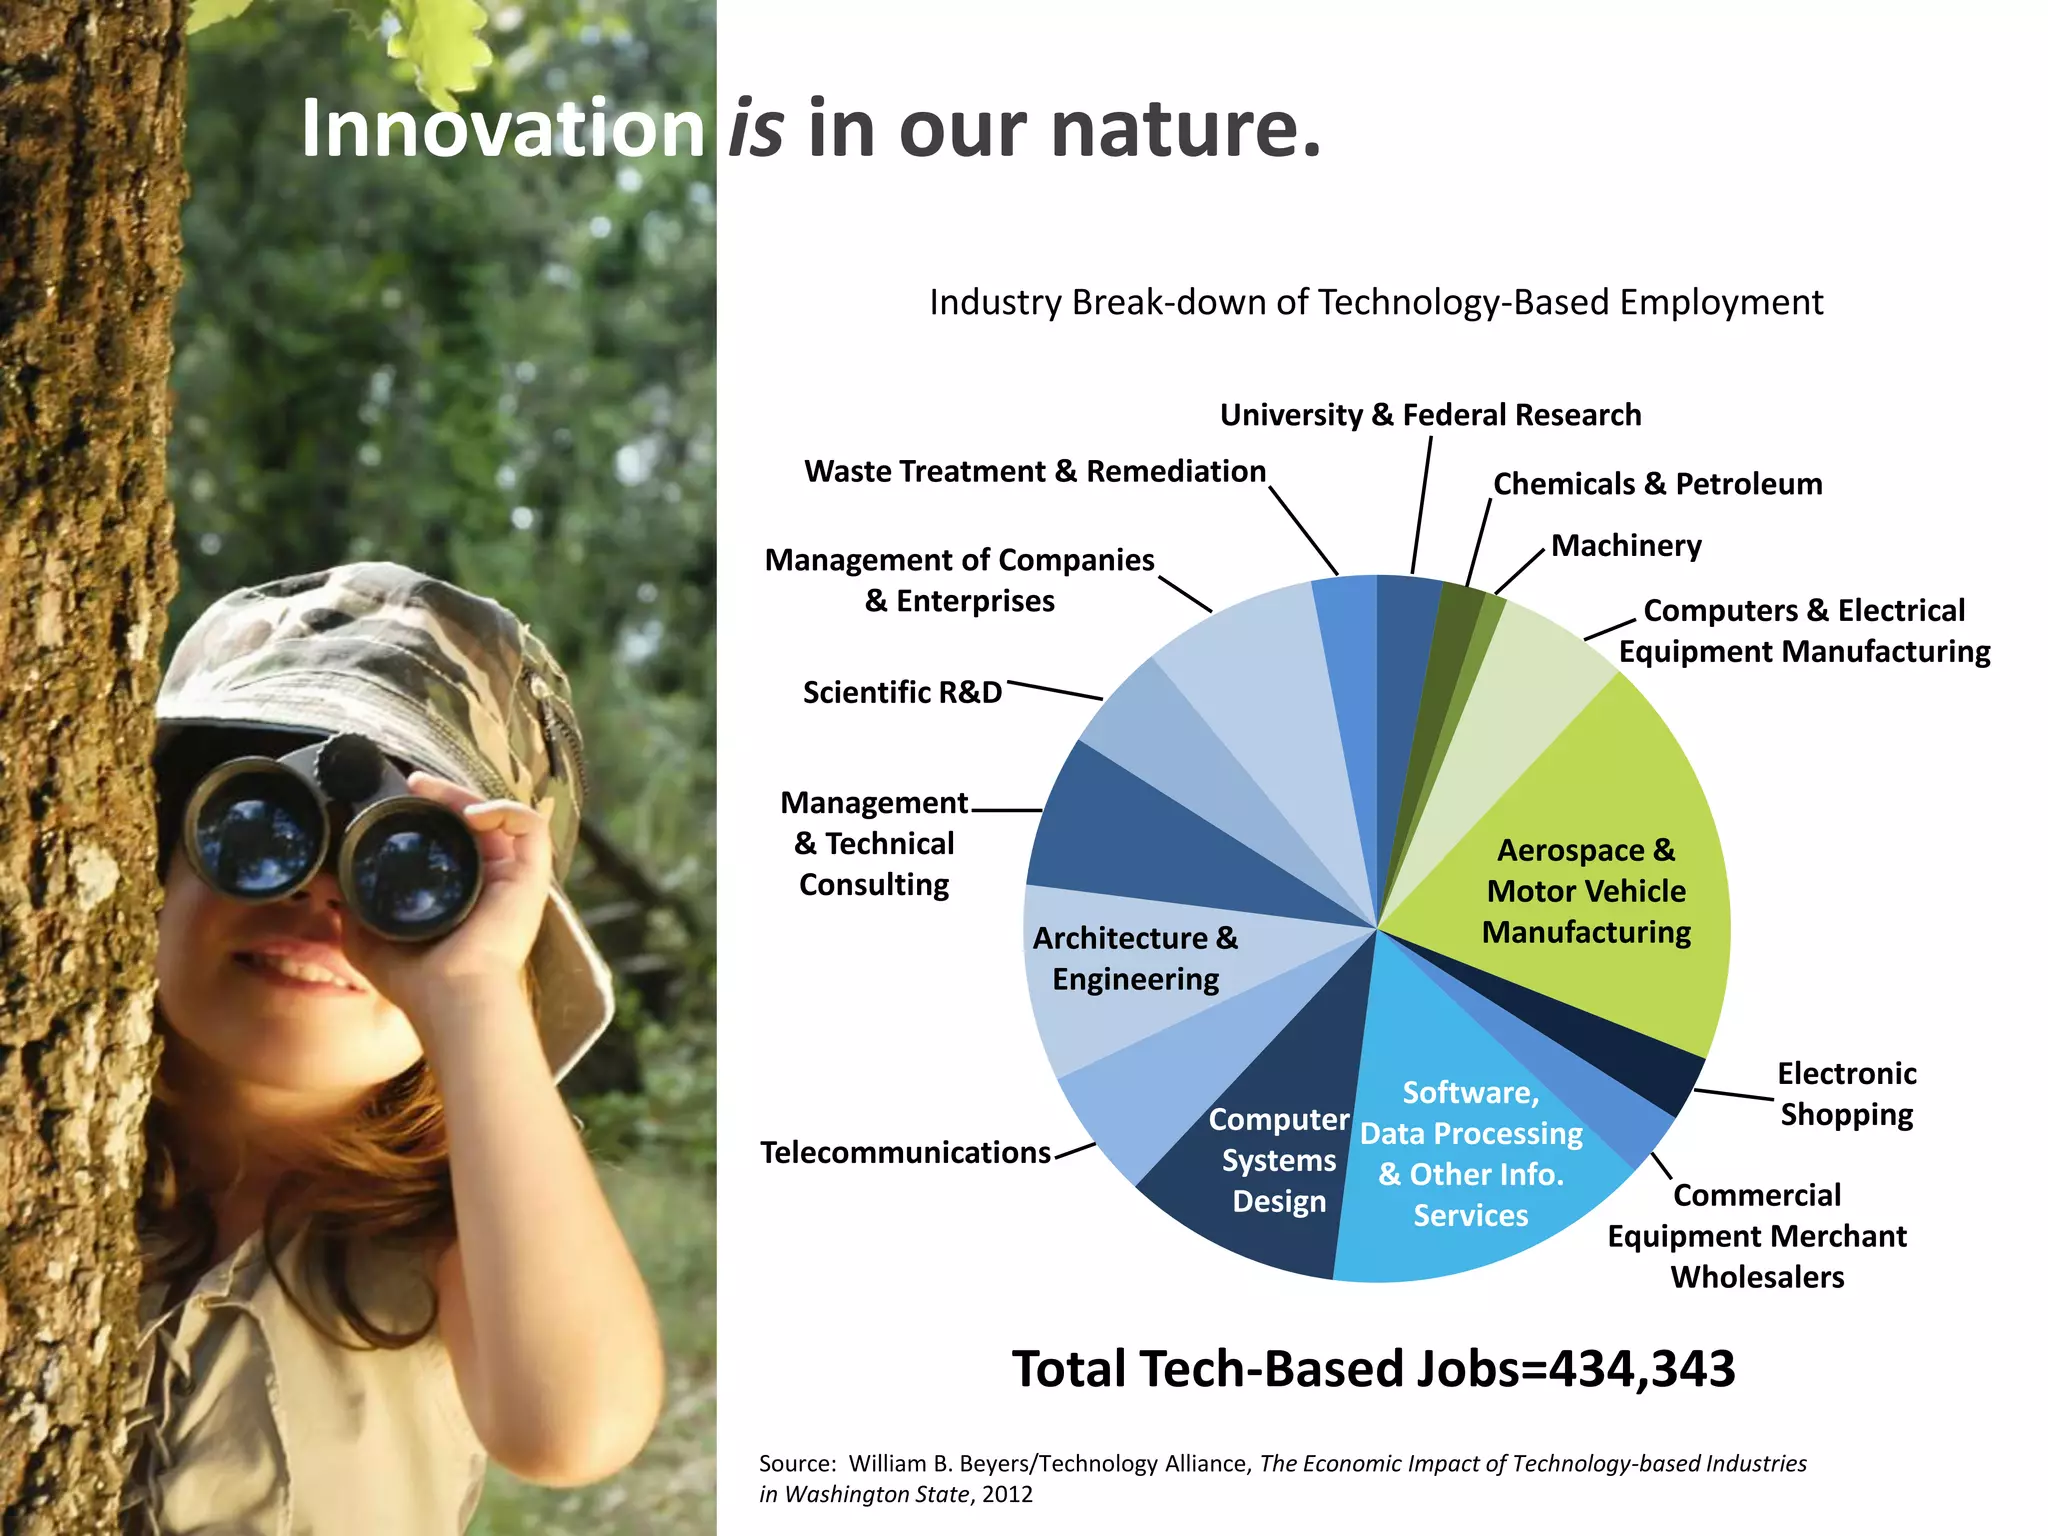
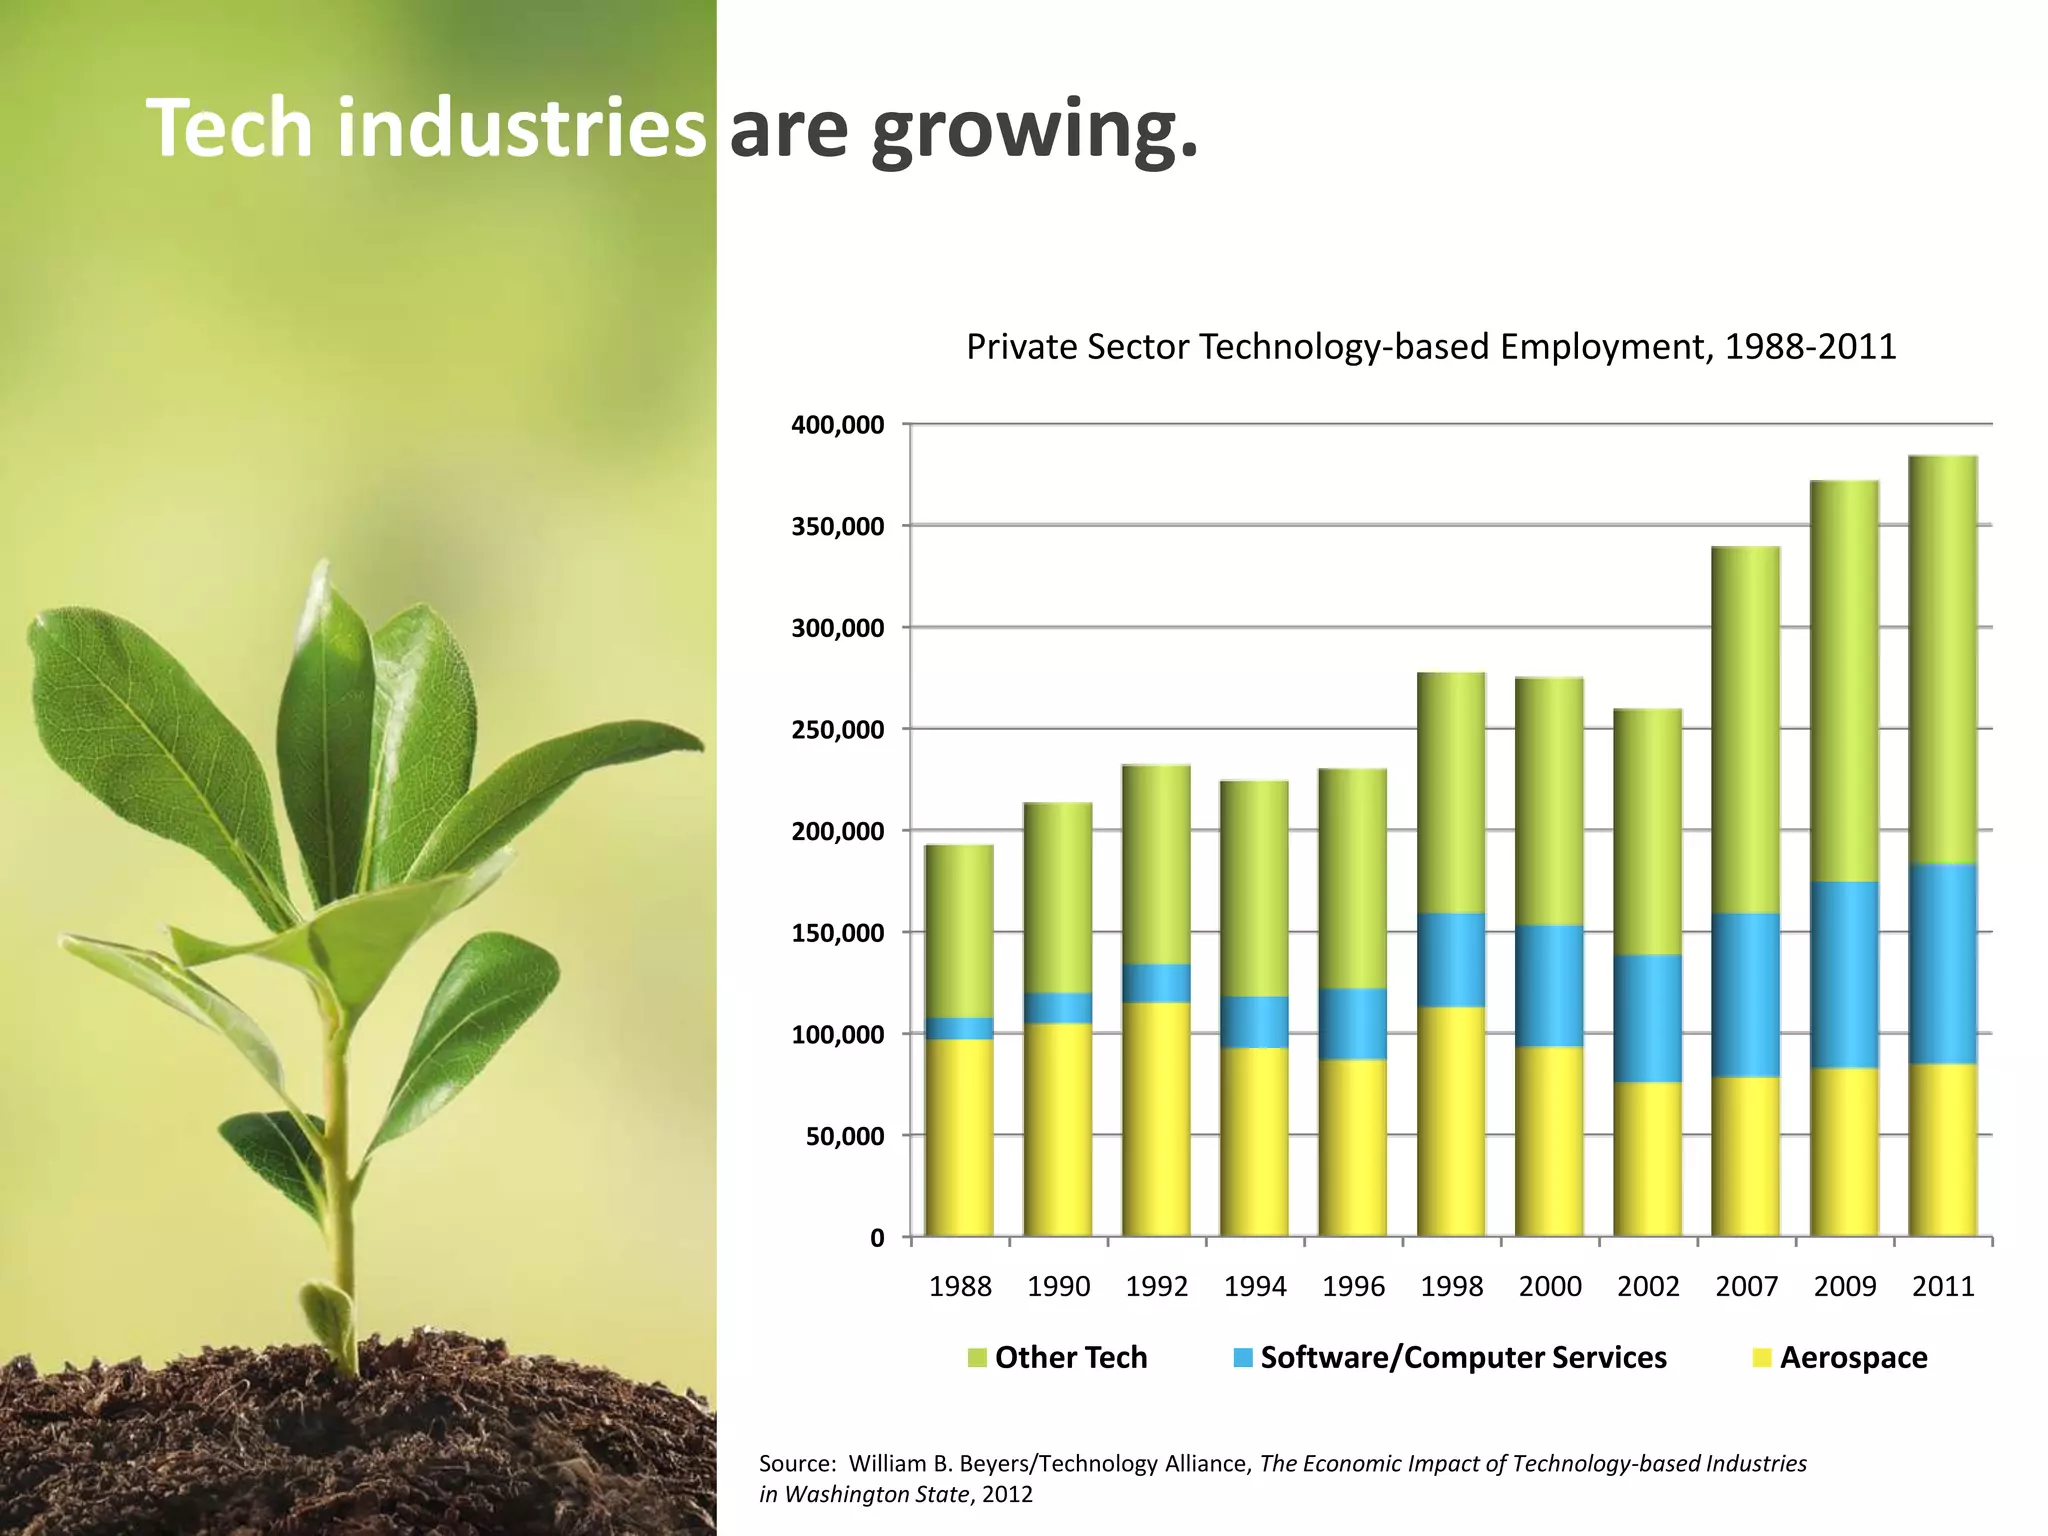
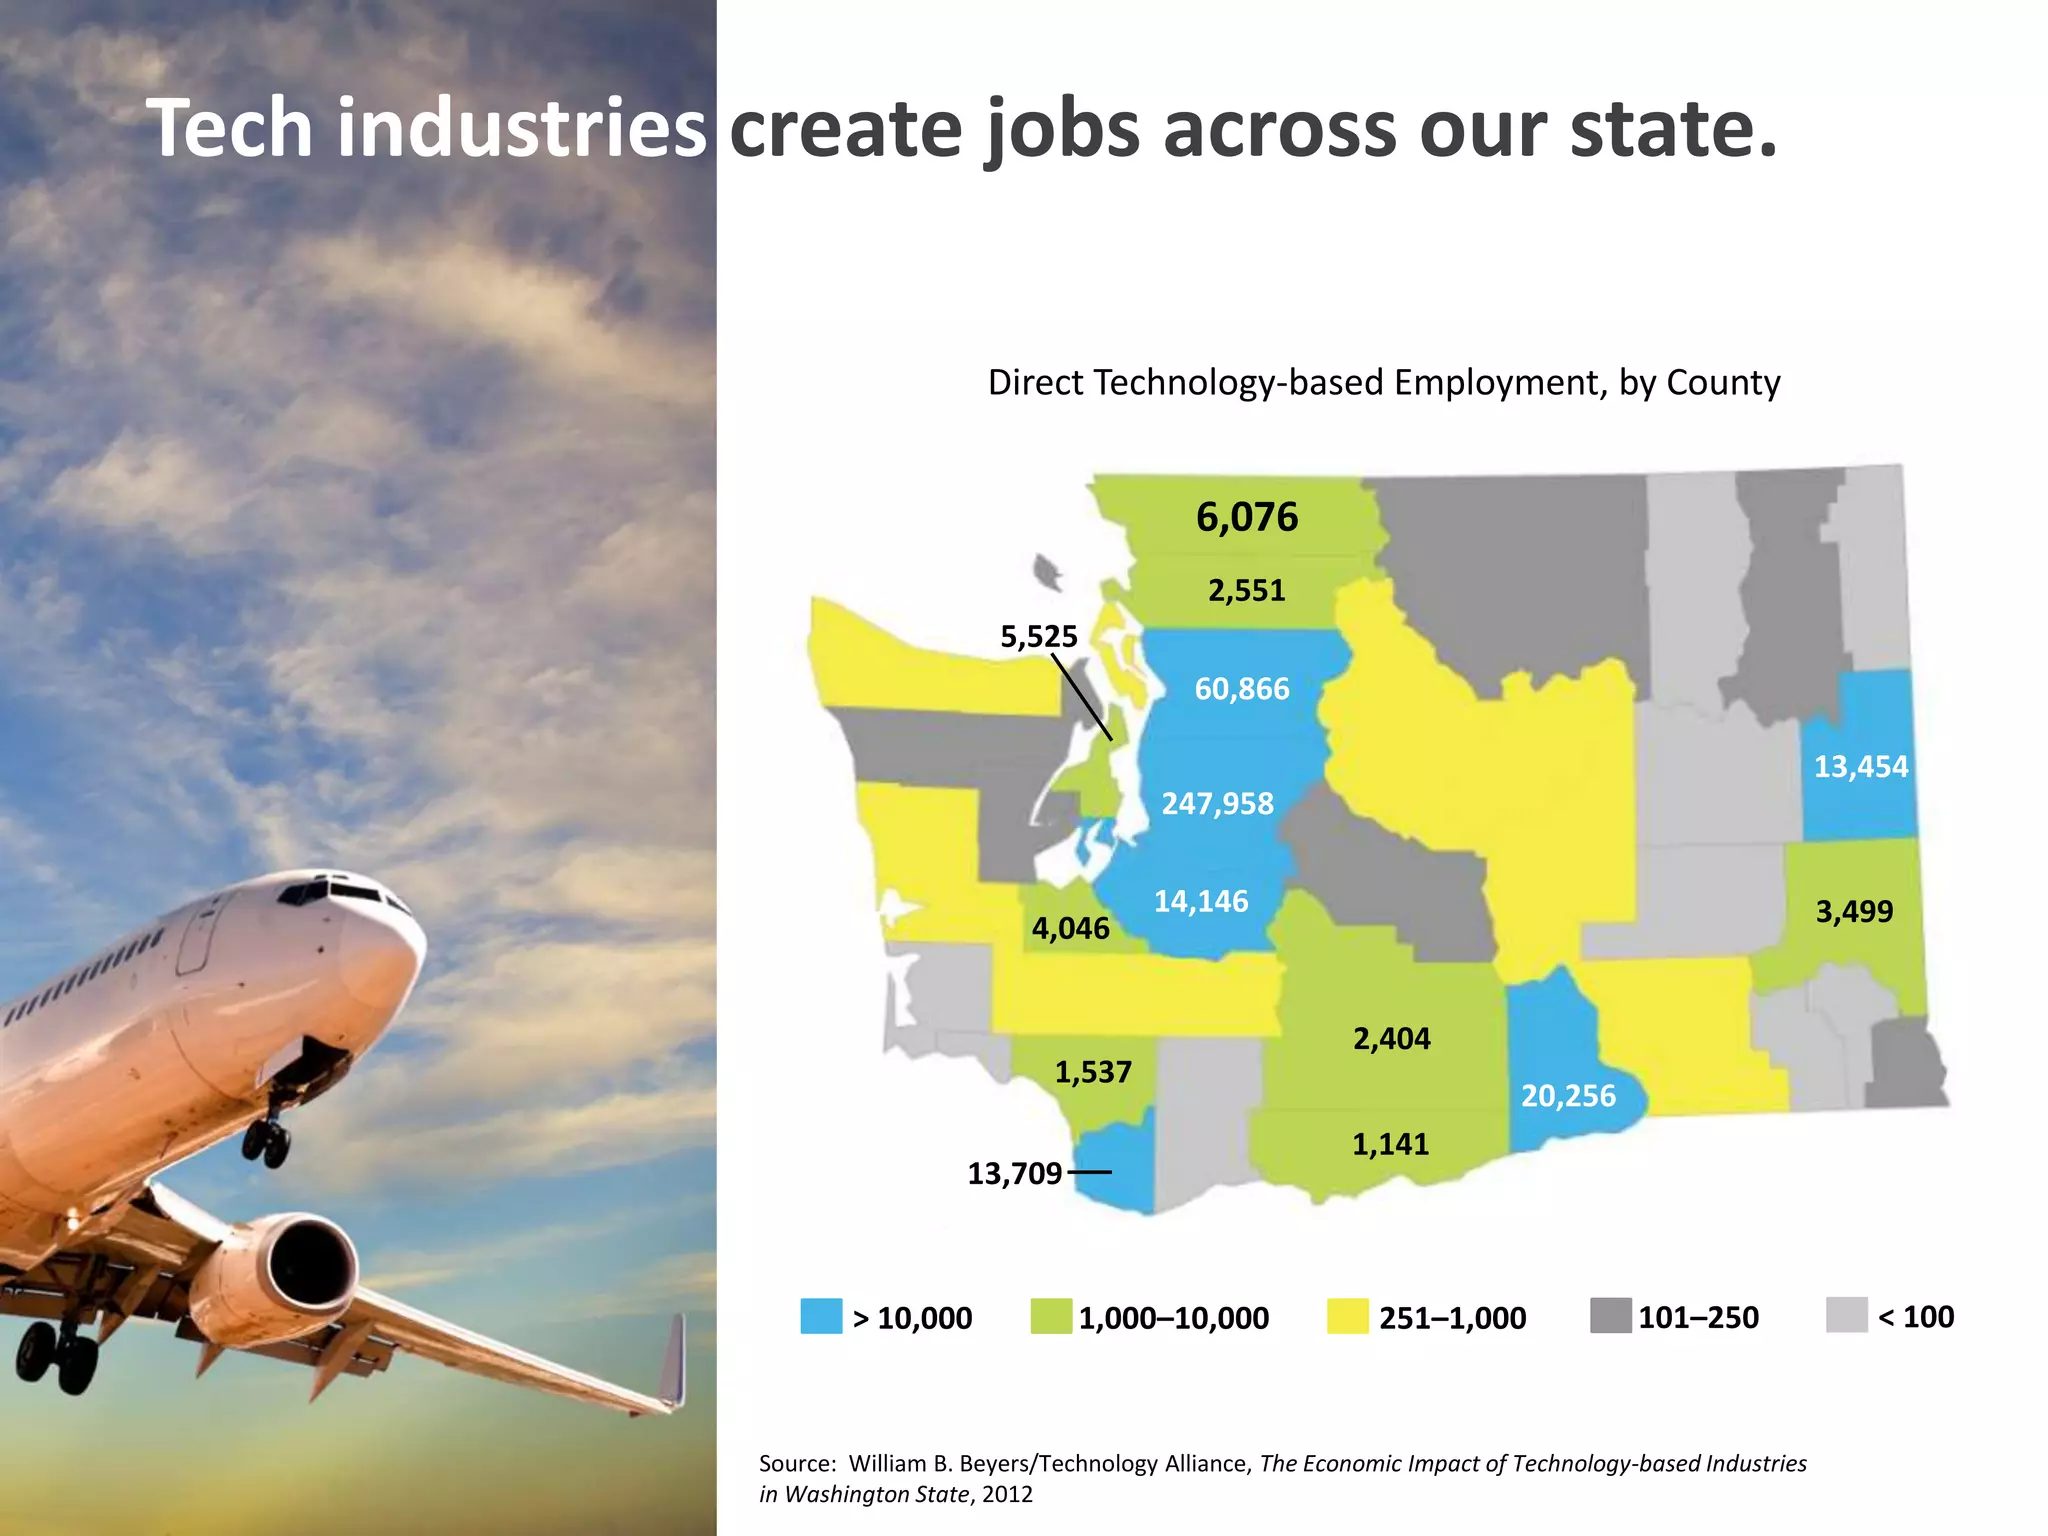
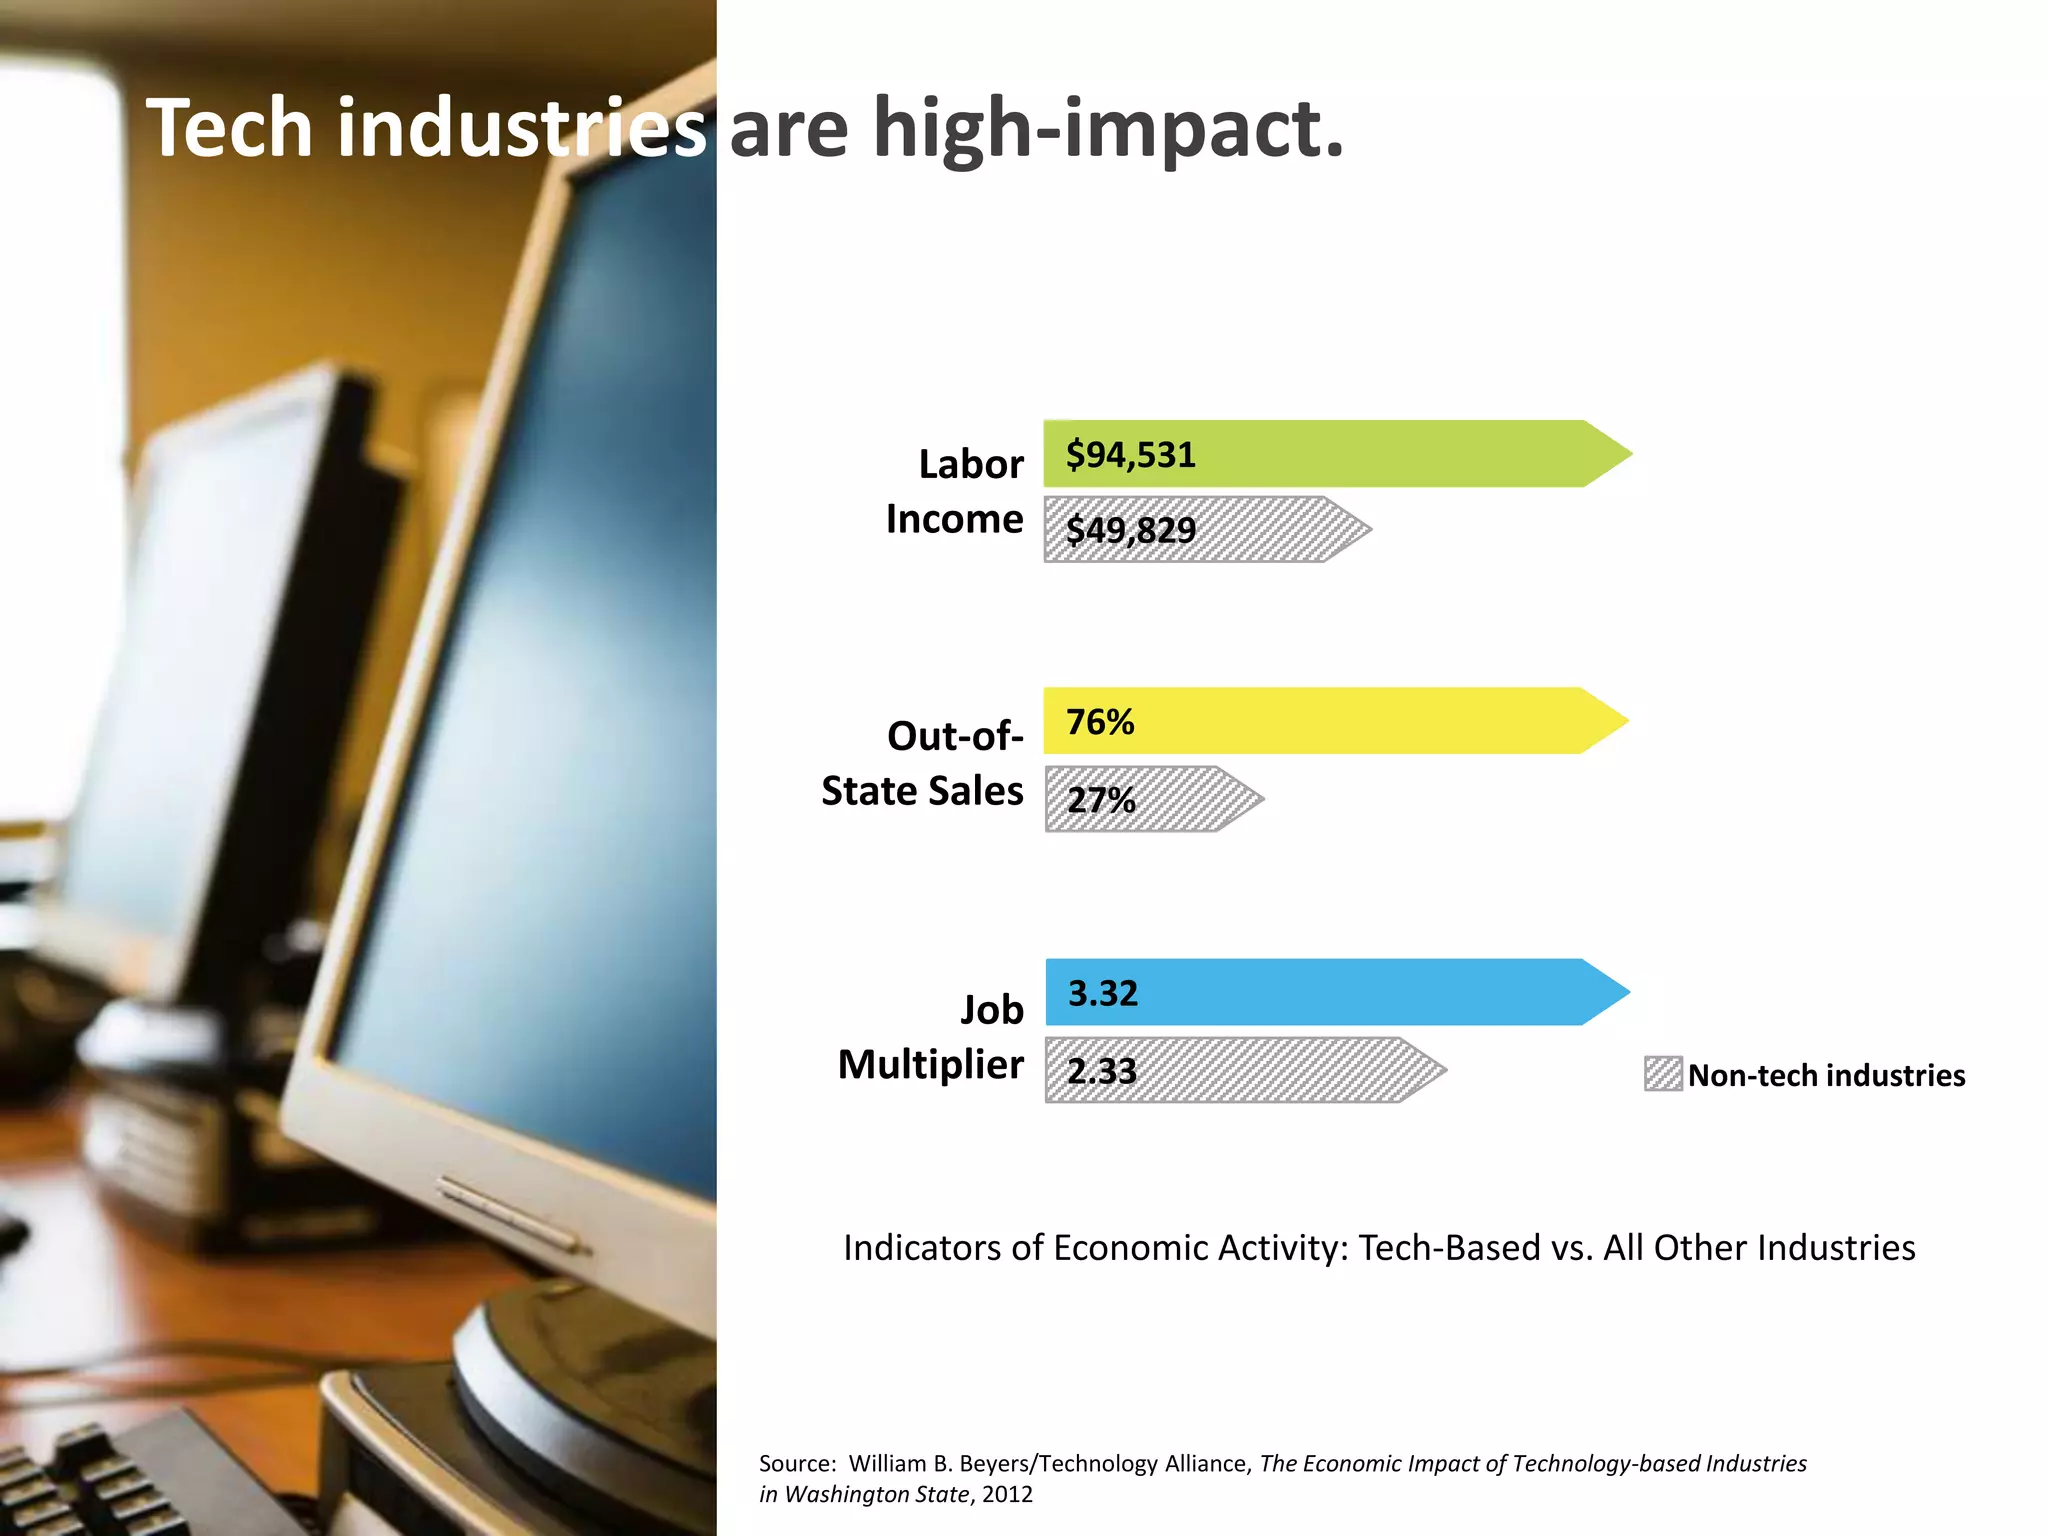
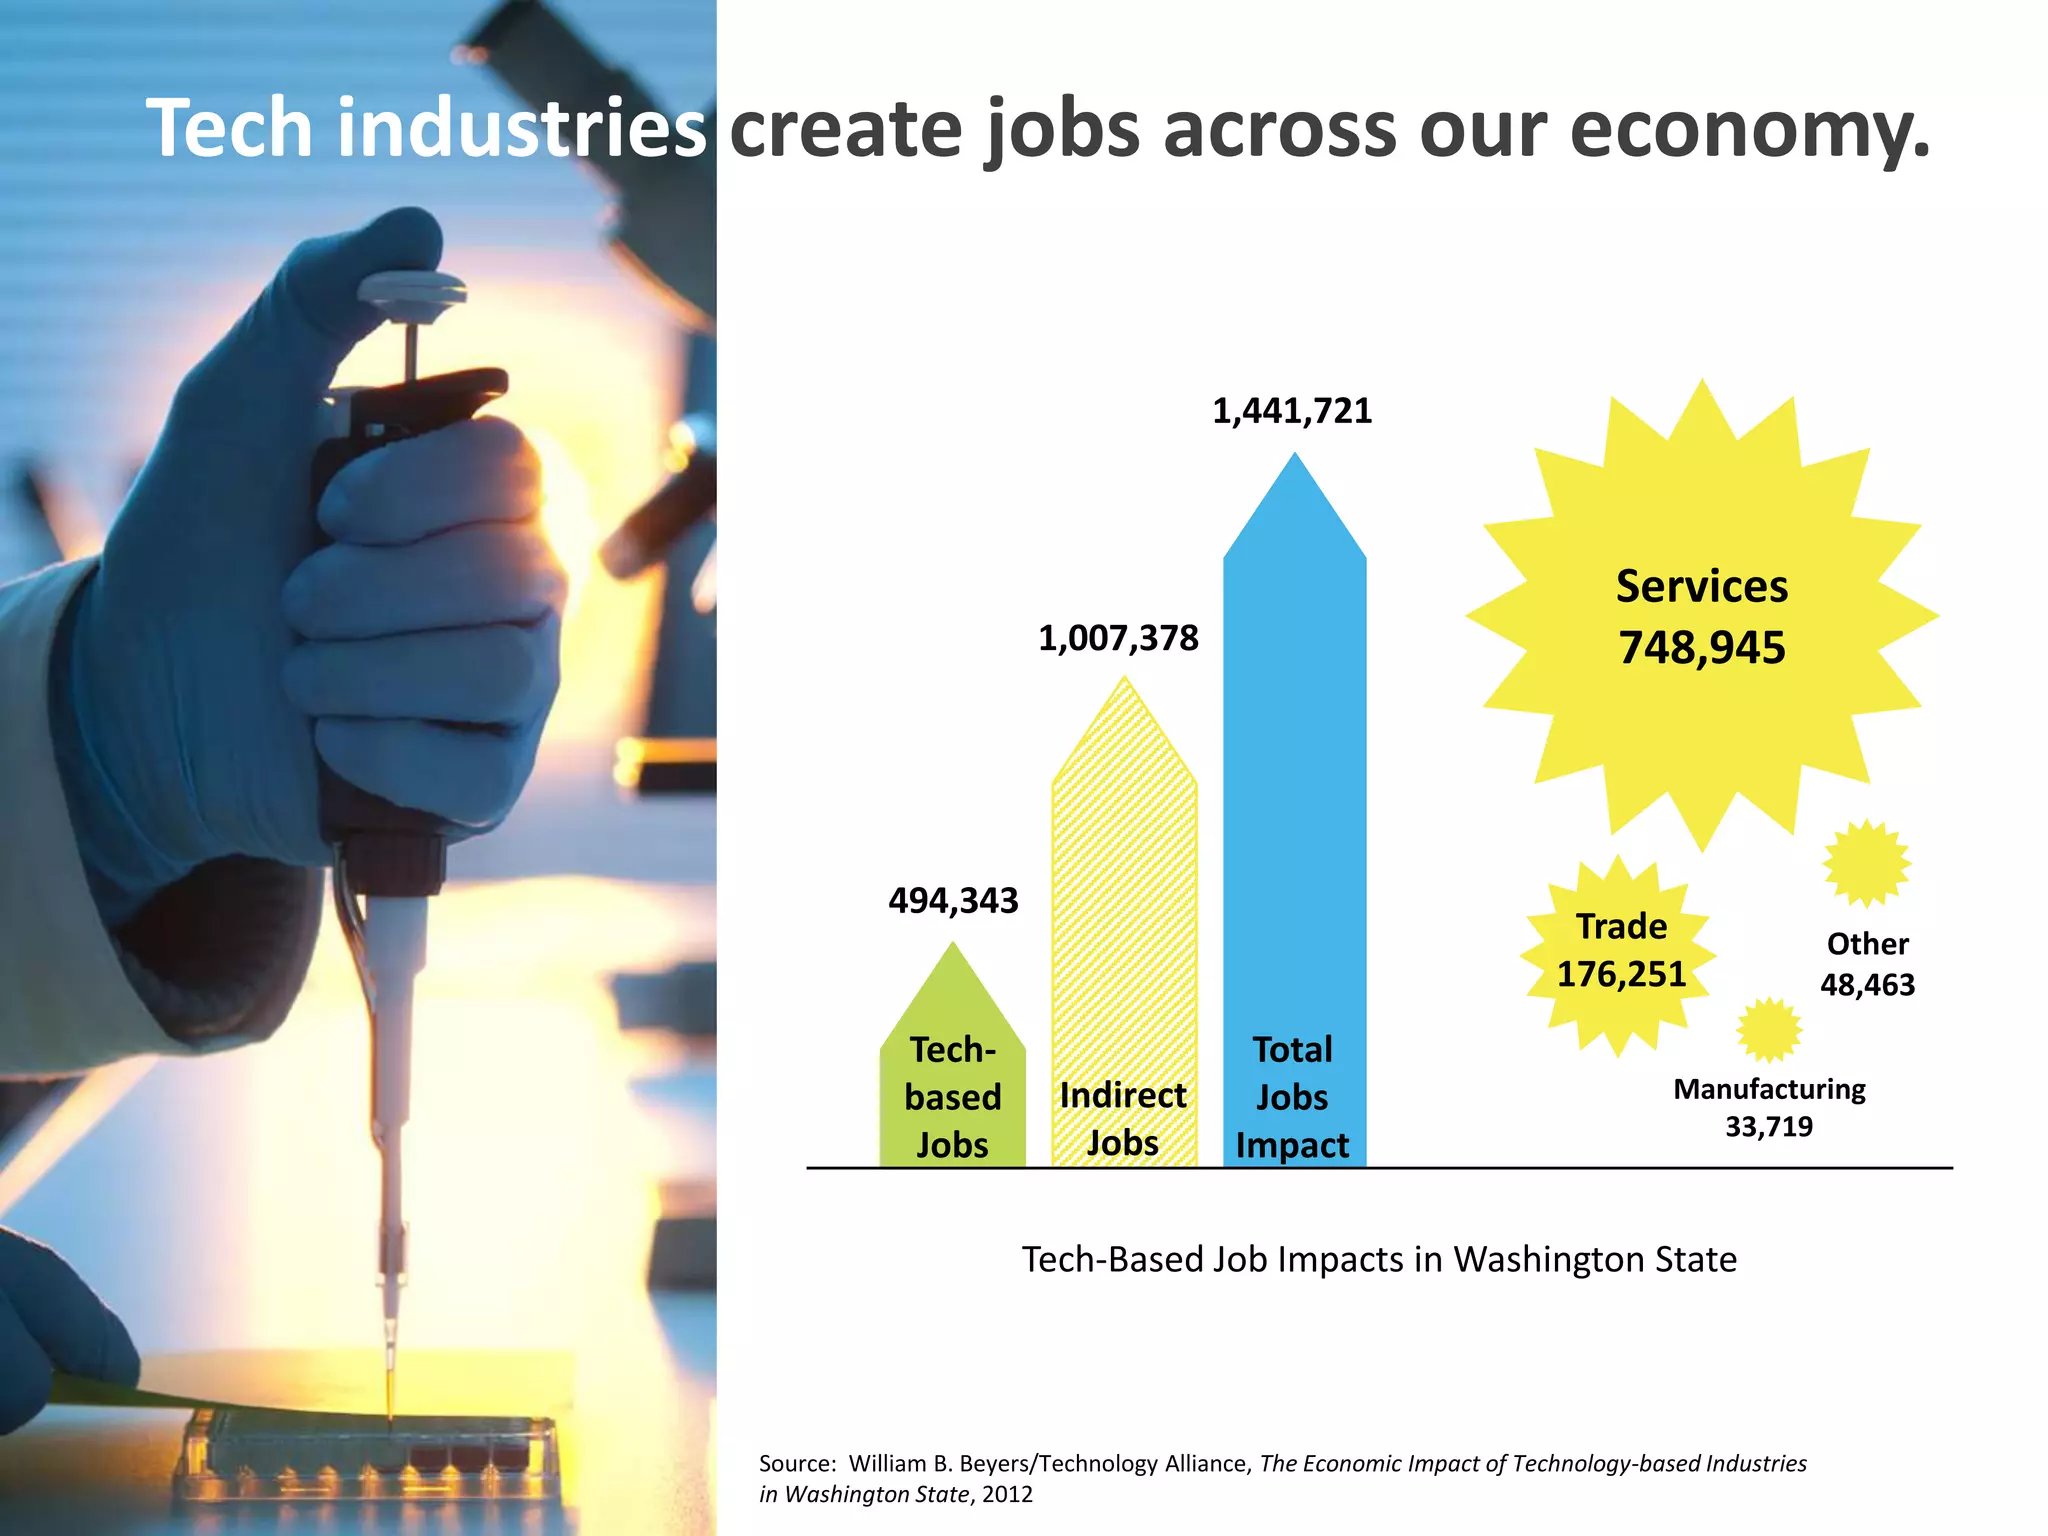
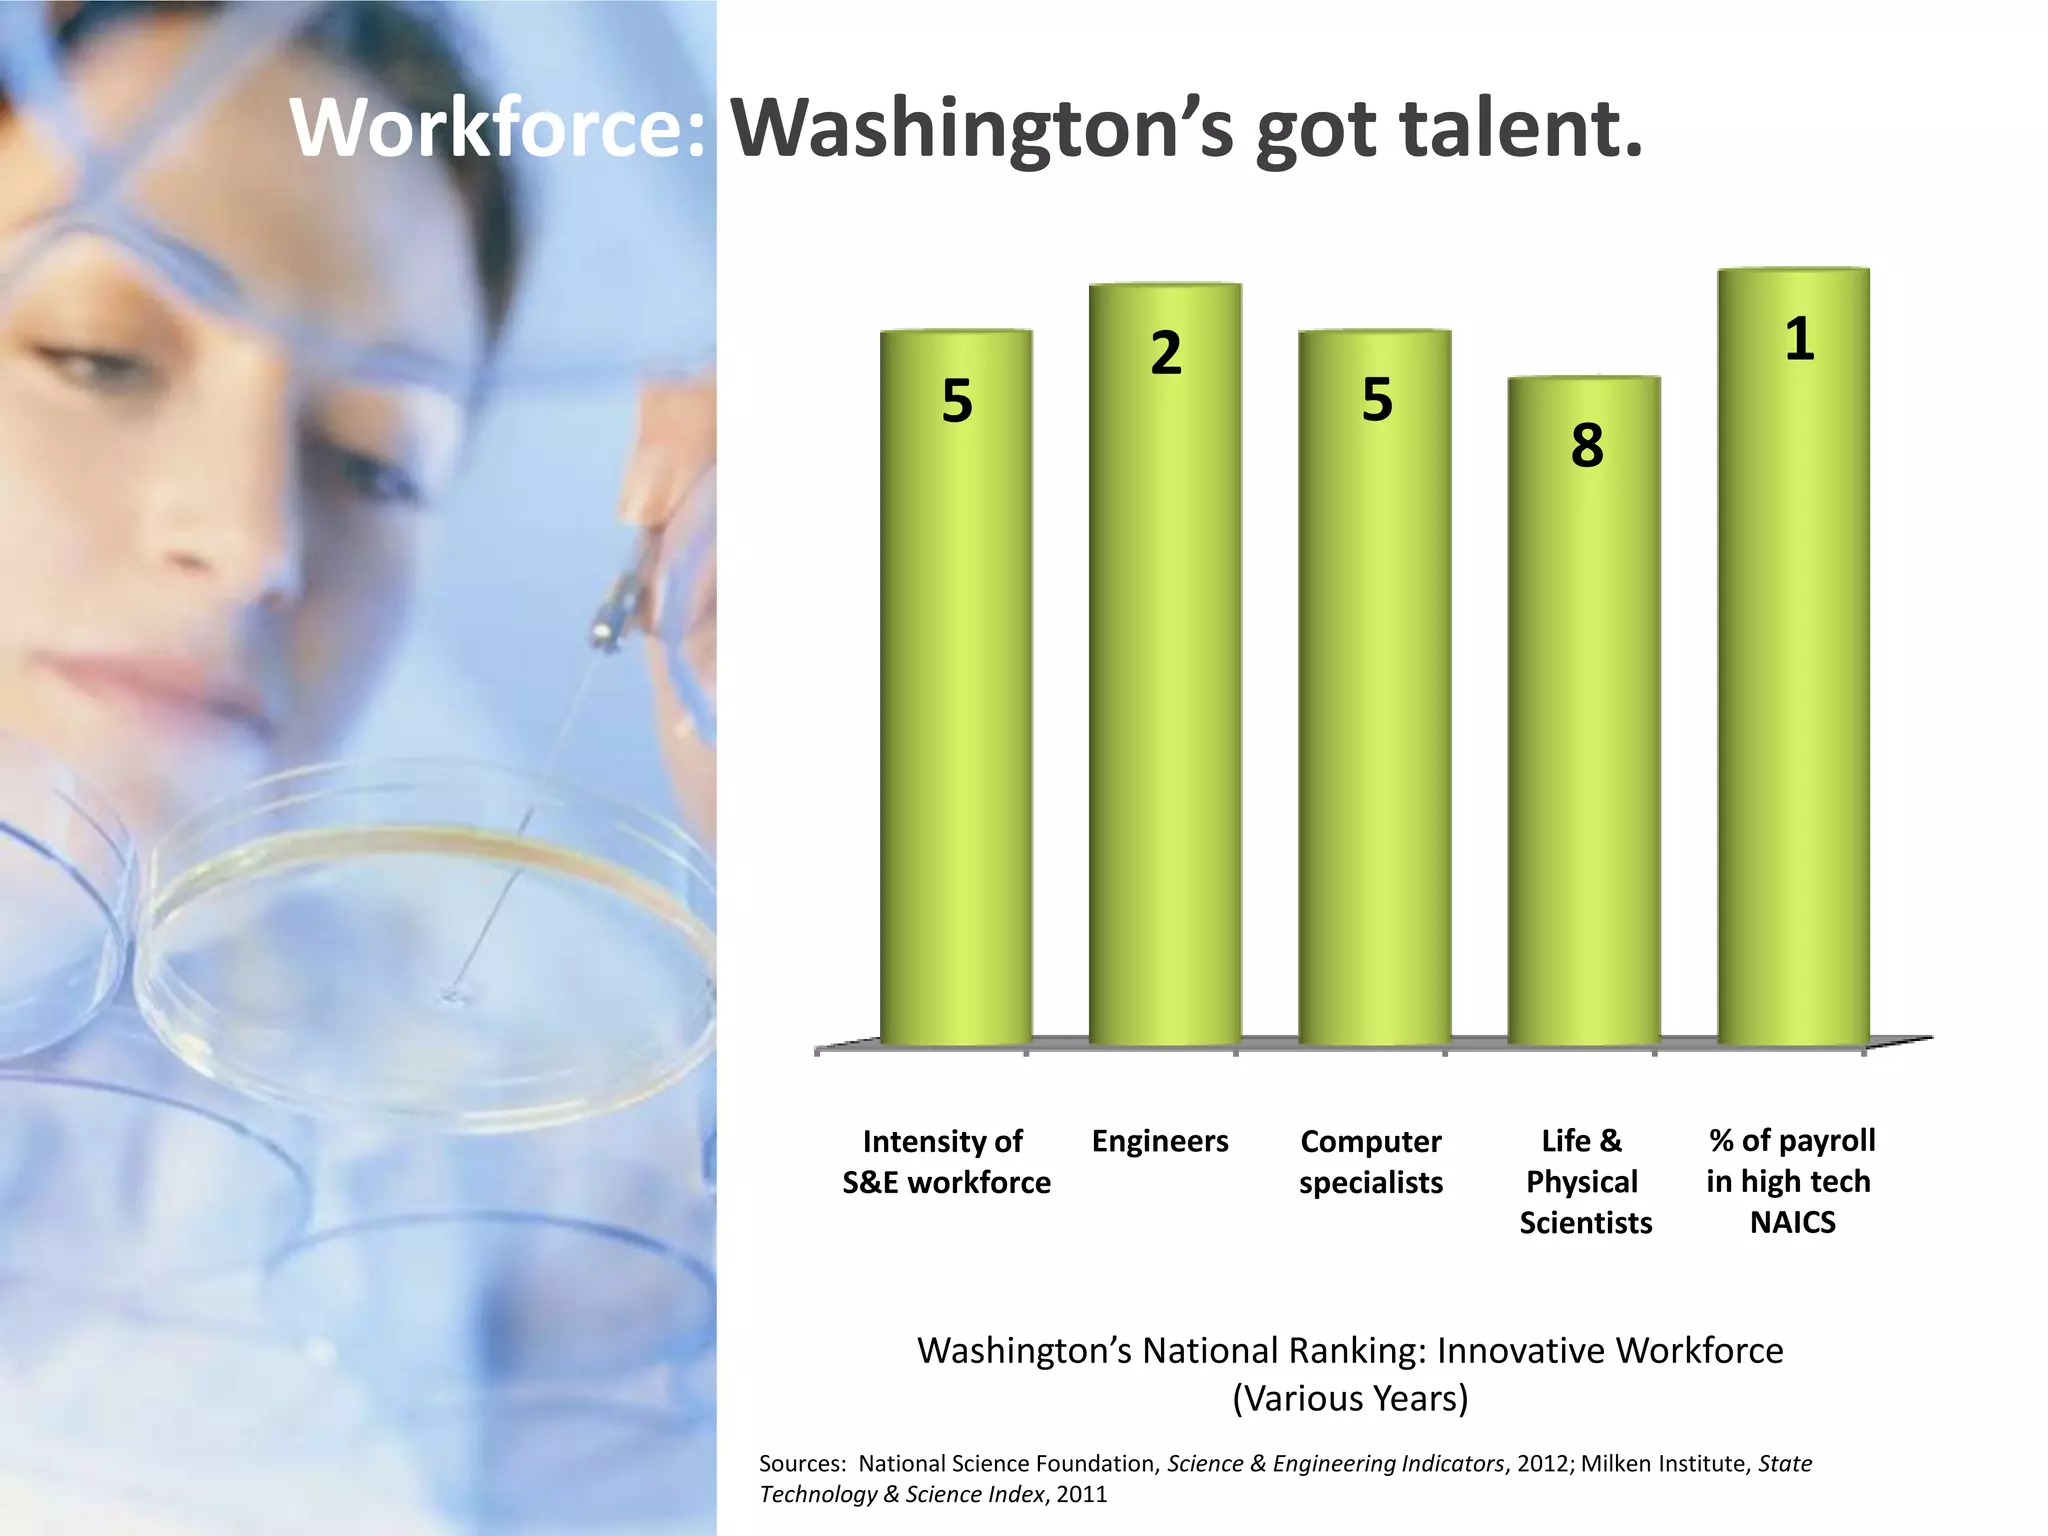
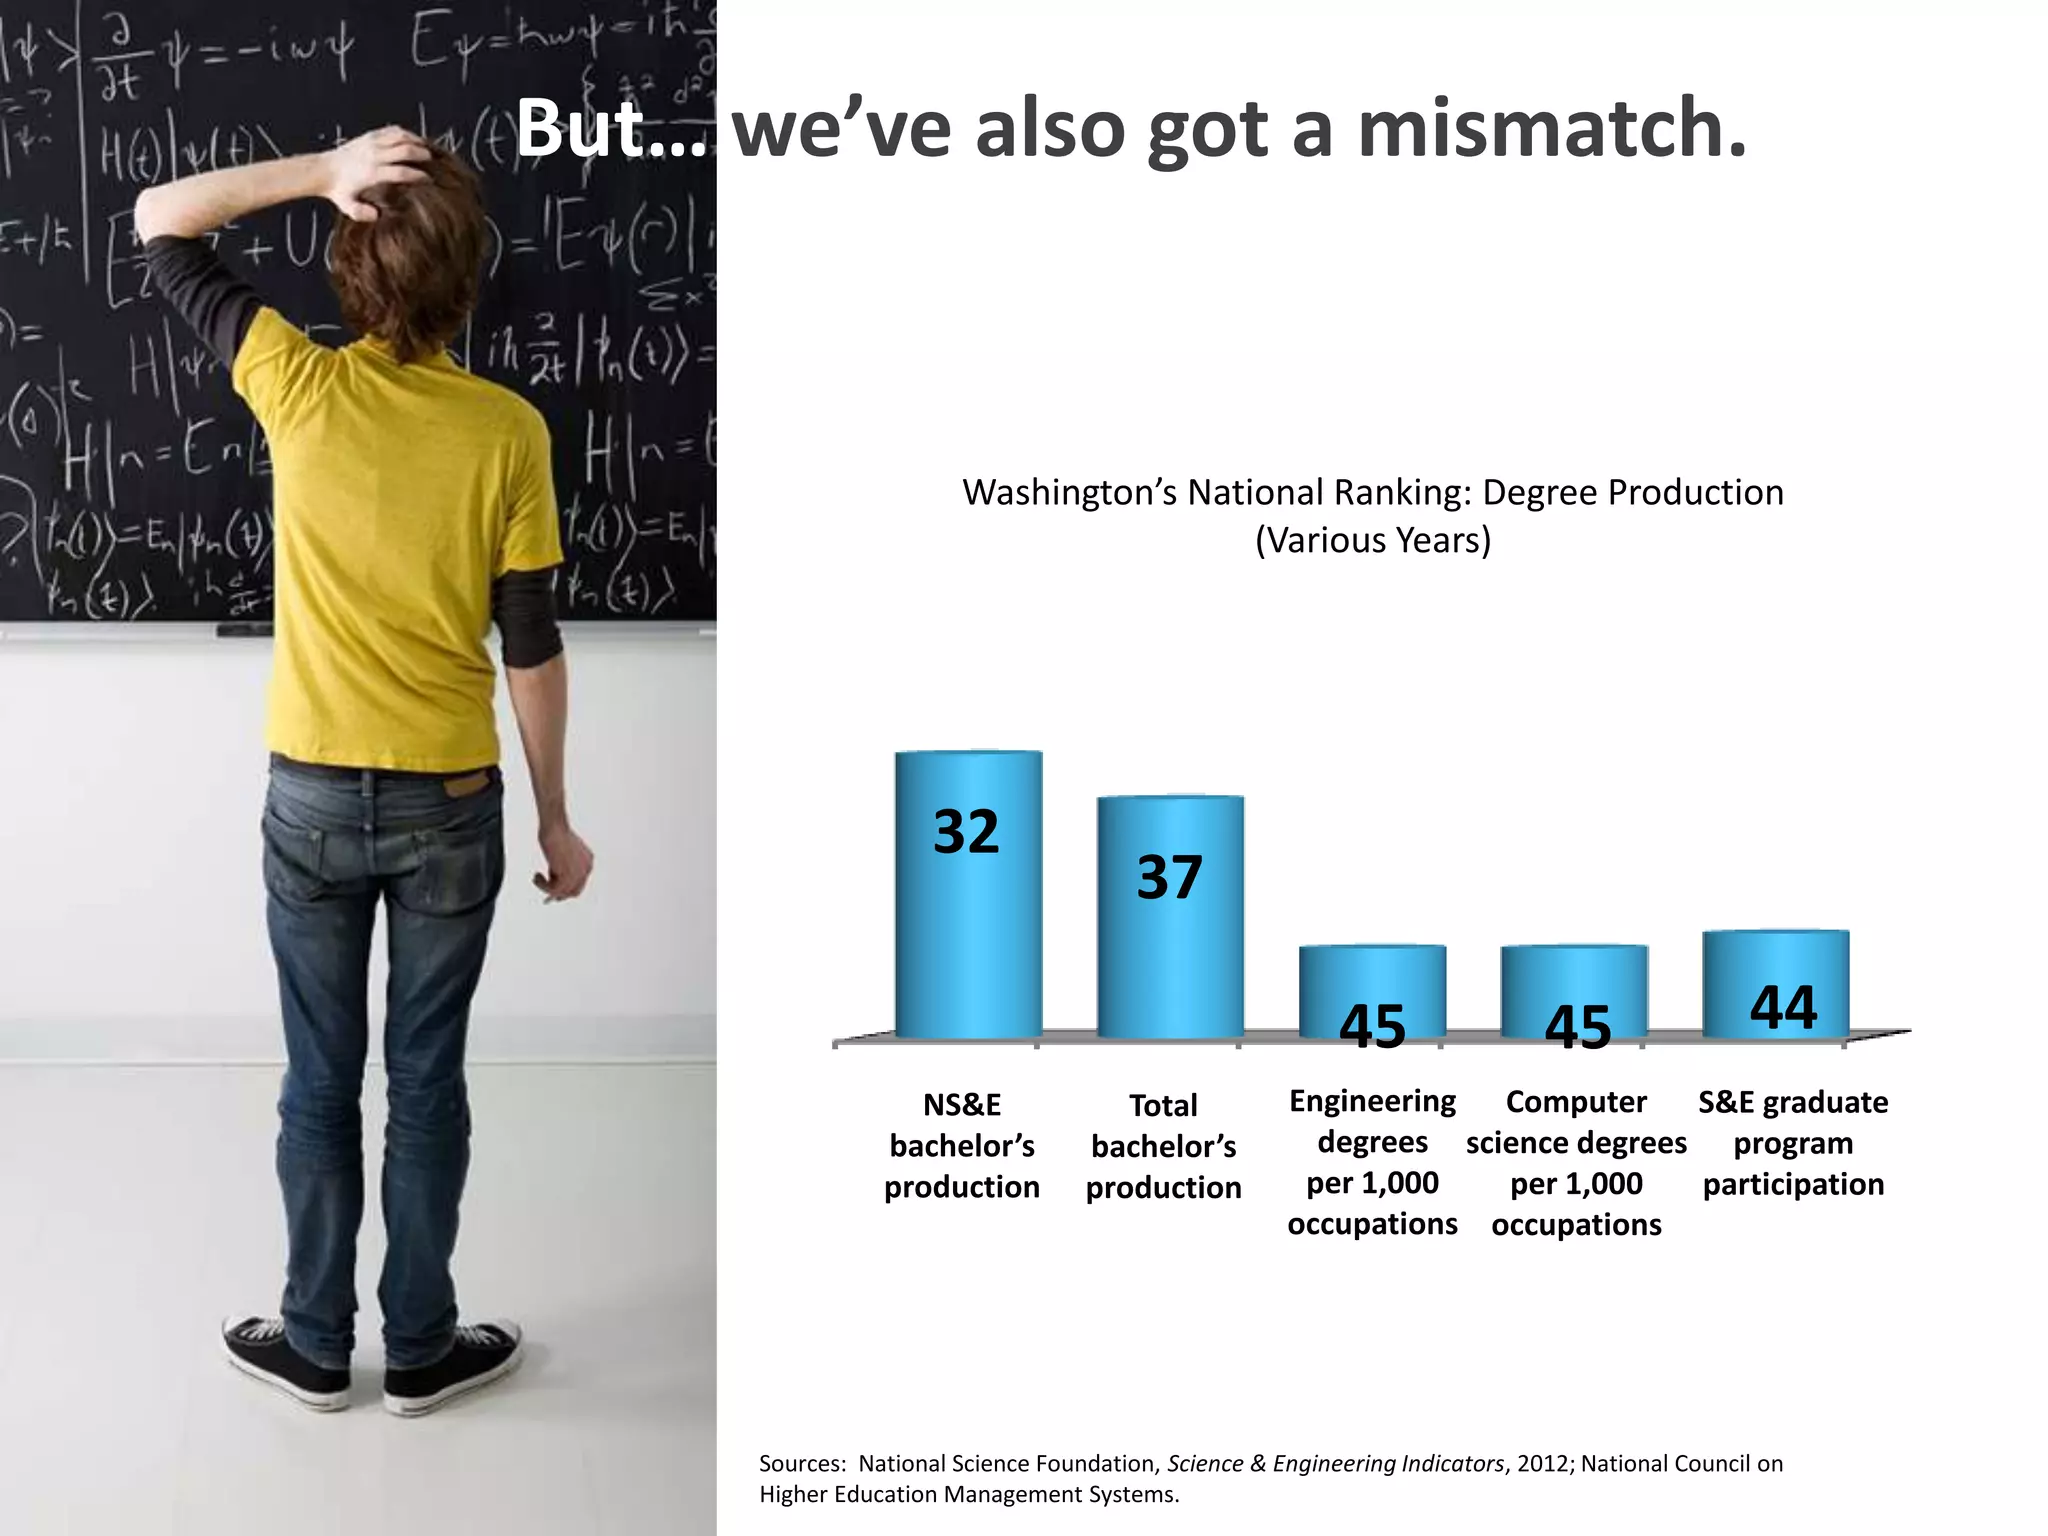
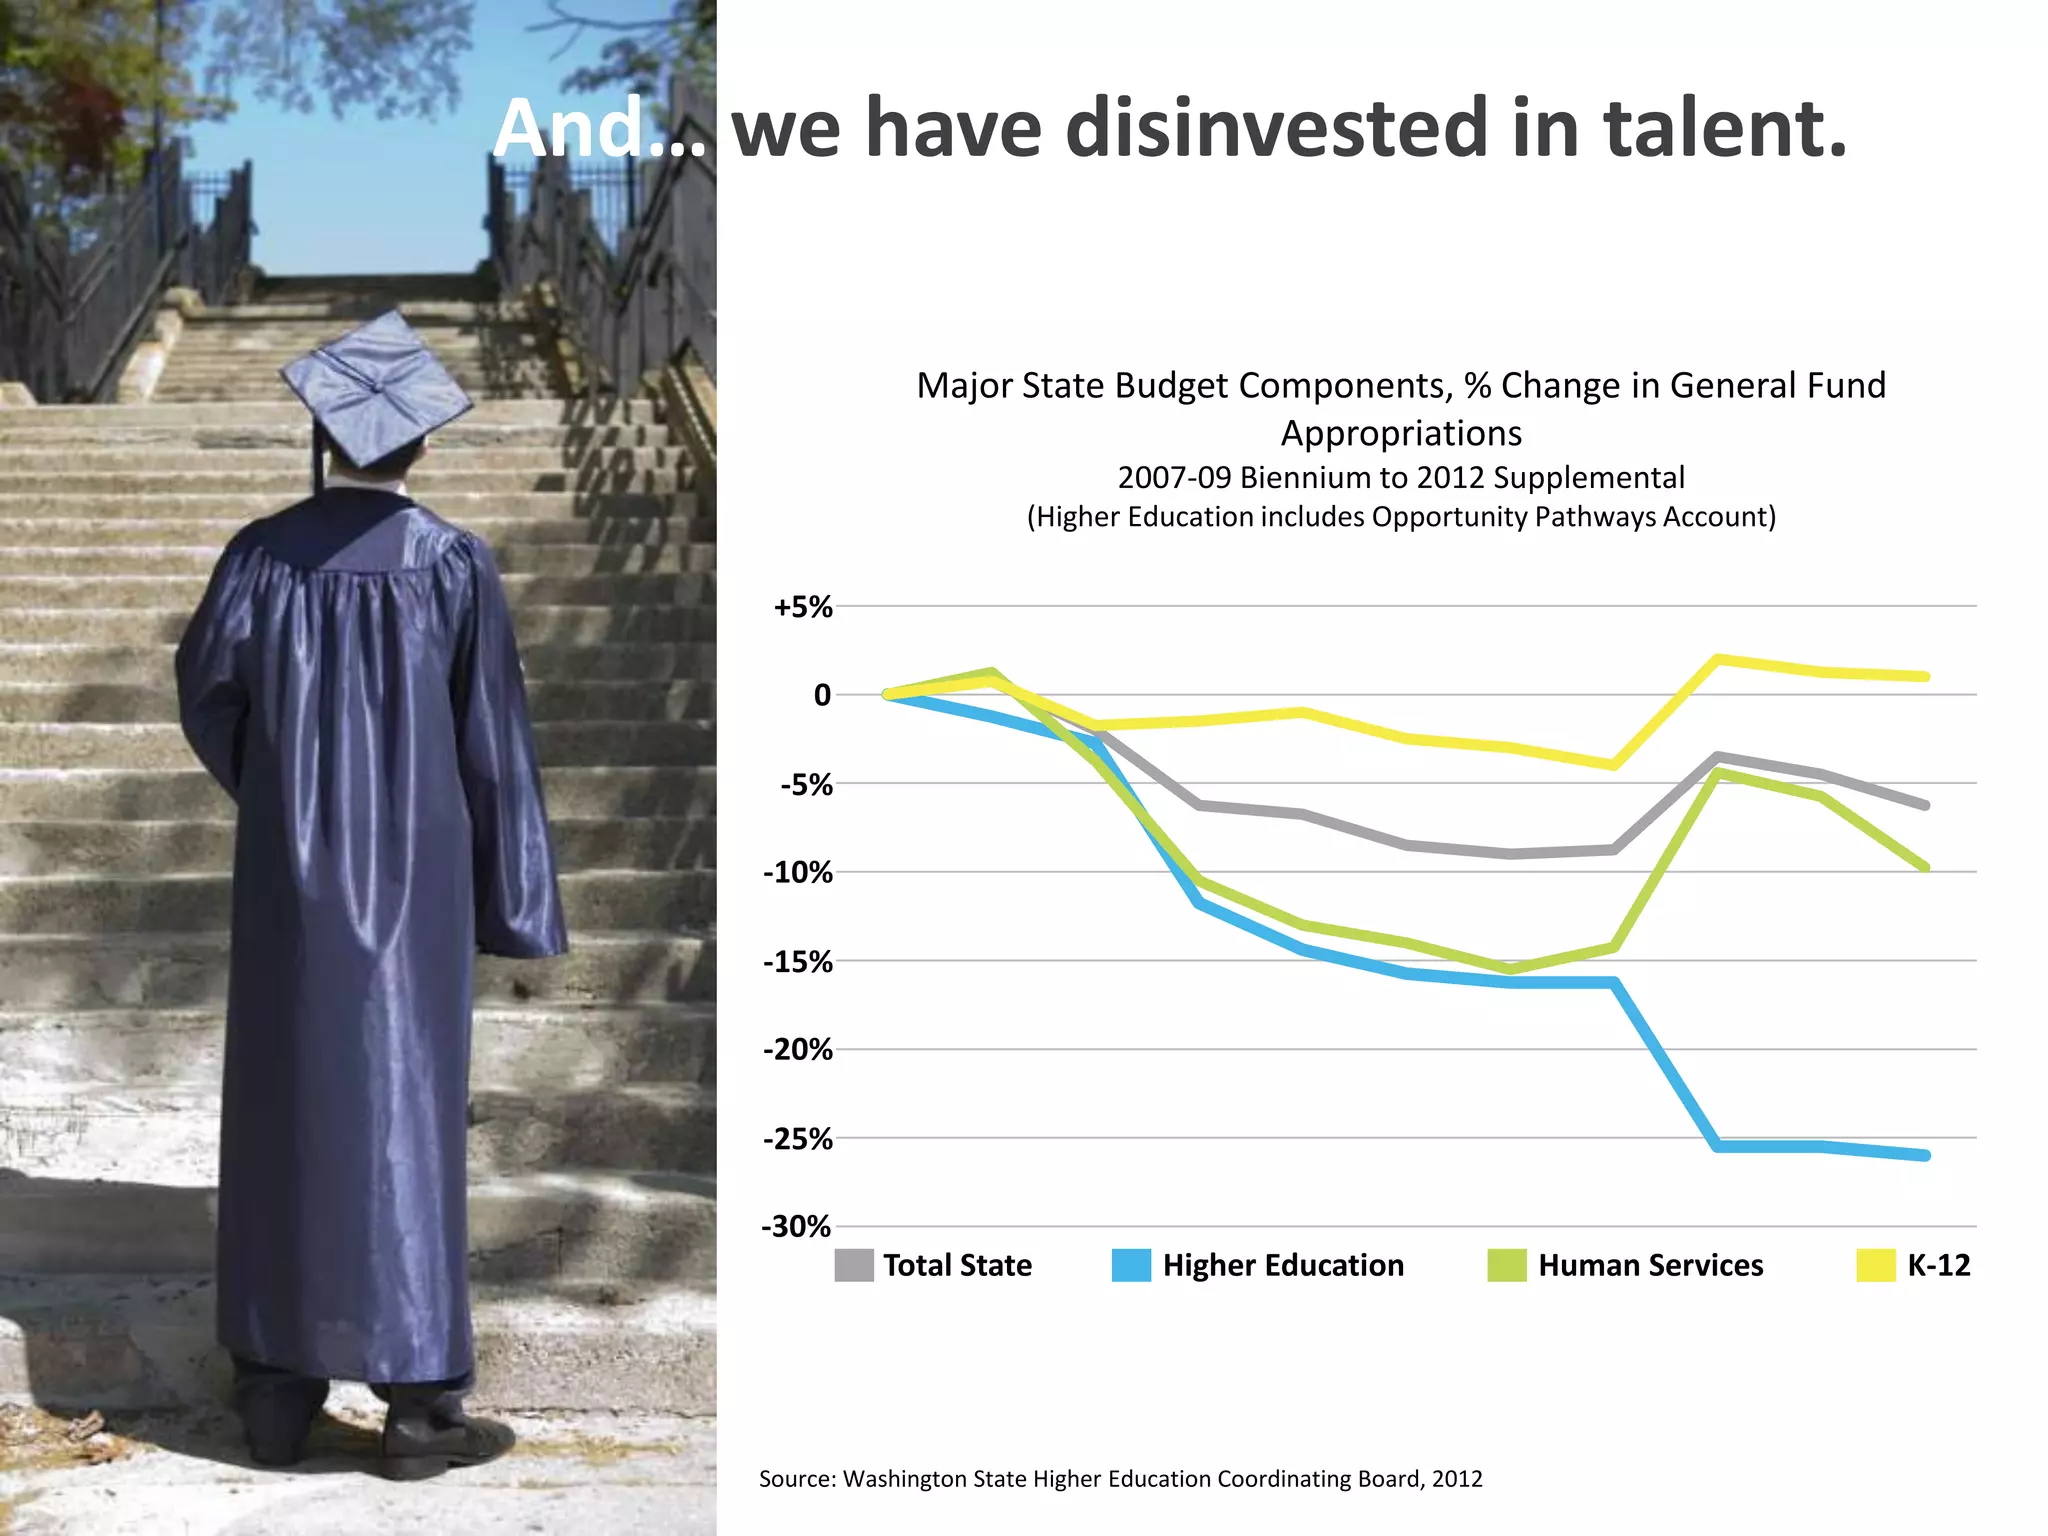
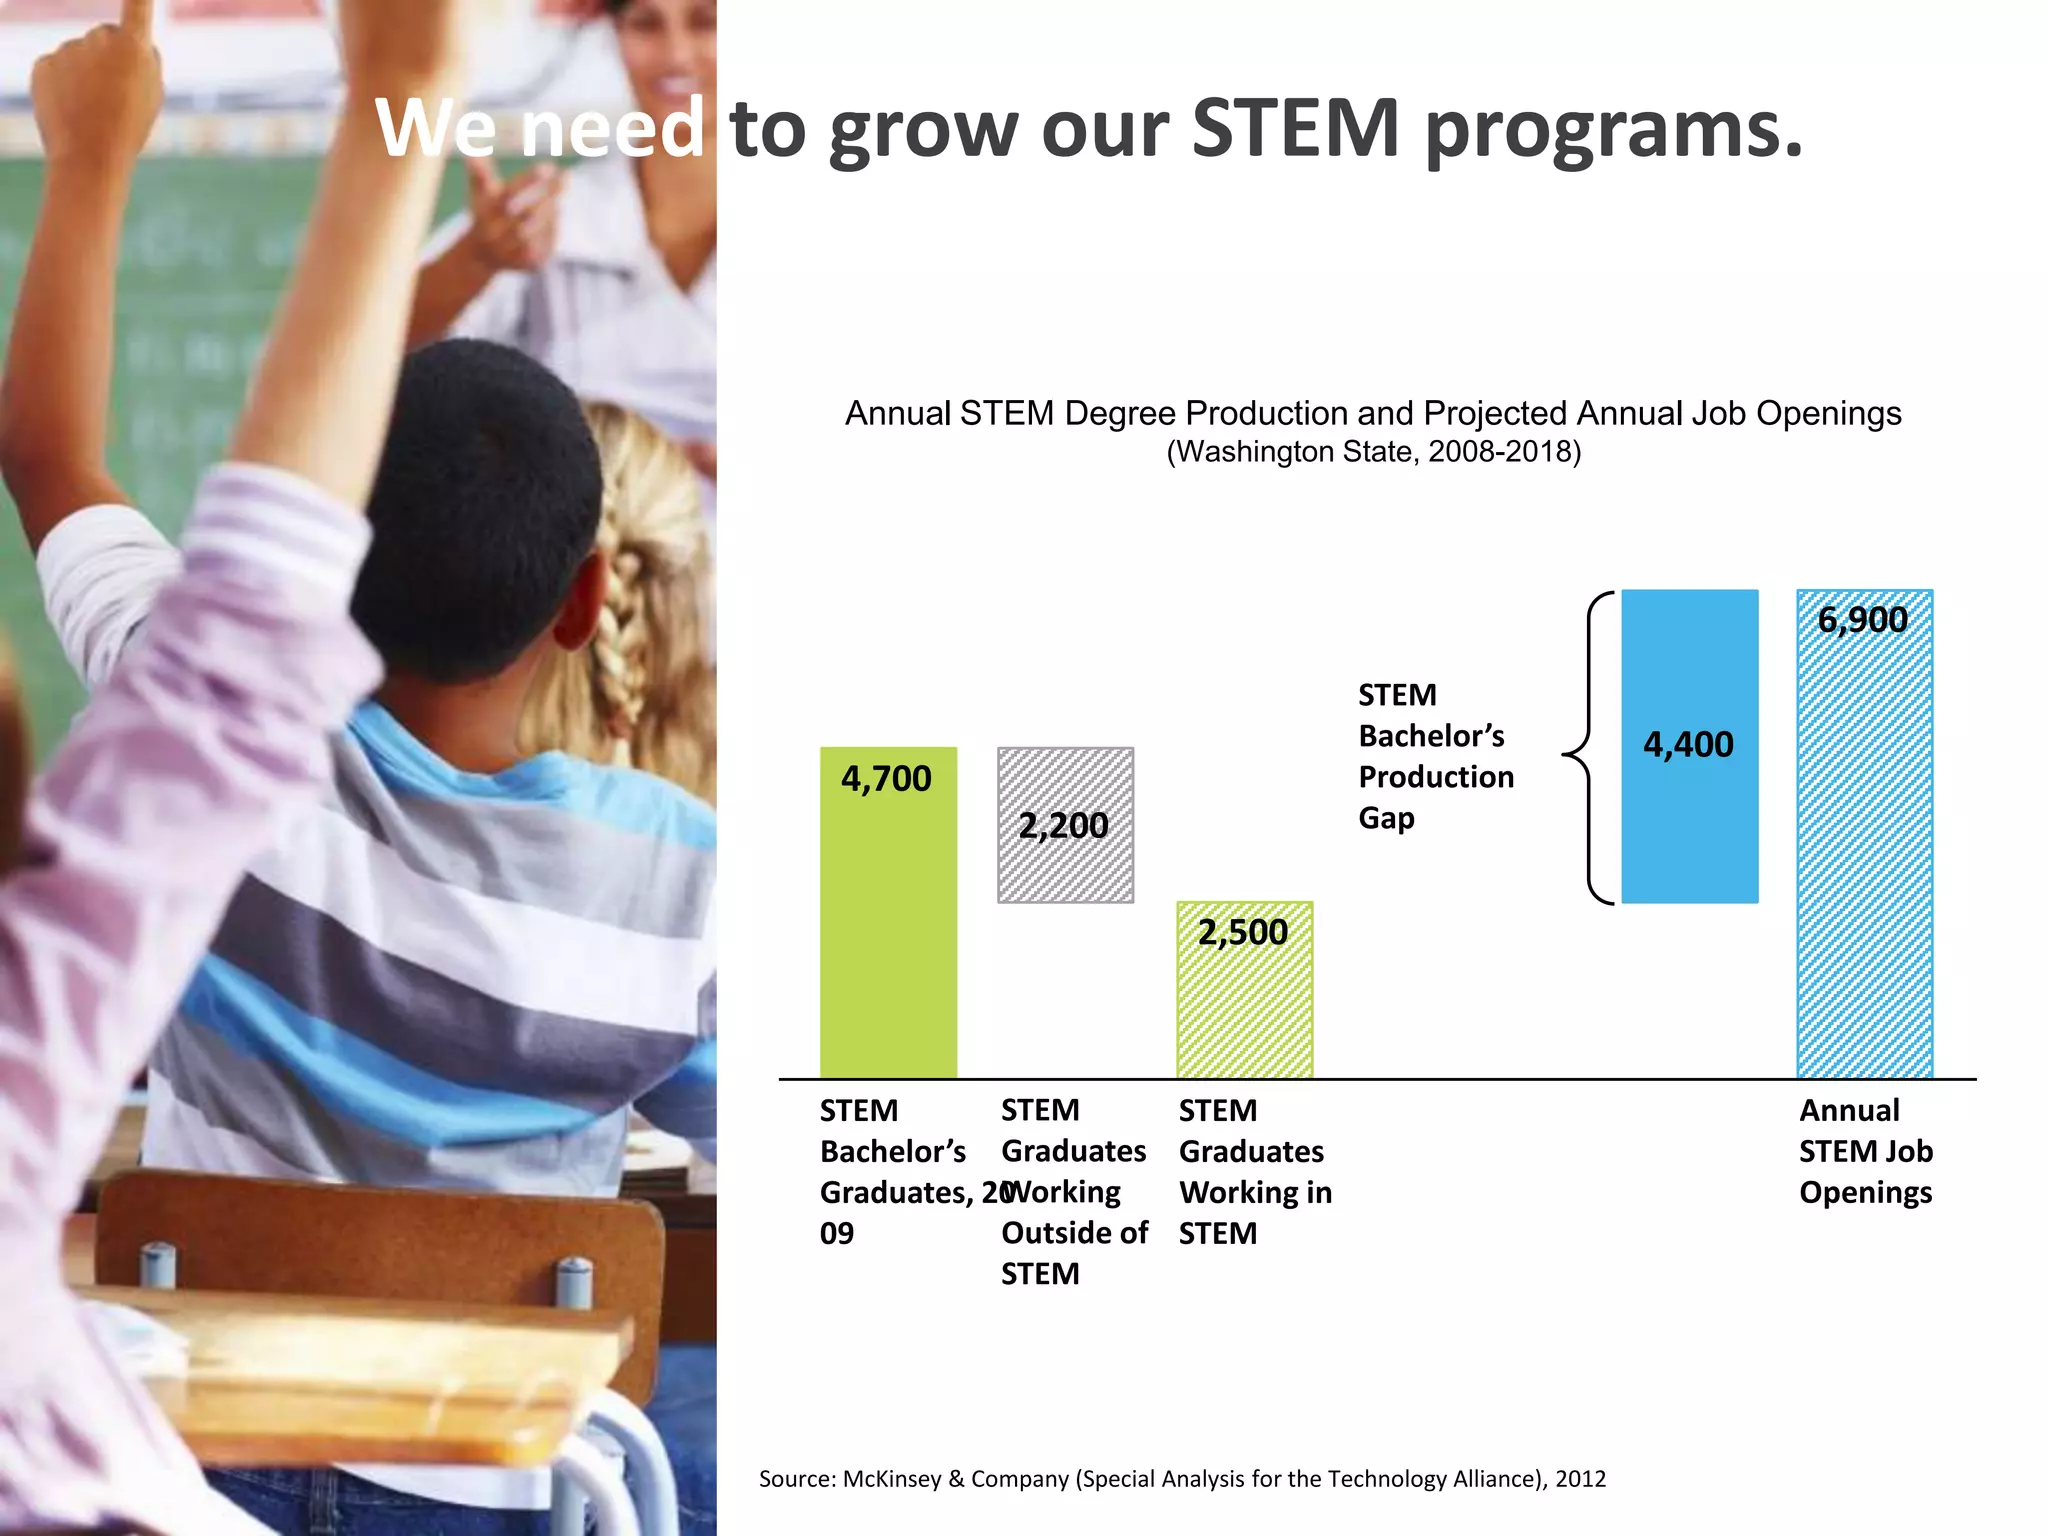
The State of Technology


        INNOVATION
        OPPORTUNITY
        IMPACT

           Susannah Malarkey
   Executive Director, Technology Alliance
Thought leaders for a strong innovation economy.
Our focus: 3 drivers of economic success.


            Excellent K-12 & higher
            education systems


            Strong research &
            commercialization


            Robust entrepreneurial
            climate
What we do: inspire, connect, and inform.

              Inspire appreciation and
              support for our world-class
              research institutions


              Create a more connected
              innovation community to
              advance commercialization


              Inform policy & business
              leaders about the impact of
              our innovative sectors
Innovation is in our nature.
                           Industry Break-down of Technology-Based Employment

                                                      University & Federal Research
                Waste Treatment & Remediation                                  Chemicals & Petroleum

            Management of Companies                                                  Machinery
                 & Enterprises                                                              Computers & Electrical
                                                                                           Equipment Manufacturing
                Scientific R&D


             Management
             & Technical                                                       Aerospace &
              Consulting                                                      Motor Vehicle
                                     Architecture &                           Manufacturing
                                      Engineering

                                                                                                          Electronic
                                                                Software,
                                                     Computer Data Processing                             Shopping
            Telecommunications                        Systems & Other Info.
                                                       Design                                 Commercial
                                                                 Services
                                                                                          Equipment Merchant
                                                                                              Wholesalers

                                   Total Tech-Based Jobs=434,343
            Source: William B. Beyers/Technology Alliance, The Economic Impact of Technology-based Industries
            in Washington State, 2012
Tech industries are growing.

                                   Private Sector Technology-based Employment, 1988-2011
                  400,000


                  350,000


                  300,000


                  250,000


                  200,000


                  150,000


                  100,000


                    50,000


                          0
                               1988     1990     1992     1994      1996     1998     2000     2002     2007        2009   2011

                                      Other Tech              Software/Computer Services                       Aerospace


                Source: William B. Beyers/Technology Alliance, The Economic Impact of Technology-based Industries
                in Washington State, 2012
Tech industries create jobs across our state.

                                     Direct Technology-based Employment, by County


                                                        6,076
                                                         2,551
                                      5,525
                                                        60,866

                                                                                                                    13,454
                                                     247,958

                                                    14,146                                                          3,499
                                         4,046


                                                                      2,404
                                           1,537
                                                                                      20,256
                                                                      1,141
                                   13,709


                        > 10,000             1,000–10,000                251–1,000               101–250                < 100


                Source: William B. Beyers/Technology Alliance, The Economic Impact of Technology-based Industries
                in Washington State, 2012
Tech industries are high-impact.


                             Labor $94,531
                           Income $49,829


                        Out-of- 76%
                     State Sales 27%


                             Job 3.32
                       Multiplier 2.33                                                               Non-tech industries


                       Indicators of Economic Activity: Tech-Based vs. All Other Industries


                Source: William B. Beyers/Technology Alliance, The Economic Impact of Technology-based Industries
                in Washington State, 2012
Tech industries create jobs across our economy.

                                                         1,441,721


                                                                                               Services
                                         1,007,378                                             748,945


                           494,343
                                                                                          Trade                     Other
                                                                                         176,251                    48,463
                             Tech-                           Total
                             based         Indirect          Jobs                                   Manufacturing
                                                                                                       33,719
                              Jobs           Jobs           Impact

                                        Tech-Based Job Impacts in Washington State


                Source: William B. Beyers/Technology Alliance, The Economic Impact of Technology-based Industries
                in Washington State, 2012
Our vision for Washington’s future success:


             Washington will be home to the
             best educated, most innovative
             workforce in the nation, and the
             most attractive location in which to
             start, grow and sustain the
             innovative companies that create
             new, high-impact jobs.
Workforce: Washington’s got talent.

                                                 2                                                            1
                             5                                       5
                                                                                         8


                    Intensity of           Engineers           Computer              Life &           % of payroll
                   S&E workforce                               specialists          Physical          in high tech
                                                                                    Scientists           NAICS


                           Washington’s National Ranking: Innovative Workforce
                                             (Various Years)
            Sources: National Science Foundation, Science & Engineering Indicators, 2012; Milken Institute, State
            Technology & Science Index, 2011
But… we’ve also got a mismatch.


                         Washington’s National Ranking: Degree Production
                                          (Various Years)


                      32
                                         37

                                                            45                  45                 44
                   NS&E                Total           Engineering Computer S&E graduate
                 bachelor’s         bachelor’s           degrees science degrees program
                 production         production          per 1,000   per 1,000   participation
                                                       occupations occupations


      Sources: National Science Foundation, Science & Engineering Indicators, 2012; National Council on
      Higher Education Management Systems.
And… we have disinvested in talent.

                    Major State Budget Components, % Change in General Fund
                                         Appropriations
                                      2007-09 Biennium to 2012 Supplemental
                              (Higher Education includes Opportunity Pathways Account)

       +5%

          0

       -5%

      -10%

      -15%

      -20%

      -25%

      -30%
                 Total State              Higher Education                 Human Services   K-12


      Source: Washington State Higher Education Coordinating Board, 2012
We need to grow our STEM programs.

                Annual STEM Degree Production and Projected Annual Job Openings
                                              (Washington State, 2008-2018)


                                                                                                    6,900
                                                                STEM
                                                                Bachelor’s                 4,400
                4,700                                           Production
                                 2,200                          Gap


                                                 2,500


              STEM        STEM                  STEM                                               Annual
              Bachelor’s Graduates              Graduates                                          STEM Job
                          Working
              Graduates, 20                     Working in                                         Openings
              09          Outside of            STEM
                          STEM


         Source: McKinsey & Company (Special Analysis for the Technology Alliance), 2012
Our partners: advancing the innovation agenda.

              Innovation Coalition: the unified voice of
              the statewide innovation community


              TA Associates: a regional network supporting
              innovation centers across the state
Questions?
susannahm@technology-alliance.com
     www.technology-alliance.com

TAG Luncheon: State of Technology

  • 1.
    The State ofTechnology INNOVATION OPPORTUNITY IMPACT Susannah Malarkey Executive Director, Technology Alliance
  • 2.
    Thought leaders fora strong innovation economy.
  • 3.
    Our focus: 3drivers of economic success. Excellent K-12 & higher education systems Strong research & commercialization Robust entrepreneurial climate
  • 4.
    What we do:inspire, connect, and inform. Inspire appreciation and support for our world-class research institutions Create a more connected innovation community to advance commercialization Inform policy & business leaders about the impact of our innovative sectors
  • 5.
    Innovation is inour nature. Industry Break-down of Technology-Based Employment University & Federal Research Waste Treatment & Remediation Chemicals & Petroleum Management of Companies Machinery & Enterprises Computers & Electrical Equipment Manufacturing Scientific R&D Management & Technical Aerospace & Consulting Motor Vehicle Architecture & Manufacturing Engineering Electronic Software, Computer Data Processing Shopping Telecommunications Systems & Other Info. Design Commercial Services Equipment Merchant Wholesalers Total Tech-Based Jobs=434,343 Source: William B. Beyers/Technology Alliance, The Economic Impact of Technology-based Industries in Washington State, 2012
  • 6.
    Tech industries aregrowing. Private Sector Technology-based Employment, 1988-2011 400,000 350,000 300,000 250,000 200,000 150,000 100,000 50,000 0 1988 1990 1992 1994 1996 1998 2000 2002 2007 2009 2011 Other Tech Software/Computer Services Aerospace Source: William B. Beyers/Technology Alliance, The Economic Impact of Technology-based Industries in Washington State, 2012
  • 7.
    Tech industries createjobs across our state. Direct Technology-based Employment, by County 6,076 2,551 5,525 60,866 13,454 247,958 14,146 3,499 4,046 2,404 1,537 20,256 1,141 13,709 > 10,000 1,000–10,000 251–1,000 101–250 < 100 Source: William B. Beyers/Technology Alliance, The Economic Impact of Technology-based Industries in Washington State, 2012
  • 8.
    Tech industries arehigh-impact. Labor $94,531 Income $49,829 Out-of- 76% State Sales 27% Job 3.32 Multiplier 2.33 Non-tech industries Indicators of Economic Activity: Tech-Based vs. All Other Industries Source: William B. Beyers/Technology Alliance, The Economic Impact of Technology-based Industries in Washington State, 2012
  • 9.
    Tech industries createjobs across our economy. 1,441,721 Services 1,007,378 748,945 494,343 Trade Other 176,251 48,463 Tech- Total based Indirect Jobs Manufacturing 33,719 Jobs Jobs Impact Tech-Based Job Impacts in Washington State Source: William B. Beyers/Technology Alliance, The Economic Impact of Technology-based Industries in Washington State, 2012
  • 10.
    Our vision forWashington’s future success: Washington will be home to the best educated, most innovative workforce in the nation, and the most attractive location in which to start, grow and sustain the innovative companies that create new, high-impact jobs.
  • 11.
    Workforce: Washington’s gottalent. 2 1 5 5 8 Intensity of Engineers Computer Life & % of payroll S&E workforce specialists Physical in high tech Scientists NAICS Washington’s National Ranking: Innovative Workforce (Various Years) Sources: National Science Foundation, Science & Engineering Indicators, 2012; Milken Institute, State Technology & Science Index, 2011
  • 12.
    But… we’ve alsogot a mismatch. Washington’s National Ranking: Degree Production (Various Years) 32 37 45 45 44 NS&E Total Engineering Computer S&E graduate bachelor’s bachelor’s degrees science degrees program production production per 1,000 per 1,000 participation occupations occupations Sources: National Science Foundation, Science & Engineering Indicators, 2012; National Council on Higher Education Management Systems.
  • 13.
    And… we havedisinvested in talent. Major State Budget Components, % Change in General Fund Appropriations 2007-09 Biennium to 2012 Supplemental (Higher Education includes Opportunity Pathways Account) +5% 0 -5% -10% -15% -20% -25% -30% Total State Higher Education Human Services K-12 Source: Washington State Higher Education Coordinating Board, 2012
  • 14.
    We need togrow our STEM programs. Annual STEM Degree Production and Projected Annual Job Openings (Washington State, 2008-2018) 6,900 STEM Bachelor’s 4,400 4,700 Production 2,200 Gap 2,500 STEM STEM STEM Annual Bachelor’s Graduates Graduates STEM Job Working Graduates, 20 Working in Openings 09 Outside of STEM STEM Source: McKinsey & Company (Special Analysis for the Technology Alliance), 2012
  • 15.
    Our partners: advancingthe innovation agenda. Innovation Coalition: the unified voice of the statewide innovation community TA Associates: a regional network supporting innovation centers across the state
  • 16.