SlideShare a Scribd company logo
1 of 8
A PROJECT REPORT ON FMCG MARKET SRUCTURE AND MARKET SHARE
What is FMCG?
FMCG is an acronym for Fast Moving Consumer Goods, which refer to things that we buy from local
supermarkets on daily basis, the things that are non-durable, sold quickly, at relatively low cost, have high
turnover and are relatively cheaper. FMCG’s constitute a large part of consumers’ budget in all countries. The
most common in thelist are baby foods, toilet soaps, detergents, shampoos, toothpaste, cosmetics, shaving
products, shoe polish, refined cooking oil, packaged foodstuff, soft drinks, chocolate bar, tissue paper and other
household accessories and extends to certain electronic goods and other non-durables such as glassware, bulbs,
batteries, paper products and plastic goods, such as buckets etc. These items are meant for daily of frequent
consumption and have a high return. FMCG are products that have a quick shelf turnover, at relatively low cost
and don't require a lot of thought, time and financial investment to purchase. The margin of profit on every
individual FMCG product is less but as they sell in large quantities so the cumulative profit on such products are
high. Hence profit in FMCG goods always translates to number of goods sold.

The main segments of FMCG sector are :
1) Personal care, Oral Care, Hair Care, Skin Care, Personal Wash (cosmetics and toiletries (soaps), deodorants,
   perfumes, male grooming, feminine hygiene, paper product);
2) Household care (fabric wash laundry soaps, synthetic detergents, household cleaners, such as dish/utensil
   cleaners, floor cleaners, toilet cleaners, air fresheners, insecticides and mosquito repellents, metal polish and
   furniture polish);
3) Packaged food and health beverages (flour, tea, coffee, sugar, staples, cereals, dairy products, chocolates, soft
   drinks, juices, bottled water, snack food, chocolates and cakes)
4) Tobacco.

India & the FMCG Market:
The Indian FMCG sector is an important contributor to the country's GDP. The Indian FMCG sector with a
market size of US$14.8 billion is the fourth largest sector in the economy and is responsible for 5% of the total
factory employment in India. The FMCG industry also creates employment for 3 million people in downstream
activities, much of which is disbursed in small towns and rural India. This FMCG industry has witnessed strong
growth in the past decade. This has been due to liberalization, urbanization, increase in the disposable incomes
and altered lifestyle. Furthermore, the FMCG boom increased due to the reduction in excise duties, packaging
innovations etc. and unlike the perception that the FMCG sector is a producer of luxury items targeted for the elite
but in reality, the sector meets the every day needs of the masses. The lower-middle income group accounts for
over 60% of the sector's sales. At present, urban India accounts for 66% of total FMCG consumption, with rural
India accounting for the remaining 34%. The growing incline of rural and semi-urban folks for FMCG products
will be mainly responsible for the growth in this sector, as manufacturers will have to deepen their concentration
for higher sales volumes. Many of the global FMCG majors have been present in the country for many decades.
But in the last ten years, many of the smaller rung Indian FMCG companies have gained in scale. As a result, the
unorganized and regional players have witnessed erosion in the market share. Availability of key raw materials,
cheaper labor costs and presence across the entire value chain gives India a competitive advantage. The FMCG
market is set to double from USD 14.7 billion in 2008-09 to USD 30 billion in 2012. FMCG sector will witness
more than 60 per cent growth in rural and semi-urban India. The bottom line is that Indian market is changing
rapidly and is showing unprecedented consumer business opportunity.

History of FMCG in India:
In India, companies like ITC, HLL, Colgate, Cadbury and Nestle have been a dominant force in the FMCG sector
well supported by relatively less competition and high entry barriers (import duty was high). These companies
were, therefore, able to charge a premium for their products. In this context, the margins were also on the higher
side. With the gradual opening up of the economy over the last decade, FMCG companies have been forced to
fight for a market share. In the process, margins have been compromised, more so in the last six years (FMCG
sector witnessed decline in demand).

The following are the main characteristics of FMCGs:
• From the customer’s perspective:
1. Frequent purchase
2. Low involvement (little or no effort to choose the item -- products with strong brand loyalty are
exceptions to this rule)
3. Low price
• From the companies perspective:
1. High volumes
2. Low contribution margins
3. Extensive distribution networks
4. High stock turnover

Major FMCG companies in India:
Hindustan Unilever Ltd.,
ITC (Indian Tobacco Company),
Nestle India Ltd.,
GCMMF (AMUL),
Dabur India,
Asian Paints (India),
Cadbury India,
Britannia Industries,
Procter & Gamble Hygiene and Health Care,
Marico Industries,
Nirma,
Coca-Cola,
Pepsi
MARKET SHARE OF FMCG COMPANIES (BABY FOOD) IN INDIA FROM
2001 TO 2010


                  0.599907159

                                      1.128131912
                  2.698450964


                                                                            Cadbury India Ltd.

                                             17.48070824                    Glaxosmithkline Consumer Healthcare
                                                                            Ltd.
                                                                            Continental Milkose (India) Ltd.


                                                                            Jagatjit Industries Ltd.


                                                                            Milkfood Ltd.
                                                          19.08547979
        45.66437686
                                                                            Nestle India Ltd.


                                                                            Raptakos, Brett & Co. Ltd.


                                                                            Cepham Milk Specialities Ltd.

                                            8.876993833       0.891364642
                                                                            Heinz India Pvt. Ltd.


                                   3.574586605


In the above pie chart we see the total sales during the financial years from 2001 to 2010 of various FMCG Food
Beverage companies in India .
THE COMPARATIVE DATA OF % MARKET SHARE OF NESTLE INDIA
LTD. WITH ALL OTHER COMPETITOR, DURING THE LAST 10 YEARS
FROM 2001 TO 2010
  6000
                                                                                            5232.59
  5000
                                                                                 4472.04

  4000                                                                 3647.49
                                                                                                      NESTLE (MARKET SHARE %)
                                                              2944.2                                  CADBURY (MARKET SHARE %)
  3000                                              2643.96
                                                                                                      GLAXO (MARKET SHARE %)
                                  2285.52 2373.16
                1927.28 2058.95                                                                       JAGATJIT (MARKET SHARE %)2
  20001680.31
                                                                                                      MILKFOOD (MARKET SHARE %)

  1000


      0
           2001    2002    2003      2004    2005      2006      2007     2008        2009     2010


(Above graph showing the FMCG Food Beverage – Baby Food companies percentage market share in the last 10
years from 2001to 2010)
So we can see that in overall FMCG business Nestle India Ltd is distantly ahead of the rest of the companies as
far as market share is concerned.

MARKET SHARE IN THE YEAR 2010

Measurement of Market Structure:

Herfindahl–Hirschman Index:                                      HHI         i
                                                                                 ( Si ) 2

Si is the market share of the ith firm
Numbers-Equivalent of firms: Reciprocal of HHI

                                                      MARKET SHARE IN
 FOOD BEVERGE COMPANIES (BABY FOOD)                   2010 (Si)                                              ( Si ) 2
                                                                0.185753
 Cadbury India Ltd.                                                                                         0.034
                                                                                  0
 Cepham Milk Specialities Ltd.                                                                                     0
                                                                       0.012213
 Continental Milkose (India) Ltd.                                                                           1.491
                                                                       0.188628
 Glaxosmithkline Consumer Healthcare Ltd.                                                                   0.036
                                                                                  0
 Heinz India Pvt. Ltd.                                                                                             0
                                                                       0.084911
 Jagatjit Industries Ltd.                                                                                   7.209
 Kaira District Co-Op. Milk Producers' Union                           0.028029
 Ltd.                                                                                                       7.856
0.475272
 Nestle India Ltd.                                                                                      0.225
                                                                           0.025194
 Raptakos, Brett & Co. Ltd.                                                                             6.347
                                                         2
                          TOTAL =               ( Si )
                                            i
                                                                                                       23.198

Therefore,         HHI =      i
                                  ( Si ) 2 = 23.198

Reciprocal of HHI = 1/23.198 =0.043

Priyanka please check the previous calculation, I am not getting the
correct data.
FMCG SALES GROWTH OF LAST 10 YEARS

                            FMCG SALES GROWTH OF LAST 10 YEARS
          5500
          5000
          4500
          4000
          3500                                                                                                  NESTLE
          3000                                                                                                  CADBURY
          2500                                                                                                  GLAXO
          2000                                                                                                  JAGATJIT
          1500                                                                                                  MILKFOOD
          1000
             500
               0
                     2001   2002     2003       2004         2005   2006   2007   2008   2009   2010


As per the sales figures received of the year 2001 to 2011, in the past 10 years from 2001 to 2010, after plotting
the datas, we notice that the graph for Nestle is steeply rising, where as for Cadbury and Glaxo, the graph rise is
considerable, but for Jagatjit and Milkfood the graph rise is very minimal. Thus Nestle being the market leader
enjoys the position of the market laeder and also the profit.


FMCG SALES VOLUME GROWTH IN THE LAST 10 YEARS FROM
2001 TO 2010
FMCG SALES VOLUME GROWTH IN THE LAST 10 YEARS
                             FROM 2001 TO 2010
  12000


  10000


   8000


   6000                                                                     FMCG SALES VOLUME GROWTH IN THE
                                                                            LAST 10 YEARS FROM 2001 TO 2010
   4000


   2000


         0
             2001 2002 2003 2004 2005 2006 2007 2008 2009 2010


(Graph showing the FMCG trend throughout the last 10 years.)
FUTURE OPPORTUNITIES
India is a fast developing country with a huge population whose per capita income is growing rapidly and there is
huge opportunity for the FMCG companies.
The opportunities are as follows:
   Increasing per capita income is driving FMCG growth in India
   India’s consuming class is growing rapidly
   Changing consumption pattern: Per capita income of Indian customer is increasing and FMCG products are
   relatively elastic in nature hence the expected sale should increase.

PER CAPITA INCOME (Rs)

                                  PER CAPITA INCOME (Rs)
  1200
  1000
   800
   600
   400                                                                           PER CAPITA INCOME (Rs.)
   200
     0
             2000   2001   2002   2003   2004   2005   2006   2007   2008


(Above graph showing the trend of Per Capita Income of Indians and datas are collected from a research made by
Govt. of India).)
As shown in the above graph the Per Capita Income of an Indian increases gradually throughout the years, and if
this trend continues, then in future Indian Population will have more purchase power and will purchase more
FMCG products.

% OF PAST POPULATION RISE AND FUTURE EXPECTATION
% OF PAST POPULATION RISE AND FUTURE
                                    EXPECTATION
  45
                                                                          41.5
  40
  35                                                              35
  30                                                      30
                                                   27.5
  25                                       25
                                   23.5
  20                                                                             % of past population rise and future
                           20
                    18.5                                                         expectation
            17
  15
  10
   5
   0
        1950     1960   1970    1980   1990     2000   2010    2020    2030


(Above graph shows the past population and expected future population rise, data are collected from the research
made by Govt. of India).
Here by the above graphs we can see that there is huge scope for FMCG products and since Nestle India Ltd. is
the market leader in India hence it can gain the most out of it.

SWOT ANALYSIS:
   Strength
   1. Low operational costs
   2. Established distribution networks in both urban and rural areas.
   3. Presence of well-known brands in FMCG sector.
   Weaknesses
   1. Lower scope of investing in technology and achieving economies of scale.
   2. Low exports levels
   3. Counterfeit Products.
   Opportunities
   1. Untapped rural market
   2. Rising income levels
   3. Large domestic market-.
   4. Export potential
   5. High consumer goods spending.
   Threats
   1. Removal of import restrictions.
   2. Slowdown in rural demand.
   3. Tax and regulatory structure.

                                          CONCLUSION
Customers in India are also spending more in FMCG as their standard of living are growing. Though there was
some downfall in sales and profit, in the beginning of this decade but after that considerable rise in both sales and
profit, is seen.
Many FMCG companies has started project, to directly reach the rural market. This may be considered as a
revolutionary step since the urban market is reaching its saturation level and there is a huge scope exploring in the
rural market. This will also be helpful not only increasing its market share but also fight competition.
BIBLIOGRAPHY
In order to make this project we have taken the help of the following websites & books:
       www.wikipedia.com
       www.oppapers.com
       www.scribd.com
Besides it various books are also consulted to prepare project report.

More Related Content

What's hot

Cerebral heights institute of management
Cerebral heights institute of managementCerebral heights institute of management
Cerebral heights institute of managementMedDiPs Corporation
 
Marico presentation final
Marico presentation finalMarico presentation final
Marico presentation finalAmit Trivedi
 
Indian Tobacco Company - Analysis 2015
Indian Tobacco Company - Analysis 2015Indian Tobacco Company - Analysis 2015
Indian Tobacco Company - Analysis 2015Rahul Shetty
 
Marketing Strategy for ITC Ltd.
Marketing Strategy for ITC Ltd.Marketing Strategy for ITC Ltd.
Marketing Strategy for ITC Ltd.Tarun Shukla
 
Itc corporate-presentation
Itc corporate-presentationItc corporate-presentation
Itc corporate-presentationRohit Jaju
 
Equity Research Of Colgate Palmolive Imppppppp
Equity Research Of Colgate Palmolive ImpppppppEquity Research Of Colgate Palmolive Imppppppp
Equity Research Of Colgate Palmolive Impppppppshyamal0086
 
Fidelity equity fact sheet_december2011
Fidelity equity fact sheet_december2011Fidelity equity fact sheet_december2011
Fidelity equity fact sheet_december2011atul baride
 
Itc food brand strategy.
Itc food brand strategy.Itc food brand strategy.
Itc food brand strategy.SOUGATA PAN
 
Impact of marketing campaign for SUN Brand
Impact of marketing campaign for SUN Brand Impact of marketing campaign for SUN Brand
Impact of marketing campaign for SUN Brand Mohammed Ashraf
 
Retail industry-in-india
Retail industry-in-indiaRetail industry-in-india
Retail industry-in-indiaVitthal Parmar
 

What's hot (20)

Itc project
Itc projectItc project
Itc project
 
Hero moto corp
Hero moto corpHero moto corp
Hero moto corp
 
Cerebral heights institute of management
Cerebral heights institute of managementCerebral heights institute of management
Cerebral heights institute of management
 
Trend Analysis of ITC
Trend Analysis of ITCTrend Analysis of ITC
Trend Analysis of ITC
 
Marico presentation final
Marico presentation finalMarico presentation final
Marico presentation final
 
Itc
ItcItc
Itc
 
Indian Tobacco Company - Analysis 2015
Indian Tobacco Company - Analysis 2015Indian Tobacco Company - Analysis 2015
Indian Tobacco Company - Analysis 2015
 
Marketing Strategy for ITC Ltd.
Marketing Strategy for ITC Ltd.Marketing Strategy for ITC Ltd.
Marketing Strategy for ITC Ltd.
 
Itc Presentation
Itc PresentationItc Presentation
Itc Presentation
 
Daily Newsletter: 24th June, 2011
Daily Newsletter: 24th June, 2011Daily Newsletter: 24th June, 2011
Daily Newsletter: 24th June, 2011
 
Itc corporate-presentation
Itc corporate-presentationItc corporate-presentation
Itc corporate-presentation
 
Itc presentation
Itc presentationItc presentation
Itc presentation
 
Airtel ranjeet
Airtel ranjeetAirtel ranjeet
Airtel ranjeet
 
Equity Research Of Colgate Palmolive Imppppppp
Equity Research Of Colgate Palmolive ImpppppppEquity Research Of Colgate Palmolive Imppppppp
Equity Research Of Colgate Palmolive Imppppppp
 
Itc swot analysis
Itc swot analysisItc swot analysis
Itc swot analysis
 
Fidelity equity fact sheet_december2011
Fidelity equity fact sheet_december2011Fidelity equity fact sheet_december2011
Fidelity equity fact sheet_december2011
 
Itc food brand strategy.
Itc food brand strategy.Itc food brand strategy.
Itc food brand strategy.
 
Morning news _views_-_04012013
Morning news _views_-_04012013Morning news _views_-_04012013
Morning news _views_-_04012013
 
Impact of marketing campaign for SUN Brand
Impact of marketing campaign for SUN Brand Impact of marketing campaign for SUN Brand
Impact of marketing campaign for SUN Brand
 
Retail industry-in-india
Retail industry-in-indiaRetail industry-in-india
Retail industry-in-india
 

Viewers also liked

Nutrition in health science
Nutrition in health scienceNutrition in health science
Nutrition in health scienceNestlé SA
 
Nestle Professional - the out of home business in the USA
Nestle Professional - the out of home business in the USANestle Professional - the out of home business in the USA
Nestle Professional - the out of home business in the USANestlé SA
 
Nestlé Health Science in the USA
Nestlé Health Science in the USANestlé Health Science in the USA
Nestlé Health Science in the USANestlé SA
 
Marketing Plan 2014 - Final Project Intrax
Marketing Plan 2014 - Final Project Intrax Marketing Plan 2014 - Final Project Intrax
Marketing Plan 2014 - Final Project Intrax Lizandra Diani Telles
 
Research methodology presentation.
Research methodology presentation.Research methodology presentation.
Research methodology presentation.abhishek kumar
 
Nestle India Confectionery Market
Nestle India Confectionery Market Nestle India Confectionery Market
Nestle India Confectionery Market Vijay Mishra
 
role of sales promotion in FMCG Sector (Bathing Soaps)
role of sales promotion in FMCG Sector (Bathing Soaps)role of sales promotion in FMCG Sector (Bathing Soaps)
role of sales promotion in FMCG Sector (Bathing Soaps)Yug Bokadia
 
CONSUMER BUYING BEHAVIOR TOWARD HOME APPLIANCES
CONSUMER BUYING BEHAVIOR TOWARD HOME APPLIANCESCONSUMER BUYING BEHAVIOR TOWARD HOME APPLIANCES
CONSUMER BUYING BEHAVIOR TOWARD HOME APPLIANCESiliyassheikh
 
Changing trends of fmcg report (dharm project)
Changing trends of fmcg report (dharm project)Changing trends of fmcg report (dharm project)
Changing trends of fmcg report (dharm project)Dharmendra Kumar
 
Food and beverage industry india 2015
Food and beverage industry india 2015Food and beverage industry india 2015
Food and beverage industry india 2015sakshi taneja
 
India FMCG Sector Report May 2014
India FMCG Sector Report May 2014India FMCG Sector Report May 2014
India FMCG Sector Report May 2014iimjobs.com
 
Marketing Management Project.
Marketing Management Project.Marketing Management Project.
Marketing Management Project.roomzkazi
 
FMCG SECTOR ANALYSIS
FMCG SECTOR ANALYSISFMCG SECTOR ANALYSIS
FMCG SECTOR ANALYSISarjunarg
 

Viewers also liked (15)

Nutrition in health science
Nutrition in health scienceNutrition in health science
Nutrition in health science
 
Nestle Professional - the out of home business in the USA
Nestle Professional - the out of home business in the USANestle Professional - the out of home business in the USA
Nestle Professional - the out of home business in the USA
 
Nestlé Health Science in the USA
Nestlé Health Science in the USANestlé Health Science in the USA
Nestlé Health Science in the USA
 
Marketing Plan 2014 - Final Project Intrax
Marketing Plan 2014 - Final Project Intrax Marketing Plan 2014 - Final Project Intrax
Marketing Plan 2014 - Final Project Intrax
 
Research methodology presentation.
Research methodology presentation.Research methodology presentation.
Research methodology presentation.
 
Nestle India Confectionery Market
Nestle India Confectionery Market Nestle India Confectionery Market
Nestle India Confectionery Market
 
role of sales promotion in FMCG Sector (Bathing Soaps)
role of sales promotion in FMCG Sector (Bathing Soaps)role of sales promotion in FMCG Sector (Bathing Soaps)
role of sales promotion in FMCG Sector (Bathing Soaps)
 
CONSUMER BUYING BEHAVIOR TOWARD HOME APPLIANCES
CONSUMER BUYING BEHAVIOR TOWARD HOME APPLIANCESCONSUMER BUYING BEHAVIOR TOWARD HOME APPLIANCES
CONSUMER BUYING BEHAVIOR TOWARD HOME APPLIANCES
 
Changing trends of fmcg report (dharm project)
Changing trends of fmcg report (dharm project)Changing trends of fmcg report (dharm project)
Changing trends of fmcg report (dharm project)
 
Food and beverage industry india 2015
Food and beverage industry india 2015Food and beverage industry india 2015
Food and beverage industry india 2015
 
FMCG
FMCGFMCG
FMCG
 
India FMCG Sector Report May 2014
India FMCG Sector Report May 2014India FMCG Sector Report May 2014
India FMCG Sector Report May 2014
 
Fmcg ppt
Fmcg pptFmcg ppt
Fmcg ppt
 
Marketing Management Project.
Marketing Management Project.Marketing Management Project.
Marketing Management Project.
 
FMCG SECTOR ANALYSIS
FMCG SECTOR ANALYSISFMCG SECTOR ANALYSIS
FMCG SECTOR ANALYSIS
 

Similar to Bebm[1]

Similar to Bebm[1] (20)

Fmcg
FmcgFmcg
Fmcg
 
swot analysis of fmcg industry
swot analysis of fmcg industryswot analysis of fmcg industry
swot analysis of fmcg industry
 
FMCG
FMCGFMCG
FMCG
 
BSE FMCG INDEX
BSE FMCG INDEXBSE FMCG INDEX
BSE FMCG INDEX
 
ITC’s sun feast and biscuit industry ppt
 ITC’s sun feast and biscuit industry ppt ITC’s sun feast and biscuit industry ppt
ITC’s sun feast and biscuit industry ppt
 
Britannia industries
Britannia industriesBritannia industries
Britannia industries
 
Research insight on Britannia industries
Research insight on Britannia industriesResearch insight on Britannia industries
Research insight on Britannia industries
 
Fm analysis itc
Fm analysis itcFm analysis itc
Fm analysis itc
 
FMCG sector in india
FMCG sector in indiaFMCG sector in india
FMCG sector in india
 
Itc ppt
Itc pptItc ppt
Itc ppt
 
marico limited
marico limitedmarico limited
marico limited
 
Organised Retail & Supply chain
Organised Retail & Supply chainOrganised Retail & Supply chain
Organised Retail & Supply chain
 
Marico
MaricoMarico
Marico
 
Fmcg industry in india
Fmcg industry in indiaFmcg industry in india
Fmcg industry in india
 
FMCG Industry
FMCG IndustryFMCG Industry
FMCG Industry
 
Fmcgppt
Fmcgppt Fmcgppt
Fmcgppt
 
24096182 analysis-of-fmcg-companies
24096182 analysis-of-fmcg-companies24096182 analysis-of-fmcg-companies
24096182 analysis-of-fmcg-companies
 
36556965 bcg-matrix-of-itc-ltd
36556965 bcg-matrix-of-itc-ltd36556965 bcg-matrix-of-itc-ltd
36556965 bcg-matrix-of-itc-ltd
 
Bcg matrix-of-itc-ltd-v02-1222197387335911-8(2)
Bcg matrix-of-itc-ltd-v02-1222197387335911-8(2)Bcg matrix-of-itc-ltd-v02-1222197387335911-8(2)
Bcg matrix-of-itc-ltd-v02-1222197387335911-8(2)
 
Industry (FMCG)
Industry (FMCG)Industry (FMCG)
Industry (FMCG)
 

Recently uploaded

VIP Call Girl Jamshedpur Aashi 8250192130 Independent Escort Service Jamshedpur
VIP Call Girl Jamshedpur Aashi 8250192130 Independent Escort Service JamshedpurVIP Call Girl Jamshedpur Aashi 8250192130 Independent Escort Service Jamshedpur
VIP Call Girl Jamshedpur Aashi 8250192130 Independent Escort Service JamshedpurSuhani Kapoor
 
M.C Lodges -- Guest House in Jhang.
M.C Lodges --  Guest House in Jhang.M.C Lodges --  Guest House in Jhang.
M.C Lodges -- Guest House in Jhang.Aaiza Hassan
 
Regression analysis: Simple Linear Regression Multiple Linear Regression
Regression analysis:  Simple Linear Regression Multiple Linear RegressionRegression analysis:  Simple Linear Regression Multiple Linear Regression
Regression analysis: Simple Linear Regression Multiple Linear RegressionRavindra Nath Shukla
 
Call Girls In Radisson Blu Hotel New Delhi Paschim Vihar ❤️8860477959 Escorts...
Call Girls In Radisson Blu Hotel New Delhi Paschim Vihar ❤️8860477959 Escorts...Call Girls In Radisson Blu Hotel New Delhi Paschim Vihar ❤️8860477959 Escorts...
Call Girls In Radisson Blu Hotel New Delhi Paschim Vihar ❤️8860477959 Escorts...lizamodels9
 
Call Girls Pune Just Call 9907093804 Top Class Call Girl Service Available
Call Girls Pune Just Call 9907093804 Top Class Call Girl Service AvailableCall Girls Pune Just Call 9907093804 Top Class Call Girl Service Available
Call Girls Pune Just Call 9907093804 Top Class Call Girl Service AvailableDipal Arora
 
Vip Dewas Call Girls #9907093804 Contact Number Escorts Service Dewas
Vip Dewas Call Girls #9907093804 Contact Number Escorts Service DewasVip Dewas Call Girls #9907093804 Contact Number Escorts Service Dewas
Vip Dewas Call Girls #9907093804 Contact Number Escorts Service Dewasmakika9823
 
Call Girls In Panjim North Goa 9971646499 Genuine Service
Call Girls In Panjim North Goa 9971646499 Genuine ServiceCall Girls In Panjim North Goa 9971646499 Genuine Service
Call Girls In Panjim North Goa 9971646499 Genuine Serviceritikaroy0888
 
Lucknow 💋 Escorts in Lucknow - 450+ Call Girl Cash Payment 8923113531 Neha Th...
Lucknow 💋 Escorts in Lucknow - 450+ Call Girl Cash Payment 8923113531 Neha Th...Lucknow 💋 Escorts in Lucknow - 450+ Call Girl Cash Payment 8923113531 Neha Th...
Lucknow 💋 Escorts in Lucknow - 450+ Call Girl Cash Payment 8923113531 Neha Th...anilsa9823
 
2024 Numerator Consumer Study of Cannabis Usage
2024 Numerator Consumer Study of Cannabis Usage2024 Numerator Consumer Study of Cannabis Usage
2024 Numerator Consumer Study of Cannabis UsageNeil Kimberley
 
Tech Startup Growth Hacking 101 - Basics on Growth Marketing
Tech Startup Growth Hacking 101  - Basics on Growth MarketingTech Startup Growth Hacking 101  - Basics on Growth Marketing
Tech Startup Growth Hacking 101 - Basics on Growth MarketingShawn Pang
 
rishikeshgirls.in- Rishikesh call girl.pdf
rishikeshgirls.in- Rishikesh call girl.pdfrishikeshgirls.in- Rishikesh call girl.pdf
rishikeshgirls.in- Rishikesh call girl.pdfmuskan1121w
 
Lowrate Call Girls In Laxmi Nagar Delhi ❤️8860477959 Escorts 100% Genuine Ser...
Lowrate Call Girls In Laxmi Nagar Delhi ❤️8860477959 Escorts 100% Genuine Ser...Lowrate Call Girls In Laxmi Nagar Delhi ❤️8860477959 Escorts 100% Genuine Ser...
Lowrate Call Girls In Laxmi Nagar Delhi ❤️8860477959 Escorts 100% Genuine Ser...lizamodels9
 
RE Capital's Visionary Leadership under Newman Leech
RE Capital's Visionary Leadership under Newman LeechRE Capital's Visionary Leadership under Newman Leech
RE Capital's Visionary Leadership under Newman LeechNewman George Leech
 
7.pdf This presentation captures many uses and the significance of the number...
7.pdf This presentation captures many uses and the significance of the number...7.pdf This presentation captures many uses and the significance of the number...
7.pdf This presentation captures many uses and the significance of the number...Paul Menig
 
Intro to BCG's Carbon Emissions Benchmark_vF.pdf
Intro to BCG's Carbon Emissions Benchmark_vF.pdfIntro to BCG's Carbon Emissions Benchmark_vF.pdf
Intro to BCG's Carbon Emissions Benchmark_vF.pdfpollardmorgan
 
GD Birla and his contribution in management
GD Birla and his contribution in managementGD Birla and his contribution in management
GD Birla and his contribution in managementchhavia330
 
Catalogue ONG NUOC PPR DE NHAT .pdf
Catalogue ONG NUOC PPR DE NHAT      .pdfCatalogue ONG NUOC PPR DE NHAT      .pdf
Catalogue ONG NUOC PPR DE NHAT .pdfOrient Homes
 
Mondelez State of Snacking and Future Trends 2023
Mondelez State of Snacking and Future Trends 2023Mondelez State of Snacking and Future Trends 2023
Mondelez State of Snacking and Future Trends 2023Neil Kimberley
 

Recently uploaded (20)

VIP Call Girl Jamshedpur Aashi 8250192130 Independent Escort Service Jamshedpur
VIP Call Girl Jamshedpur Aashi 8250192130 Independent Escort Service JamshedpurVIP Call Girl Jamshedpur Aashi 8250192130 Independent Escort Service Jamshedpur
VIP Call Girl Jamshedpur Aashi 8250192130 Independent Escort Service Jamshedpur
 
M.C Lodges -- Guest House in Jhang.
M.C Lodges --  Guest House in Jhang.M.C Lodges --  Guest House in Jhang.
M.C Lodges -- Guest House in Jhang.
 
Regression analysis: Simple Linear Regression Multiple Linear Regression
Regression analysis:  Simple Linear Regression Multiple Linear RegressionRegression analysis:  Simple Linear Regression Multiple Linear Regression
Regression analysis: Simple Linear Regression Multiple Linear Regression
 
Call Girls In Radisson Blu Hotel New Delhi Paschim Vihar ❤️8860477959 Escorts...
Call Girls In Radisson Blu Hotel New Delhi Paschim Vihar ❤️8860477959 Escorts...Call Girls In Radisson Blu Hotel New Delhi Paschim Vihar ❤️8860477959 Escorts...
Call Girls In Radisson Blu Hotel New Delhi Paschim Vihar ❤️8860477959 Escorts...
 
Forklift Operations: Safety through Cartoons
Forklift Operations: Safety through CartoonsForklift Operations: Safety through Cartoons
Forklift Operations: Safety through Cartoons
 
Call Girls Pune Just Call 9907093804 Top Class Call Girl Service Available
Call Girls Pune Just Call 9907093804 Top Class Call Girl Service AvailableCall Girls Pune Just Call 9907093804 Top Class Call Girl Service Available
Call Girls Pune Just Call 9907093804 Top Class Call Girl Service Available
 
Vip Dewas Call Girls #9907093804 Contact Number Escorts Service Dewas
Vip Dewas Call Girls #9907093804 Contact Number Escorts Service DewasVip Dewas Call Girls #9907093804 Contact Number Escorts Service Dewas
Vip Dewas Call Girls #9907093804 Contact Number Escorts Service Dewas
 
Call Girls In Panjim North Goa 9971646499 Genuine Service
Call Girls In Panjim North Goa 9971646499 Genuine ServiceCall Girls In Panjim North Goa 9971646499 Genuine Service
Call Girls In Panjim North Goa 9971646499 Genuine Service
 
Lucknow 💋 Escorts in Lucknow - 450+ Call Girl Cash Payment 8923113531 Neha Th...
Lucknow 💋 Escorts in Lucknow - 450+ Call Girl Cash Payment 8923113531 Neha Th...Lucknow 💋 Escorts in Lucknow - 450+ Call Girl Cash Payment 8923113531 Neha Th...
Lucknow 💋 Escorts in Lucknow - 450+ Call Girl Cash Payment 8923113531 Neha Th...
 
2024 Numerator Consumer Study of Cannabis Usage
2024 Numerator Consumer Study of Cannabis Usage2024 Numerator Consumer Study of Cannabis Usage
2024 Numerator Consumer Study of Cannabis Usage
 
Tech Startup Growth Hacking 101 - Basics on Growth Marketing
Tech Startup Growth Hacking 101  - Basics on Growth MarketingTech Startup Growth Hacking 101  - Basics on Growth Marketing
Tech Startup Growth Hacking 101 - Basics on Growth Marketing
 
rishikeshgirls.in- Rishikesh call girl.pdf
rishikeshgirls.in- Rishikesh call girl.pdfrishikeshgirls.in- Rishikesh call girl.pdf
rishikeshgirls.in- Rishikesh call girl.pdf
 
Best Practices for Implementing an External Recruiting Partnership
Best Practices for Implementing an External Recruiting PartnershipBest Practices for Implementing an External Recruiting Partnership
Best Practices for Implementing an External Recruiting Partnership
 
Lowrate Call Girls In Laxmi Nagar Delhi ❤️8860477959 Escorts 100% Genuine Ser...
Lowrate Call Girls In Laxmi Nagar Delhi ❤️8860477959 Escorts 100% Genuine Ser...Lowrate Call Girls In Laxmi Nagar Delhi ❤️8860477959 Escorts 100% Genuine Ser...
Lowrate Call Girls In Laxmi Nagar Delhi ❤️8860477959 Escorts 100% Genuine Ser...
 
RE Capital's Visionary Leadership under Newman Leech
RE Capital's Visionary Leadership under Newman LeechRE Capital's Visionary Leadership under Newman Leech
RE Capital's Visionary Leadership under Newman Leech
 
7.pdf This presentation captures many uses and the significance of the number...
7.pdf This presentation captures many uses and the significance of the number...7.pdf This presentation captures many uses and the significance of the number...
7.pdf This presentation captures many uses and the significance of the number...
 
Intro to BCG's Carbon Emissions Benchmark_vF.pdf
Intro to BCG's Carbon Emissions Benchmark_vF.pdfIntro to BCG's Carbon Emissions Benchmark_vF.pdf
Intro to BCG's Carbon Emissions Benchmark_vF.pdf
 
GD Birla and his contribution in management
GD Birla and his contribution in managementGD Birla and his contribution in management
GD Birla and his contribution in management
 
Catalogue ONG NUOC PPR DE NHAT .pdf
Catalogue ONG NUOC PPR DE NHAT      .pdfCatalogue ONG NUOC PPR DE NHAT      .pdf
Catalogue ONG NUOC PPR DE NHAT .pdf
 
Mondelez State of Snacking and Future Trends 2023
Mondelez State of Snacking and Future Trends 2023Mondelez State of Snacking and Future Trends 2023
Mondelez State of Snacking and Future Trends 2023
 

Bebm[1]

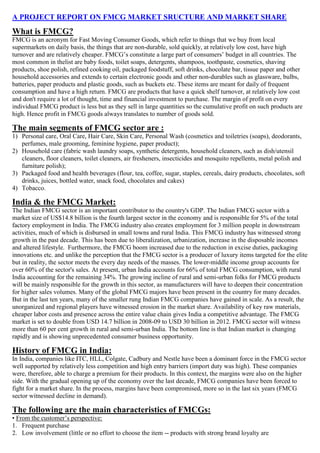
  • 1. A PROJECT REPORT ON FMCG MARKET SRUCTURE AND MARKET SHARE What is FMCG? FMCG is an acronym for Fast Moving Consumer Goods, which refer to things that we buy from local supermarkets on daily basis, the things that are non-durable, sold quickly, at relatively low cost, have high turnover and are relatively cheaper. FMCG’s constitute a large part of consumers’ budget in all countries. The most common in thelist are baby foods, toilet soaps, detergents, shampoos, toothpaste, cosmetics, shaving products, shoe polish, refined cooking oil, packaged foodstuff, soft drinks, chocolate bar, tissue paper and other household accessories and extends to certain electronic goods and other non-durables such as glassware, bulbs, batteries, paper products and plastic goods, such as buckets etc. These items are meant for daily of frequent consumption and have a high return. FMCG are products that have a quick shelf turnover, at relatively low cost and don't require a lot of thought, time and financial investment to purchase. The margin of profit on every individual FMCG product is less but as they sell in large quantities so the cumulative profit on such products are high. Hence profit in FMCG goods always translates to number of goods sold. The main segments of FMCG sector are : 1) Personal care, Oral Care, Hair Care, Skin Care, Personal Wash (cosmetics and toiletries (soaps), deodorants, perfumes, male grooming, feminine hygiene, paper product); 2) Household care (fabric wash laundry soaps, synthetic detergents, household cleaners, such as dish/utensil cleaners, floor cleaners, toilet cleaners, air fresheners, insecticides and mosquito repellents, metal polish and furniture polish); 3) Packaged food and health beverages (flour, tea, coffee, sugar, staples, cereals, dairy products, chocolates, soft drinks, juices, bottled water, snack food, chocolates and cakes) 4) Tobacco. India & the FMCG Market: The Indian FMCG sector is an important contributor to the country's GDP. The Indian FMCG sector with a market size of US$14.8 billion is the fourth largest sector in the economy and is responsible for 5% of the total factory employment in India. The FMCG industry also creates employment for 3 million people in downstream activities, much of which is disbursed in small towns and rural India. This FMCG industry has witnessed strong growth in the past decade. This has been due to liberalization, urbanization, increase in the disposable incomes and altered lifestyle. Furthermore, the FMCG boom increased due to the reduction in excise duties, packaging innovations etc. and unlike the perception that the FMCG sector is a producer of luxury items targeted for the elite but in reality, the sector meets the every day needs of the masses. The lower-middle income group accounts for over 60% of the sector's sales. At present, urban India accounts for 66% of total FMCG consumption, with rural India accounting for the remaining 34%. The growing incline of rural and semi-urban folks for FMCG products will be mainly responsible for the growth in this sector, as manufacturers will have to deepen their concentration for higher sales volumes. Many of the global FMCG majors have been present in the country for many decades. But in the last ten years, many of the smaller rung Indian FMCG companies have gained in scale. As a result, the unorganized and regional players have witnessed erosion in the market share. Availability of key raw materials, cheaper labor costs and presence across the entire value chain gives India a competitive advantage. The FMCG market is set to double from USD 14.7 billion in 2008-09 to USD 30 billion in 2012. FMCG sector will witness more than 60 per cent growth in rural and semi-urban India. The bottom line is that Indian market is changing rapidly and is showing unprecedented consumer business opportunity. History of FMCG in India: In India, companies like ITC, HLL, Colgate, Cadbury and Nestle have been a dominant force in the FMCG sector well supported by relatively less competition and high entry barriers (import duty was high). These companies were, therefore, able to charge a premium for their products. In this context, the margins were also on the higher side. With the gradual opening up of the economy over the last decade, FMCG companies have been forced to fight for a market share. In the process, margins have been compromised, more so in the last six years (FMCG sector witnessed decline in demand). The following are the main characteristics of FMCGs: • From the customer’s perspective: 1. Frequent purchase 2. Low involvement (little or no effort to choose the item -- products with strong brand loyalty are
  • 2. exceptions to this rule) 3. Low price • From the companies perspective: 1. High volumes 2. Low contribution margins 3. Extensive distribution networks 4. High stock turnover Major FMCG companies in India: Hindustan Unilever Ltd., ITC (Indian Tobacco Company), Nestle India Ltd., GCMMF (AMUL), Dabur India, Asian Paints (India), Cadbury India, Britannia Industries, Procter & Gamble Hygiene and Health Care, Marico Industries, Nirma, Coca-Cola, Pepsi
  • 3. MARKET SHARE OF FMCG COMPANIES (BABY FOOD) IN INDIA FROM 2001 TO 2010 0.599907159 1.128131912 2.698450964 Cadbury India Ltd. 17.48070824 Glaxosmithkline Consumer Healthcare Ltd. Continental Milkose (India) Ltd. Jagatjit Industries Ltd. Milkfood Ltd. 19.08547979 45.66437686 Nestle India Ltd. Raptakos, Brett & Co. Ltd. Cepham Milk Specialities Ltd. 8.876993833 0.891364642 Heinz India Pvt. Ltd. 3.574586605 In the above pie chart we see the total sales during the financial years from 2001 to 2010 of various FMCG Food Beverage companies in India .
  • 4. THE COMPARATIVE DATA OF % MARKET SHARE OF NESTLE INDIA LTD. WITH ALL OTHER COMPETITOR, DURING THE LAST 10 YEARS FROM 2001 TO 2010 6000 5232.59 5000 4472.04 4000 3647.49 NESTLE (MARKET SHARE %) 2944.2 CADBURY (MARKET SHARE %) 3000 2643.96 GLAXO (MARKET SHARE %) 2285.52 2373.16 1927.28 2058.95 JAGATJIT (MARKET SHARE %)2 20001680.31 MILKFOOD (MARKET SHARE %) 1000 0 2001 2002 2003 2004 2005 2006 2007 2008 2009 2010 (Above graph showing the FMCG Food Beverage – Baby Food companies percentage market share in the last 10 years from 2001to 2010) So we can see that in overall FMCG business Nestle India Ltd is distantly ahead of the rest of the companies as far as market share is concerned. MARKET SHARE IN THE YEAR 2010 Measurement of Market Structure: Herfindahl–Hirschman Index: HHI i ( Si ) 2 Si is the market share of the ith firm Numbers-Equivalent of firms: Reciprocal of HHI MARKET SHARE IN FOOD BEVERGE COMPANIES (BABY FOOD) 2010 (Si) ( Si ) 2 0.185753 Cadbury India Ltd. 0.034 0 Cepham Milk Specialities Ltd. 0 0.012213 Continental Milkose (India) Ltd. 1.491 0.188628 Glaxosmithkline Consumer Healthcare Ltd. 0.036 0 Heinz India Pvt. Ltd. 0 0.084911 Jagatjit Industries Ltd. 7.209 Kaira District Co-Op. Milk Producers' Union 0.028029 Ltd. 7.856
  • 5. 0.475272 Nestle India Ltd. 0.225 0.025194 Raptakos, Brett & Co. Ltd. 6.347 2 TOTAL = ( Si ) i 23.198 Therefore, HHI = i ( Si ) 2 = 23.198 Reciprocal of HHI = 1/23.198 =0.043 Priyanka please check the previous calculation, I am not getting the correct data. FMCG SALES GROWTH OF LAST 10 YEARS FMCG SALES GROWTH OF LAST 10 YEARS 5500 5000 4500 4000 3500 NESTLE 3000 CADBURY 2500 GLAXO 2000 JAGATJIT 1500 MILKFOOD 1000 500 0 2001 2002 2003 2004 2005 2006 2007 2008 2009 2010 As per the sales figures received of the year 2001 to 2011, in the past 10 years from 2001 to 2010, after plotting the datas, we notice that the graph for Nestle is steeply rising, where as for Cadbury and Glaxo, the graph rise is considerable, but for Jagatjit and Milkfood the graph rise is very minimal. Thus Nestle being the market leader enjoys the position of the market laeder and also the profit. FMCG SALES VOLUME GROWTH IN THE LAST 10 YEARS FROM 2001 TO 2010
  • 6. FMCG SALES VOLUME GROWTH IN THE LAST 10 YEARS FROM 2001 TO 2010 12000 10000 8000 6000 FMCG SALES VOLUME GROWTH IN THE LAST 10 YEARS FROM 2001 TO 2010 4000 2000 0 2001 2002 2003 2004 2005 2006 2007 2008 2009 2010 (Graph showing the FMCG trend throughout the last 10 years.) FUTURE OPPORTUNITIES India is a fast developing country with a huge population whose per capita income is growing rapidly and there is huge opportunity for the FMCG companies. The opportunities are as follows: Increasing per capita income is driving FMCG growth in India India’s consuming class is growing rapidly Changing consumption pattern: Per capita income of Indian customer is increasing and FMCG products are relatively elastic in nature hence the expected sale should increase. PER CAPITA INCOME (Rs) PER CAPITA INCOME (Rs) 1200 1000 800 600 400 PER CAPITA INCOME (Rs.) 200 0 2000 2001 2002 2003 2004 2005 2006 2007 2008 (Above graph showing the trend of Per Capita Income of Indians and datas are collected from a research made by Govt. of India).) As shown in the above graph the Per Capita Income of an Indian increases gradually throughout the years, and if this trend continues, then in future Indian Population will have more purchase power and will purchase more FMCG products. % OF PAST POPULATION RISE AND FUTURE EXPECTATION
  • 7. % OF PAST POPULATION RISE AND FUTURE EXPECTATION 45 41.5 40 35 35 30 30 27.5 25 25 23.5 20 % of past population rise and future 20 18.5 expectation 17 15 10 5 0 1950 1960 1970 1980 1990 2000 2010 2020 2030 (Above graph shows the past population and expected future population rise, data are collected from the research made by Govt. of India). Here by the above graphs we can see that there is huge scope for FMCG products and since Nestle India Ltd. is the market leader in India hence it can gain the most out of it. SWOT ANALYSIS: Strength 1. Low operational costs 2. Established distribution networks in both urban and rural areas. 3. Presence of well-known brands in FMCG sector. Weaknesses 1. Lower scope of investing in technology and achieving economies of scale. 2. Low exports levels 3. Counterfeit Products. Opportunities 1. Untapped rural market 2. Rising income levels 3. Large domestic market-. 4. Export potential 5. High consumer goods spending. Threats 1. Removal of import restrictions. 2. Slowdown in rural demand. 3. Tax and regulatory structure. CONCLUSION Customers in India are also spending more in FMCG as their standard of living are growing. Though there was some downfall in sales and profit, in the beginning of this decade but after that considerable rise in both sales and profit, is seen. Many FMCG companies has started project, to directly reach the rural market. This may be considered as a revolutionary step since the urban market is reaching its saturation level and there is a huge scope exploring in the rural market. This will also be helpful not only increasing its market share but also fight competition.
  • 8. BIBLIOGRAPHY In order to make this project we have taken the help of the following websites & books: www.wikipedia.com www.oppapers.com www.scribd.com Besides it various books are also consulted to prepare project report.