Download as PDF, PPTX


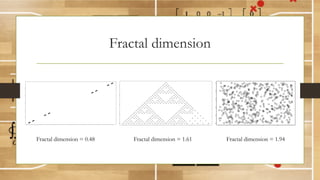
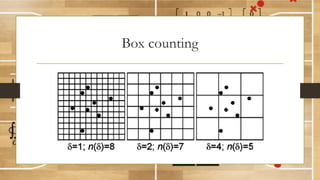
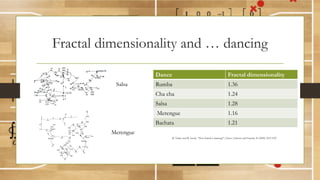
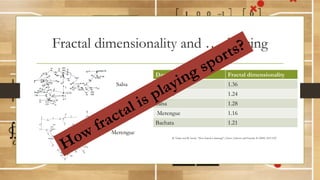
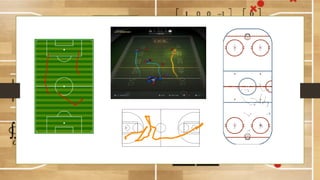
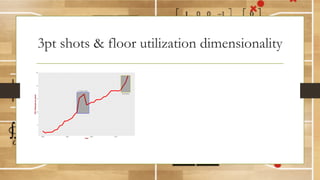
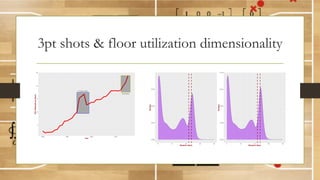
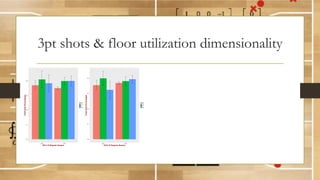
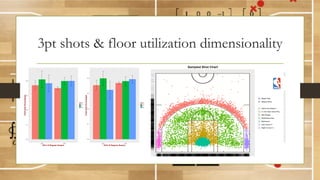
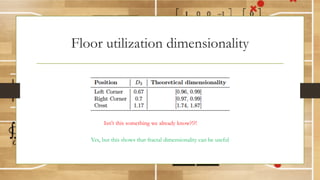
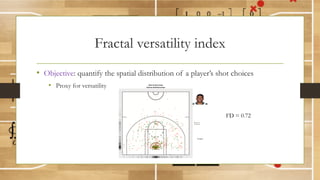
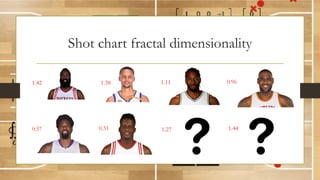
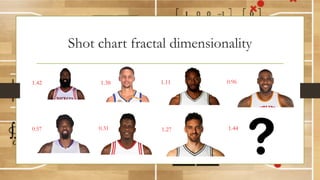

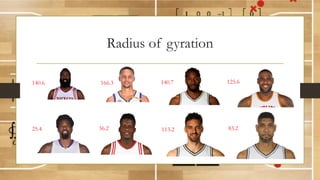
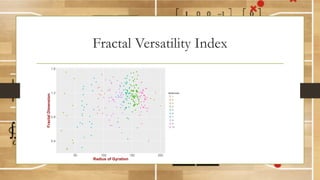
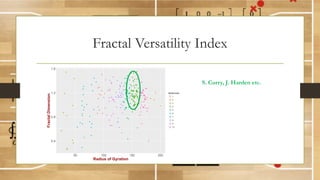
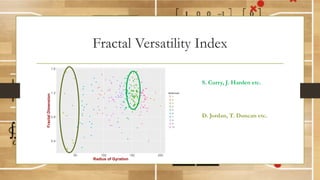

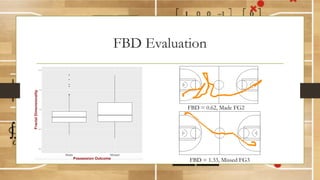
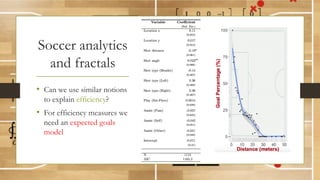
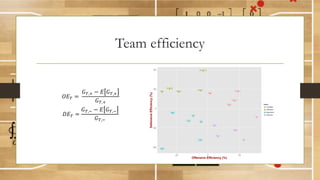
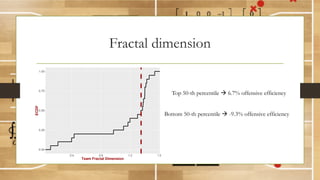
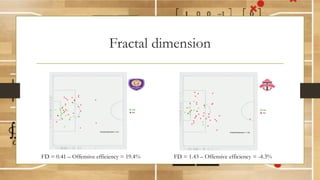


This document discusses using fractal analysis to analyze sports data. It provides examples of calculating fractal dimensions of dancing styles, shot charts in basketball, and soccer team efficiency. Calculating the fractal dimension can provide a single number to describe complex spatial patterns and quantify concepts like versatility. For example, shot charts with higher fractal dimensions indicate more varied shooting locations. This type of analysis may provide new insights into player/team performance beyond traditional statistics.


