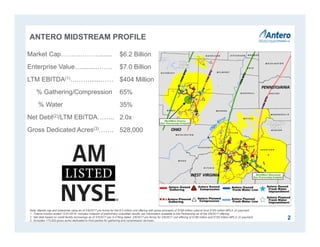
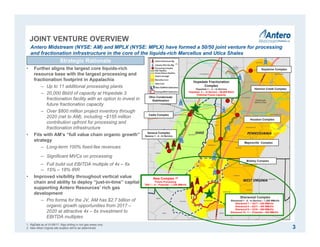
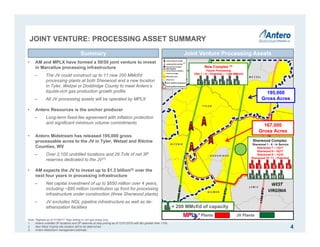
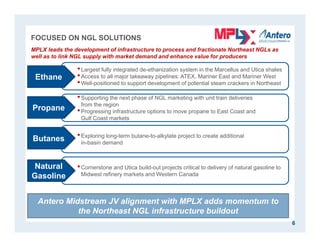
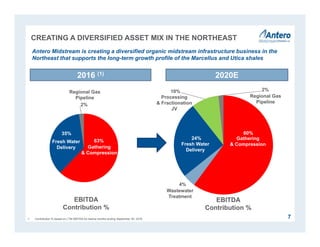
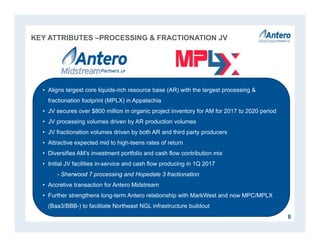
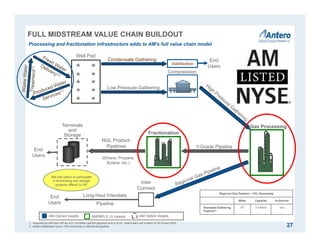
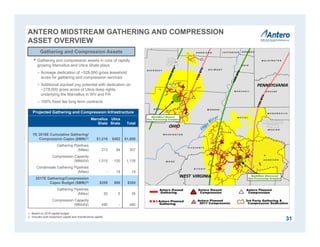
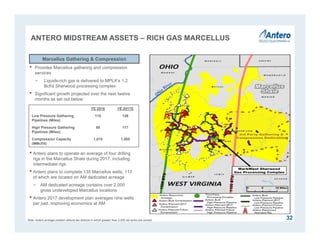
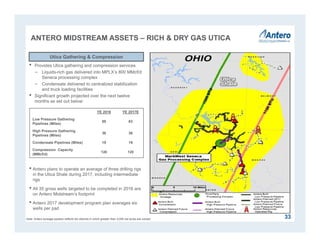
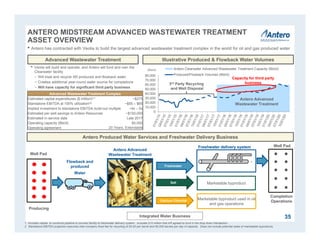
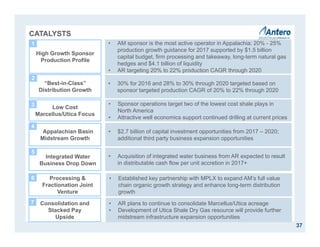
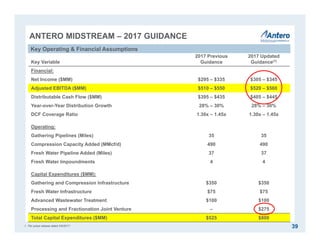
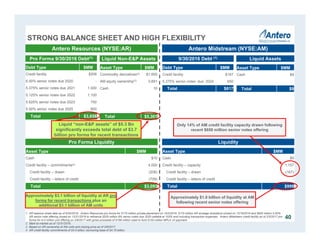
SlideShare a Scribd company logo
1 of 51
Download to read offline
Partnership Overview
February 2017
FORWARD-LOOKING STATEMENTS
This presentation contains forward-looking statements. All statements, other than statements of historical facts, included in this presentation
that address activities, events or developments that Antero Midstream Partners LP, and its subsidiaries (collectively, the “Partnership”) expect,
believe or anticipate will or may occur in the future are forward-looking statements. The words “believe,” “expect,” “anticipate,” “plan,” “intend,”
“estimate,” “project,” “foresee,” “should,” “would,” “could,” or other similar expressions are intended to identify forward-looking statements.
However, the absence of these words does not mean that the statements are not forward-looking. Without limiting the generality of the
foregoing, forward-looking statements contained in this presentation specifically include expectations of plans, strategies, objectives, and
anticipated financial and operating results of the Partnership and Antero Resources Corporation (“Antero Resources”). These statements are
based on certain assumptions made by the Partnership and Antero Resources based on management’s experience and perception of historical
trends, current conditions, anticipated future developments and other factors believed to be appropriate. Such statements are subject to a
number of assumptions, risks and uncertainties, many of which are beyond the control of the Partnership, which may cause actual results to
differ materially from those implied or expressed by the forward-looking statements. These include the factors discussed or referenced under
the heading “Item 1A. Risk Factors” in our Annual Report on Form 10-K for the year ended December 31, 2015 and in the Partnership’s
subsequent filings with the SEC.
The Partnership cautions you that these forward-looking statements are subject to risks and uncertainties that may cause these statements to
be inaccurate, and readers are cautioned not to place undue reliance on such statements. These risks include, but are not limited to, Antero
Resources’ expected future growth, Antero Resources’ ability to meet its drilling and development plan, commodity price volatility, inflation,
environmental risks, drilling and completion and other operating risks, regulatory changes, the uncertainty inherent in projecting future rates of
production, cash flow and access to capital, the timing of development expenditures, and the other risks discussed or referenced under the
heading “Item 1A. Risk Factors” in the Partnership’s Annual Report on Form 10-K for the year ended December 31, 2015 and in the
Partnership’s subsequent filings with the SEC.
Our ability to make future distributions is substantially dependent upon the development and drilling plan of Antero Resources, which itself is
substantially dependent upon the review and approval by the board of directors of Antero Resources of its capital budget on an annual
basis. In connection with the review and approval of the annual capital budget by the board of directors of Antero Resources, the board of
directors will take into consideration many factors, including expected commodity prices and the existing contractual obligations and capital
resources and liquidity of Antero Resources at the time.
Any forward-looking statement speaks only as of the date on which such statement is made, and the Partnership undertakes no obligation to
correct or update any forward-looking statement, whether as a result of new information, future events or otherwise, except as required by
applicable law.
1
Antero Midstream Partners LP is denoted as “AM” and Antero Resources Corporation is denoted as “AR” in
the presentation, which are their respective New York Stock Exchange ticker symbols.
ANTERO MIDSTREAM PROFILE
2
Market Cap……………….......
Enterprise Value….........…….
LTM EBITDA(1)………......……
% Gathering/Compression
% Water
Net Debt(2)/LTM EBITDA……..
Gross Dedicated Acres(3)…….
$6.2 Billion
$7.0 Billion
$404 Million
65%
35%
2.0x
528,000
Note: Market cap and enterprise value as of 2/6/2017 pro forma for the 6.0 million unit offering with gross proceeds of $198 million used to fund $155 million MPLX JV payment.
1. Twelve months ended 12/31/2016. Includes midpoint of preliminary unaudited results, per information available to the Partnership as of the 2/6/2017 offering.
2. Net debt based on credit facility borrowings as of 2/3/2017 per S-3 filing dated 2/6/2017 pro forma for 2/6/2017 unit offering of $198 million and $155 million MPLX JV payment.
3. Excludes 173,000 gross acres dedicated to third parties for gathering and compression services.
JOINT VENTURE OVERVIEW
3
Antero Midstream (NYSE: AM) and MPLX (NYSE: MPLX) have formed a 50/50 joint venture for processing
and fractionation infrastructure in the core of the liquids-rich Marcellus and Utica Shales
Majorsville Complex
Mobley Complex
Houston Complex
Keystone Complex
Harmon Creek Complex
Hopedale Fractionation
Complex
Hopedale 1 – 2 – In Service
Hopedale 3 – In Service – 60,000 Bbl/d
Potential Future Capacity
Cadiz Complex
Seneca Complex
Seneca 1 - 4 - In Service
Ohio Condensate
Stabilization
Strategic Rationale
• Further aligns the largest core liquids-rich
resource base with the largest processing and
fractionation footprint in Appalachia
‒ Up to 11 additional processing plants
‒ 20,000 Bbl/d of capacity at Hopedale 3
fractionation facility with an option to invest in
future fractionation capacity
‒ Over $800 million project inventory through
2020 (net to AM), including ~$155 million
contribution upfront for processing and
fractionation infrastructure
• Fits with AM’s “full value chain organic growth”
strategy
‒ Long-term 100% fixed-fee revenues
‒ Significant MVCs on processing
‒ Full build out EBITDA multiple of 4x – 6x
‒ 15% – 18% IRR
• Improved visibility throughout vertical value
chain and ability to deploy “just-in-time” capital
supporting Antero Resources’ rich gas
development
‒ Pro forma for the JV, AM has $2.7 billion of
organic growth opportunities from 2017 –
2020 at attractive 4x – 6x investment to
EBITDA multiples
Sherwood Complex
Sherwood 1 - 6 - In Service – 1,200 MMcf/d
Sherwood 7 – 1Q17 – 200 MMcf/d
Sherwood 8 – 3Q17 – 200 MMcf/d
Sherwood 9 – 1Q18 – 200 MMcf/d
Sherwood 10- 11 – Potential – 400 MMcf/d
1. RigData as of 01/06/17. Rigs drilling in rich gas areas only.
2. New West Virginia site location still to be determined.
(1)
New Complex (2)
Future Processing
TBA 1 – 6 – Potential – 1,200 MMcf/d
Joint Venture Assets
JOINT VENTURE: PROCESSING ASSET SUMMARY
4
Joint Venture Processing AssetsSummary
• AM and MPLX have formed a 50/50 joint venture to invest
in Marcellus processing infrastructure
‒ The JV could construct up to 11 new 200 MMcf/d
processing plants at both Sherwood and a new location
in Tyler, Wetzel or Doddridge County to meet Antero’s
liquids-rich gas production growth profile
‒ All JV processing assets will be operated by MPLX
• Antero Resources is the anchor producer
‒ Long-term fixed-fee agreement with inflation protection
and significant minimum volume commitments
• Antero Midstream has released 195,000 gross
processable acres to the JV in Tyler, Wetzel and Ritchie
Counties, WV
‒ Over 2,100 undrilled locations and 29 Tcfe of net 3P
reserves dedicated to the JV(1)
• AM expects the JV to invest up to $1.3 billion(3) over the
next four years in processing infrastructure
‒ Net capital investment of up to $650 million over 4 years,
including ~$95 million contribution up front for processing
infrastructure under construction (three Sherwood plants)
‒ JV excludes NGL pipeline infrastructure as well as de-
ethanization facilities
Sherwood Complex
Sherwood 1 - 6 - In Service
Sherwood 7 – 1Q17
Sherwood 8 – 3Q17
Sherwood 9 – 1Q18
Sherwood 10- 11 – Potential
New Complex (2)
Future Processing
TBA 1 – 6 – Potential – 1,200 MMcf/d
JV Plants
195,000
Gross Acres
167,000
Gross Acres
1 2 3 4 5 6
7 8 9 10
= 200 MMcf/d of capacity
Note: RigData as of 01/06/17. Rigs drilling in rich gas areas only.
1. Antero undrilled 3P locations and 3P reserves at strip pricing as of 12/31/2016 with Btu greater than 1100.
2. New West Virginia site location still to be determined.
3. Antero Midstream management estimate.
Plants
10 11
1 2 3 4 5 6
(1)
Joint Venture Assets
JOINT VENTURE: FRACTIONATION ASSET SUMMARY
5
Joint Venture Fractionation AssetsSummary
JV Capacity
• AM and MPLX have formed a 50/50 joint venture to
invest in C3+ fractionation infrastructure in Appalachia
‒ JV will purchase 1/3 capacity up front in Hopedale 3
‒ Option to buy on similar terms additional fractionation
capacity with incremental C3+ production growth from
the JV processing facilities
‒ All JV fractionation assets will be operated by MPLX
• Antero Resources is the anchor producer, with
additional third party volumes
‒ Long-term fixed-fee agreement with inflation protection
‒ Long-term fixed-fee agreements with other established
Appalachian producers
• Strategic location with access to liquids pipelines
including Mariner East/Mariner West, TEPPCO, and
Cornerstone
• AM expects the JV to invest up to $300 million(1) over
the next four years in fractionation infrastructure at
Hopedale
‒ Antero Midstream net capital investment of up to $150
million over 4 years, including ~$60 million upon
closing for existing fractionation infrastructure
Mariner East
ATEX
Hopedale Fractionation Complex
Hopedale 1 – 2 – In Service
Hopedale 3 – In Service – 60,000 Bbl/d
Note: RigData as of 01/06/17. Rigs drilling in rich gas areas only.
1. Antero Midstream management estimate.
1 2 3
Potential
Future
Capacity
Plants
(1)
•Cornerstone and Utica build-out projects critical to delivery of natural gasoline to
Midwest refinery markets and Western Canada
•Exploring long-term butane-to-alkylate project to create additional
in-basin demand
•Supporting the next phase of NGL marketing with unit train deliveries
from the region
•Progressing infrastructure options to move propane to East Coast and
Gulf Coast markets
•Largest fully integrated de-ethanization system in the Marcellus and Utica shales
•Access to all major takeaway pipelines: ATEX, Mariner East and Mariner West
•Well-positioned to support development of potential steam crackers in Northeast
FOCUSED ON NGL SOLUTIONS
6
MPLX leads the development of infrastructure to process and fractionate Northeast NGLs as
well as to link NGL supply with market demand and enhance value for producers
Ethane
Propane
Natural
Gasoline
Butanes
Antero Midstream JV alignment with MPLX adds momentum to
the Northeast NGL infrastructure buildout
CREATING A DIVERSIFIED ASSET MIX IN THE NORTHEAST
7
Antero Midstream is creating a diversified organic midstream infrastructure business in the
Northeast that supports the long-term growth profile of the Marcellus and Utica shales
63%
35%
2%
Gathering
& Compression
Fresh Water
Delivery
Regional Gas
Pipeline
EBITDA
Contribution %
EBITDA
Contribution %
60%
24%
4%
10% 2%
Gathering
& CompressionFresh Water
Delivery
Processing
& Fractionation
JV
Regional Gas
Pipeline
Wastewater
Treatment
2016 (1) 2020E
1. Contribution % based on LTM EBITDA for twelve months ending September 30, 2016.
KEY ATTRIBUTES –PROCESSING & FRACTIONATION JV
8
• Aligns largest core liquids-rich resource base (AR) with the largest processing &
fractionation footprint (MPLX) in Appalachia
• JV secures over $800 million in organic project inventory for AM for 2017 to 2020 period
• JV processing volumes driven by AR production volumes
• JV fractionation volumes driven by both AR and third party producers
• Attractive expected mid to high-teens rates of return
• Diversifies AM’s investment portfolio and cash flow contribution mix
• Initial JV facilities in-service and cash flow producing in 1Q 2017
- Sherwood 7 processing and Hopedale 3 fractionation
• Accretive transaction for Antero Midstream
• Further strengthens long-term Antero relationship with MarkWest and now MPC/MPLX
(Baa3/BBB-) to facilitate Northeast NGL infrastructure buildout
$1.03
$1.33
$0.00
$0.50
$1.00
$1.50
$2.00
$2.50
$3.00
$3.50
2016E 2017E 2018E 2019E 2020E
Updated 2017 Guidance(2)
2017 GUIDANCE AND LONG TERM TARGETS
9
DCF Coverage: 1.30x – 1.45x > 1.25x
Distribution Growth(1):
$520 – $560 Peer Leading GrowthEBITDA ($MM):
$800
$2.7 Billion organic opportunity
set from 2017 – 2020Capital Expenditures ($MM):
2.0x – 2.5x Low 2-times rangeLeverage:
2018 - 2020 Long-Term Targets
1. Assumes midpoint of 2017 distribution growth guidance and long-term target. Future distributions subject to Board approval.
2. Per press release dated 2/6/2017.
Guidance
Long Term Targets
2016A
At IPO November (2014)
1. Excludes 173,000 gross acres dedicated to third parties for gathering and compression services.
2. Adjusted EBITDA attributable to the partnership for the twelve months ending September 30, 2014 and December 31, 2016. LTM EBITDA for period ending December 31, 2016 based on actuals
through September 30, 2016 and midpoint of preliminary unaudited results for the three months ended December 31, 2016, per information available to the Partnership as of the date of this offering.
3. For the three months ended September 30, 2016.
TRACK RECORD OF HIGH GROWTH
10
Distribution Per Unit: $0.17 (MQD) $0.28
Gross Dedicated
Acreage(1):
Low Pressure: 532 MMcf/d
Compression: 116 MMcf/d
High Pressure: 531 MMcf/d
Low Pressure: 1,431 MMcf/d
Compression: 777 MMcf/d
High Pressure: 1,351 MMcf/d
Throughput Volumes(3):
Current
$45 $404LTM EBITDA(2):
N/A 140 MBbl/d
Fresh Water Delivery
Volumes(3):
418,000 Gross Acres
+65%
+798%
+169%
+570%
+154%
+100%
528,000 Gross Acres
+26%
32 32 32
35 36
41
43
46
10
15
20
25
30
35
40
45
50
1Q15 2Q15 3Q15 4Q15 1Q16 2Q16 3Q16 4Q16
BarrelsofWaterPer
FootofLateral
11
AR Has Increased Proppant Load by Over 33% in the Marcellus and Utica
Pilot Testing Demonstrated
Improved Recoveries While
Maintaining Well Density
AR Advanced Marcellus Completion Designs Utilizing 38 to 45 Barrels of Water Per Lateral Foot, a 19% to 41% Increase
 New AR completion designs result in more water utilization driving higher AM fees, while increased proppant load generates
encouraging early results with potential long-term benefits to AM gathering throughput
ADVANCED COMPLETIONS DRIVE INCREASED WATER VOLUMES
1,182
1,030 1,005
1,281
1,382
1,590 1,661
2,035
-
500
1,000
1,500
2,000
2,500
1Q15 2Q15 3Q15 4Q15 1Q16 2Q16 3Q16 4Q16
SandPlacedPerFootof
Lateral
$7.1
$9.7 $12.3
41%
57%
75%
0%
20%
40%
60%
80%
100%
120%
$0.0
$5.0
$10.0
$15.0
$20.0
1.7
2.1
2.0
2.5
2.3
2.8
Pre-TaxROR
Pre-TaxPV-10
Pre-Tax PV-10 Pre-Tax ROR
$11.5
$15.0
$18.4
67%
93%
122%
0%
20%
40%
60%
80%
100%
120%
140%
$0.0
$5.0
$10.0
$15.0
$20.0
1.7
2.3
2.0
2.7
2.3
3.1
Pre-TaxPV-10
Pre-Tax PV-10 Pre-Tax ROR
121. See Appendix for SWE assumptions and 12/31/2016 pricing.
2. Assumes ethane rejection.
Highly-Rich Gas/Condensate(1)
Wellhead Bcf/1,000’:
Processed Bcfe/1,000’:
Antero expects to complete 114 wells in 2017 in the highly-rich gas regimes (fully dedicated to
AM) where 2016 advanced completions are tracking 2.0 Bcf/1,000’ of lateral
2.0
2.7
2.0
2.5
20 Planned 2017 Completions
IMPROVING MARCELLUS RETURNS
Wellhead Bcf/1,000’:
Processed Bcfe/1,000’:
Highly-Rich Gas(1)
94 Planned 2017 Completions
2016 Advanced
Completion
Results
13
LEADING APPALACHIA MIDSTREAM BUSINESS MODEL
Premier E&P Operator in Appalachia
High Growth Sponsor Drives AM
Throughput Growth
“Just-in-time” Non-Speculative
Capital Program
Opportunity to Build Out Northeast
Value Chain
~$1.0 Billion of AM Liquidity
100% Fixed Fee and Largest Firm
Transport and Hedge Portfolio
0
10
20
30
40
50
60
70
80
AR RRC EQT SWN CHX CNX GPOR COG RICE
(MBbl/d)
0
500
1,000
1,500
2,000
2,500
EQT AR CHK COG RRC SWN CNX
0
500
1,000
1,500
2,000
2,500
3,000
3,500
0
2,000
4,000
6,000
8,000
10,000
12,000
14,000
AR EQT RRC COG CNX CHK SWN
Top Producers in Appalachia (Net MMcfe/d) – 3Q 2016(1)(2)
Top 12 U.S. Natural Gas Producers (Net MMcf/d) – 3Q 2016(1)
Appalachian Producers by Proved Reserves (Bcfe) – YE 2015(1)(2) Appalachian Producers Net C2+ NGL Production (MBbl/d) – 3Q 2016(2)
1. Based on company filings and presentations. Excludes pro forma additions via acquisitions.
2. Appalachian only production and reserves where available.
3. Includes proved reserves categorized in “Northern Division” consisting of Utica Shale, Marcellus Shale and Powder River Basin.
(3)
14
Appalachian Peers
Largest Proved
Reserve Base In
Appalachia
)
) ) )
Top NGL producer
in Appalachia in
3Q ‘16
2nd Largest
Appalachian
Producer in
3Q ‘16
8th Largest Gas
Producer in U.S.
in 3Q ‘16
SPONSOR STRENGTH – LEADERSHIP IN APPALACHIAN BASIN
 Antero has the largest proved reserve base, largest core liquids-rich acreage position and is one of the largest producers in the Appalachian Basin and the U.S.
$198
$341
$434
$649
$1,164
$1,221
$1,400
$1,495
$0
$200
$400
$600
$800
$1,000
$1,200
$1,400
$1,600
2010 2011 2012 2013 2014 2015 2016E 2017E
-5,000
5,000
15,000
25,000
35,000
45,000
55,000
65,000
75,000
85,000
95,000
2010 2011 2012 2013 2014 2015 2016E 2017E
NGLs (C3+) Oil Ethane
5 246
6,436
23,051
48,298
73,000
51% Growth
Guidance
92,500
26.5% Growth
Guidance
1. Represents midpoint of updated 2017 production guidance of 20% to 25% per press release dated 1/4/2017.
2. Represents midpoint of updated long-term guidance of 20% to 22% per press release dated 1/4/2017.
3. Represents Bloomberg street consensus estimates as of 12/31/2016.
1,800
2,205
2,668
3,228
3,906
0
500
1,000
1,500
2,000
2,500
3,000
3,500
4,000
Marcellus Utica Guidance
30 124
239
522
1,007
1,493
0
50
100
150
200
2010 2011 2012 2013 2014 2015 2016E 2017E
Marcellus Utica Deferred Completions
19
38
60
114
131
110
22.5%
Growth
Guidance(1)
20% – 22% Growth
Target(2)
 Antero is in the unique position of sustaining growth and value creation through the price down cycle
Street
Consensus(3)
SPONSOR STRENGTH – GROWTH & MOMENTUM THROUGH
THE DOWN CYCLE
200
170
180181177
15
Average Net Daily Production (MMcfe/d) Average Net Daily Liquids Production (Bbl/d)
Operated Gross Wells Completed Consolidated EBITDAX ($MM)
Leading Appalachia Core Acreage Position
Antero has the largest core acreage position in Appalachia, particularly as it relates to
undeveloped acreage and is running 36% of the total rigs in liquids-rich core areas
591
575
397 388
332
288
259
234 234
200 200
171 155
-
100
200
300
400
500
600
AR P1 P2 P3 P4 P5 P6 P7 P8 P9 P10 P11 P12
Core Net Acres Dry
Core Net Acres Liquids-Rich
Developed Acreage Marker
AR has dominant
liquids-rich position
SPONSOR STRENGTH – LARGEST CORE ACREAGE POSITION
IN APPALACHIA
16Source: Core outlines based upon Antero geologic interpretation, well control and peer acreage positions based on investor presentations, news releases and 10-K/10-Qs. Rig information per RigData as of 12/31/2016.
Competitor leasehold positions analyzed include Ascent (private), CHK, CNX, COG, CVX, ECR, EQT, GPOR, NBL, RICE, RRC, SWN.
247
1,060
1,756
2,536
3,419
3,611 3,645
0
500
1,000
1,500
2,000
2,500
3,000
3,500
4,000
$1.50 $2.00 $2.50 $3.00 $3.50 $4.00 $4.00
Locations
Marcellus Rich Gas Marcellus Dry Gas Ohio Utica Rich Gas Ohio Utica Dry Gas
1. Marcellus and Utica 3P locations as of 1/31/2017. Categorized by breakeven price solving for a 20% BTAX ROR and assuming 50% of AM fees due to AR ownership of AM. Assumes strip pricing for oil which
averages $56.00/Bbl over the next five years and 50% of WTI for NGLs ($27/Bbl).
2. Includes 3,443 total core locations plus 202 non-core 3P locations , including 211 3P locations with laterals less than 4,000 feet.
17
Cumulative 3P Drilling Inventory – Breakeven Prices at 20% ROR (1)(2)
Marcellus Rich Gas
Marcellus Dry Gas
Ohio Utica Rich Gas
< << << <
<
Antero has a 15 year drilling inventory at $3.00 natural gas or less
at the 2017 development pace (170 completions), excluding 2,000 incremental
locations representing additional 15 Tcf risked resource
~70% of total locations
generate at least a 20% rate of
return at $3.00/Mcf Nymex
29% of total locations generate
at least a 20% rate of return at
$2.00/Mcf Nymex
8,253’8,062’8,177’8,607’8,630’9,1099,229’
Average Lateral Length
Ohio Utica Dry Gas
NYMEX Natural Gas Price ($/MMBtu)
SPONSOR STRENGTH – SUSTAINABLE INVENTORY OF LOW
BREAKEVEN PRICES
3.2
3.5
4.0
3.2
3.7
6.0
0.0
1.0
2.0
3.0
4.0
5.0
6.0
7.0
2014 2015 Q4 2016 Record
StagesperDay8,052
8,910 8,9038,543 8,575
9,221
(1,000)
1,000
3,000
5,000
7,000
9,000
11,000
2014 2015 Q4 2016 Record
LateralLength(feet)
29
24
12
9
29
31
13
0
5
10
15
20
25
30
35
40
45
2014 2015 Q4 2016 Record
DrillingDays
$1.34
$1.18
$0.84
$1.55
$1.36
$0.99
$0.00
$0.50
$1.00
$1.50
$2.00
2014 2015 Q4 2016
WellCostper1,000’ofLateral
($MM)
18
SPONSOR STRENGTH – AR’S CONTINUOUS OPERATING
IMPROVEMENT
Increasing Completion Stages per Day
Drilling Longer Laterals
Dramatic Decrease in Drilling Days
Declining Well Costs per 1,000’
Drilling longer laterals while
reducing drilling days by 60%
More efficient completions
(“zipper fracs”) are increasing
stages per day
Reducing well costs by ~35% since 2014
Continuing to be an industry
leader in drilling longer laterals
Driving drilling and completion efficiencies which continues to lower well costs
Record
Record
14,014
Record
10.0
32 33
46
35 34
39
0
10
20
30
40
50
2014 2015 Q4 2016
BarrelsofWaterPerFoot
1,165 1,163
2,035
1,267 1,298
1,802
-
400
800
1,200
1,600
2,000
2,400
2014 2015 Q4 2016
PoundsofProppantPerFoot
$0.88
$0.73
$0.41
$1.28
$0.94
$0.68
$0.00
$0.50
$1.00
$1.50
2014 2015 Q4 2016
F&DperMcfe
1. Based on statistics for wells completed within each respective period.
2. Ethane rejection assumed.
3. Current D&C cost per 1,000’ lateral divided by net EUR per 1,000’ lateral assuming 85% NRI in Marcellus and 81% NRI in Utica.
19
SPONSOR STRENGTH – AR’S DRAMATICALLY LOWER F&D COSTS
Increasing Water Per Foot
Much Lower F&D Cost per Mcfe(2)(3)
Increasing Proppant Per Foot
Increasing EUR per 1,000’ (Bcfe)(1)(2)
Higher proppant concentration has
contributed to higher recoveries
Higher proppant concentration
requires increased water usage
Since 2014, Antero has increased EURs by
33% in the Marcellus and 20% in the Utica
Bottom line: F&D costs per Mcfe have
declined by 52% in the Marcellus and
46% in the Utica since 2014
Enhanced completion designs have contributed to
improved recoveries (for AR) and volume throughput (for AM)
Record Record
562,555
1.8 1.9
2.4
2.9
1.5
1.8 1.8
0.0
0.5
1.0
1.5
2.0
2.5
3.0
2014 2015 Q4 2016
ProcessedEURper1,000'
ofLateral(Bcfe)
Record
170 190 190
255
0
50
100
150
200
250
300
2017E 2018E 2019E 2020E
Marcellus Rich Gas Marcellus Dry Gas Utica Rich Gas Ohio Utica Dry Gas
3,645 Locations 2,840 Locations
Expect to place >800 new
Marcellus and Ohio Utica
wells to sales by YE 2020
1. Marcellus and Utica 3P locations as of 12/31/2016 pro forma for recent acreage acquisitions. Excludes WV/PA Utica Dry locations.
Average Lateral
Length ~8,998 feet
20
CURRENT UNDRILLED 3P LOCATIONS BY BTU REGIME(1) ESTIMATED YE 2020 UNDRILLED 3P LOCATIONS
Antero plans to develop over 800 horizontal locations in the Marcellus and Ohio Utica
by the end of the decade while utilizing less than 25% of its current 3P drilling inventory
Planned Antero Well Completions by Year
Marcellus Rich Gas
Ohio Utica Rich Gas
Ohio Utica Dry Gas
Marcellus Dry Gas
6%
Ohio Utica Dry Gas
172 Locations11%
Utica Rich Gas
303 Locations
20%
Marcellus Dry Gas
562 Locations
63%
Marcellus Rich Gas
1,803 Locations
16%
Marcellus Dry Gas
572 Locations
64%
Marcellus Rich Gas
2,351 Locations
13%
Utica Rich Gas
469 Locations
7%
Ohio Utica Dry Gas
253 Locations
9,000’
ORGANIC GROWTH – MULTI-YEAR GROWTH ENGINE
77
125
140
186
105
89
64
113
97
105
140
0
20
40
60
80
100
120
140
160
180
200
36 41
116
222
358
454 435
478
606
658
777
0
200
400
600
800
1,000
1,200
126
266
531
908
1,134 1,197 1,216 1,195 1,222 1,253
1,351
0
200
400
600
800
1,000
1,200
1,400
1,600
1,800
2,000
331 386
532
738
935 965
1,038
1,124
1,303 1,353
1,431
0
200
400
600
800
1,000
1,200
1,400
1,600
1,800
2,000
Low Pressure Gathering (MMcf/d)
Compression (MMcf/d)
High Pressure Gathering (MMcf/d)
21Note: Y-O-Y growth based on 3Q’15 to 3Q’16.
ORGANIC GROWTH – HIGH GROWTH MIDSTREAM
THROUGHPUT
Fresh Water Delivery (MBbl/d)
Marcellus Utica
Marcellus Utica
Marcellus Utica
Marcellus Utica
ORGANIC GROWTH – DRIVES VALUE CREATION
22
• Organic growth strategy provides attractive
returns and project economics, while
avoiding the competitive acquisition market
and reliance on capital markets
• Industry leading organic growth story
– ~$2.4 billion in capital spent through
09/30/2016 on gathering and compression
and water assets
– $525 million in additional capital forecast
for the twelve-month period ending
12/31/17
– 4-year identified investment opportunity
set of $2.7 billion
Note: Precedent data per IHS Herold’s research and public filings.
1. Antero organic multiple calculated as gathering and compression and water capital expended through Q3 2016 divided by midpoint of 2017 EBITDA guidance of $500 to $550 million, assuming 12-15
month lag between capital incurred and full system utilization.
2. Selected gathering and compression drop down acquisitions since 1/1/2015. Drop down multiples are based on NTM EBITDA. Source: Barclays.
4.4x
13.3x
10.5x10.3x
10.0x10.0x
9.5x
9.0x9.0x9.0x8.8x8.8x8.7x
8.4x
7.8x
6.0x5.9x5.8x
5.0x
0.0x
1.0x
2.0x
3.0x
4.0x
5.0x
6.0x
7.0x
8.0x
9.0x
10.0x
11.0x
12.0x
13.0x
14.0x
Drop Down Multiple
(2)
Organic EBITDA Multiple vs. Precedent Drop Down Multiples
Median: 8.8x
Value creation for the AM unit holder =
Build at 4x to 7x EBITDA
vs.
Drop Down / Buy at 8x to 12x EBITDA
25%
15%
10%
25%
30%
15%
25%
15%
35%
25%
20%
35%
40%
25%
35%
18%
0%
5%
10%
15%
20%
25%
30%
35%
40%
45%
InternalRateofReturn
LP
Gathering
HP
Gathering Compression
Condensate
Gathering
Fresh Water
Delivery
Advanced
Wastewater
Treatment
Stonewall
Gathering
Pipeline
Processing/
Fractionation
Unlevered IRR Range: 25% - 35% 15% - 25% 10% - 20% 25% - 35% 30% - 40% 15% - 25% 25% - 35% 15% - 18%
Payout (Years): 2.5 - 4.0 3.5 - 4.5 4.0 - 6.5 2.0 - 3.5 2.0 - 3.0 6.0 - 8.0 2.0 - 3.5 5.0 - 6.0
Minimum Volume Commitments: N/A 75% 70% N/A Yes N/A 80% Yes
2017 Capex Total
Marcellus $655 $80 $60 $115 - $50 $75 - $275
Utica 145 45 10 40 - 25 25 - -
Total Capex $800 $125 $70 $155 $0 $75 $100 $0 $275
% of Capex 100% 16% 9% 19% 0% 9% 13% 0% 34%
Included in 2017 Budget: Marcellus &
Utica
Marcellus &
Utica
Marcellus &
Utica
Utica Marcellus &
Utica
Marcellus &
Utica
Marcellus Marcellus &
Utica
4-year identified
investment
opportunity set
$2.7 B 20% - 25% 8% - 13% 25% - 30% 0% 5% - 10% 3% - 5% 0% 25% - 30%
Additional In-hand
Opportunities:
Dry Utica
Upper Devonian
Dry Utica
Upper Devonian
Dry Utica
Upper Devonian
Utica Stabilization Dry Utica
Upper Devonian
Dry Utica
Upper Devonian
Third Party
Fractionation
23
Project Economics by Segment(1)
1. Based on management capex, operating cost and throughput assumptions by project.
Wtd. Avg. 21% IRR
ORGANIC GROWTH – ESTIMATED PROJECT ECONOMICS
BY SEGMENT
24
In-service 2017 Budget
HIGH VISIBILITY – PROJECTED MIDSTREAM BUILDOUT
Utica Marcellus
-
1,000,000
2,000,000
3,000,000
4,000,000
5,000,000
6,000,000
25
BBtu/d
Antero Resources Transportation Portfolio
• Antero Resources has built the largest firm transportation portfolio in Appalachian Basin with 4.85 BBtu/d by year end 2018
• Realized pricing in line with Nymex gas prices year-to-date in 2016, before hedges
2015 2016E 2017E 2018E
Favorable:
Chicago
MichCon
Gulf Coast
NYMEX
TCO
AR Increasing Access to Favorable Markets
Less
favorable:
TETCO M2
Dominion South
74%
26%
99%
1%
97%
3%
97%
3%
(Stonewall/WB) Mid-Atlantic/NYMEX
(Stonewall/TGP) Gulf Coast
(TCO) Appalachia or Gulf Coast
Appalachia
Appalachia
(REX/ANR/NGPL/MGT) Midwest
(ANR/Rover) Gulf Coast
MITIGATED COMMODITY RISK – FIRM TRANSPORTATION &
SALES PORTFOLIO
Gross Gas Production (BBtu/d)
2017 Production Guidance: 20% – 25%
2018 – 2020 Production Target: 20% – 22%(1)
1. Per press release dated 01/04/2017.
$0.00
$1.00
$2.00
$3.00
$4.00
$5.00
$6.00
($50)
$0
$50
$100
$150
$200
$250
$300
$MM
26
 Hedging is a key component of Antero’s business model which includes development of a large, repeatable drilling inventory
– Locks in higher returns in a low commodity price environment and reduces the amount of time for well payout, thereby
enhancing liquidity
 Antero has realized $2.7 billion of gains on commodity hedges since 2009
– Gains realized in 31 of last 32 quarters, or 97% of the quarters since 2009
● Based on Antero’s hedge position and strip pricing as of 12/31/2016, the unrealized commodity derivative value is $1.6 billion
● Significant additional hedge capacity remains under the credit facility hedging covenant for 2020 – 2022 period
Quarterly Realized Hedge Gains / (Losses)
Realized Hedge Gains
Projected Hedge Gains
NYMEX Natural Gas
Historical Spot Prices
($/MMBtu)
NYMEX Natural Gas
Futures Prices 12/31/16
3.4 Tcfe Hedged at
average price of
$3.63/MMBtu through
2022
Average Hedge Prices
($/MMBtu)
$3.35
$3.51
$3.91
$3.70 $3.66
$3.21
$1.6 Billion in
Projected Hedge
Gains Through 2022
Realized $2.7 Billion
in Hedge Gains
Since 2009
INTEGRAL TO BUSINESS MODEL
Regional Gas Pipeline – 15% Ownership
Miles Capacity In-Service
Stonewall Gathering
Pipeline(2)
67 1.4 Bcf/d Yes
1. Acquired by AM from AR for a $1.05 billion upfront payment and a $125 million earn out in each of 2019 and 2020.
2. Antero Midstream owns 15% ownership in Stonewall pipeline.
End
Users
End
Users
Gas Processing
Y-Grade Pipeline
Long-Haul Interstate
Pipeline
Inter
Connect
NGL Product
Pipelines
Fractionation
Compression
Low Pressure Gathering
Well Pad
Terminals
and
Storage
AM has option to participate
in terminaling and storage
projects offered to AR
AM Owned Assets
Condensate Gathering
Stabilization
End
Users
(Ethane, Propane,
Butane, etc.)
27
FULL MIDSTREAM VALUE CHAIN BUILDOUT
AM/MPLX JV Assets
Processing and fractionation infrastructure adds to AM’s full value chain model
AM Option Assets
2.0x
0.0x
0.5x
1.0x
1.5x
2.0x
2.5x
3.0x
3.5x
4.0x
Peer 1 Peer 2 Peer 3 Peer 4 Peer 5 Peer 6 Peer 7
NetDebt/LTMEBITDA
• $1.5 billion revolver in place to fund future growth capital
(5.0x Debt/EBITDA Cap)
• Liquidity of $999 million at 2/3/2017 based off $1,157
million revolver pro forma for 6.0 million unit offering on
2/6/2017 for gross proceeds of $198 million used to fund
$155 million MPLX JV payment
• Sponsor (NYSE: AR) has Ba2/BB corporate debt ratings
• AM corporate debt ratings also Ba2/BB
AM Liquidity (9/30/2016)
AM Peer Leverage Comparison(1)
($ in millions)
Revolver Capacity $1,157
Less: Borrowings (167)
Plus: Cash 9
Liquidity $999
1. As of 9/30/2016. Peers include TEP, EQM, WES, RMP, SHLX, DM, and CNNX.
2. Antero Midstream credit facility as of 2/3/2017 pro forma for 6.0 million unit offering on 2/6/2017 with gross proceeds of $198 million used to fund $155 million MPLX JV payment.
Financial Flexibility
28
STRONG FINANCIAL POSITION – SIGNIFICANT FINANCIAL
FLEXIBILITY
(2)
TOP TIER DISTRIBUTION GROWTH & HEALTHY COVERAGE
29
3 –Year Street Consensus Distribution Growth Rate and DCF Coverage(1)
1. Based on Bloomberg 2016-2018 Bloomberg consensus estimates as of 12/31/2016.
29% 29%
24% 23% 23% 22%
20%
19%
13%
12%
8%
>1.2x
1.5x
1.9x
1.4x
1.3x 1.2x
1.6x
1.5x
1.4x
1.3x
1.2x
0.0x
0.2x
0.4x
0.6x
0.8x
1.0x
1.2x
1.4x
1.6x
1.8x
2.0x
0%
5%
10%
15%
20%
25%
30%
35%
40%
AM Target SHLX VLP PSXP DM TEP RMP EQM CNNX MPLX WES
Distribution Growth DCF Coverage Ratio
Antero Midstream (NYSE: AM)
Asset Overview
30
31
Gathering and Compression Assets
ANTERO MIDSTREAM GATHERING AND COMPRESSION
ASSET OVERVIEW
1. Based on 2016 capital budget.
2. Includes both expansion capital and maintenance capital.
• Gathering and compression assets in core of rapidly
growing Marcellus and Utica Shale plays
– Acreage dedication of ~528,000 gross leasehold
acres for gathering and compression services
– Additional stacked pay potential with dedication on
~278,000 gross acres of Utica deep rights
underlying the Marcellus in WV and PA
– 100% fixed fee long term contracts
Projected Gathering and Compression Infrastructure
Marcellus
Shale
Utica
Shale Total
YE 2016E Cumulative Gathering/
Compression Capex ($MM)(1) $1,216 $482 $1,698
Gathering Pipelines
(Miles) 213 94 307
Compression Capacity
(MMcf/d) 1,015 120 1,135
Condensate Gathering Pipelines
(Miles) - 19 19
2017E Gathering/Compression
Capex Budget ($MM)(2) $255 $95 $350
Gathering Pipelines
(Miles) 30 5 35
Compression Capacity
(MMcf/d) 490 - 490
ANTERO MIDSTREAM ASSETS – RICH GAS MARCELLUS
• Provides Marcellus gathering and compression
services
− Liquids-rich gas is delivered to MPLX’s 1.2
Bcf/d Sherwood processing complex
• Significant growth projected over the next twelve
months as set out below:
• Antero plans to operate an average of four drilling
rigs in the Marcellus Shale during 2017, including
intermediate rigs
• Antero plans to complete 135 Marcellus wells, 113
of which are located on AM dedicated acreage
− AM dedicated acreage contains over 2,000
gross undeveloped Marcellus locations
• Antero 2017 development plan averages nine wells
per pad, improving economics at AM
Marcellus Gathering & Compression
Note: Antero acreage position reflects tax districts in which greater than 3,000 net acres are owned.
YE 2016 YE 2017E
Low Pressure Gathering
Pipelines (Miles)
115 126
High Pressure Gathering
Pipelines (Miles)
98 117
Compression Capacity
(MMcf/d)
1,015 1,505
Acquisition Acreage
32
• Provides Utica gathering and compression services
− Liquids-rich gas delivered into MPLX’s 800 MMcf/d
Seneca processing complex
− Condensate delivered to centralized stabilization
and truck loading facilities
• Significant growth projected over the next twelve
months as set out below:
• Antero plans to operate an average of three drilling rigs
in the Utica Shale during 2017, including intermediate
rigs
• All 35 gross wells targeted to be completed in 2016 are
on Antero Midstream’s footprint
• Antero 2017 development program plan averages six
wells per pad
Utica Gathering & Compression
Note: Antero acreage position reflects tax districts in which greater than 3,000 net acres are owned.
ANTERO MIDSTREAM ASSETS – RICH & DRY GAS UTICA
YE 2016 YE 2017E
Low Pressure Gathering
Pipelines (Miles)
58 63
High Pressure Gathering
Pipelines (Miles)
36 36
Condensate Pipelines (Miles) 19 19
Compression Capacity
(MMcf/d)
120 120
33
ANTERO MIDSTREAM WATER BUSINESS OVERVIEW
34
Water Business Assets
 AM acquired AR’s integrated water business for $1.05 billion plus earn out payments of $125 million at year-end in each of 2019 and 2020
− The acquired business includes Antero’s Marcellus and Utica freshwater delivery business, the fully-contracted future advanced wastewater
treatment complex and all fluid handling and disposal services for Antero
• Fresh water delivery assets provide fresh water to support
Marcellus and Utica well completions
– Year-round water supply sources: Clearwater Facility, Ohio
River, local rivers & reservoirs(2)
– 100% fixed fee long term contracts
Note: Antero acreage position reflects tax districts in which greater than 3,000 net acres are owned.
1. All Antero water withdrawal sites are fully permitted under long-term state regulatory permits both in WV and OH.
2. Based on 2016 capital budget.
3. Marcellus assumes fee of $3.69 per barrel subject to annual inflation and 40 barrels of water per lateral foot that utilize the fresh water delivery system based on 9,000 foot lateral. Operating margin
excludes G&A. Utica assumes fee of $3.64 per barrel subject to annual inflation and 37 barrels of water per lateral foot that utilize the fresh water delivery system based on 9,000 foot lateral. Water volumes
assume 5% recycling. Operating margin excludes G&A.
Antero Clearwater advanced wastewater treatment
facility currently under construction – connects to
Antero freshwater delivery system
Projected Water Business Infrastructure(1)
Marcellus
Shale
Utica
Shale Total
YE 2016E Cumulative Fresh Water
Delivery Capex ($MM) (2) $509 $72 $581
Water Pipelines
(Miles) 203 83 286
Fresh Water Storage
Impoundments 23 13 36
2017E Fresh Water Delivery Capex
Budget ($MM) $50 $25 $75
Water Pipelines
(Miles) 28 9 37
Fresh Water Storage
Impoundments 3 1 4
Cash Operating
Margin per Well(3)
$1.0MM -
$1.1MM
$925k -
$975k
2017E Advanced Waste Water
Treatment Budget ($MM) $100
2017E Total Water Business
Budget ($MM) $175
0
10,000
20,000
30,000
40,000
50,000
60,000
70,000
80,000
Antero Clearwater Advanced Wastewater Treatment Capacity (Bbl/d)
Produced/Flowback Volumes (Bbl/d)
Illustrative Produced & Flowback Water VolumesAdvanced Wastewater Treatment
Antero Produced Water Services and Freshwater Delivery Business
Antero Advanced
Wastewater Treatment
3rd Party Recycling
and Well Disposal
(Bbl/d)
Advanced Wastewater Treatment Complex
Estimated capital expenditures ($ million)(1) ~$275
Standalone EBITDA at 100% utilization(2) ~$55 – $65
Implied investment to standalone EBITDA build-out multiple ~4x – 5x
Estimated per well savings to Antero Resources ~$150,000
Estimated in-service date Late 2017
Operating capacity (Bbl/d) 60,000
Operating agreement
• Antero has contracted with Veolia to build the largest advanced wastewater treatment complex in the world for oil and gas produced water
• Veolia will build and operate, and Antero will fund and own the
Clearwater facility
− Will treat and recycle AR produced and flowback water
− Creates additional year-round water source for completions
− Will have capacity for significant third party business
1. Includes capital to construct pipeline to connect facility to freshwater delivery system. Includes $10 million that AR agreed to fund in the drop down transaction.
2. Standalone EBITDA projection assumes inter-company fixed fee for recycling of $4.00 per barrel and 60,000 barrels per day of capacity. Does not include potential sales of marketable byproducts.
20 Years, Extendable
Integrated Water Business
Antero Advanced
Wastewater Treatment
Freshwater delivery system
Flowback and
produced
Water
Well Pad
Well Pad
Completion
Operations
Producing
Freshwater
Salt
Calcium Chloride
Marketable byproduct
Marketable byproduct used in oil
and gas operations
Freshwater delivery system
ANTERO MIDSTREAM ADVANCED WASTEWATER TREATMENT
ASSET OVERVIEW
Capacity for third party
business
35
AM UPSIDE OPPORTUNITY SET
36
ACTIVITY CURRENTLY DEDICATED TO AM
Third Party Business
Transportation and Marketing
• Opportunity to expand fresh water, waste water and
gathering/compression services to third parties in Marcellus
and Utica to enhance asset utilization
• AR must request a bid from AM and can only reject if third
party service fees are lower. AM has right to match
lower fee offer.
WV/PA Utica Dry Gas
• 247,000 gross acres of AR Utica dry gas acreage underlying
the Marcellus in West Virginia and Pennsylvania dedicated
to AM
• AR has drilled and completed its first WV Utica well
AR Acreage Consolidation
• Future acreage acquisitions by AR are dedicated to AM for
gathering, compression, processing and water services
(excluding existing third-party and/or JV dedications)
Low Cost
Marcellus/Utica Focus
“Best-in-Class”
Distribution Growth
37
CATALYSTS
• 30% for 2016 and 28% to 30% through 2020 targeted based on
sponsor targeted production CAGR of 20% to 22% through 2020
• AM sponsor is the most active operator in Appalachia; 20% - 25%
production growth guidance for 2017 supported by $1.5 billion
capital budget, firm processing and takeaway, long-term natural gas
hedges and $4.1 billion of liquidity
• AR targeting 20% to 22% production CAGR through 2020
• Sponsor operations target two of the lowest cost shale plays in
North America
• Attractive well economics support continued drilling at current prices
• $2.7 billion of capital investment opportunities from 2017 – 2020;
additional third party business expansion opportunities
Appalachian Basin
Midstream Growth
High Growth Sponsor
Production Profile
1
2
3
4
5
6
• Acquisition of integrated water business from AR expected to result
in distributable cash flow per unit accretion in 2017+
Consolidation and
Stacked Pay
Upside
• AR plans to continue to consolidate Marcellus/Utica acreage
• Development of Utica Shale Dry Gas resource will provide further
midstream infrastructure expansion opportunities
Integrated Water
Business Drop Down
7
• Established key partnership with MPLX to expand AM’s full value
chain organic growth strategy and enhance long-term distribution
growth
Processing &
Fractionation Joint
Venture
APPENDIX
38
Key Variable
2017 Previous
Guidance
2017 Updated
Guidance(1)
Financial:
Net Income ($MM) $295 – $335 $305 – $345
Adjusted EBITDA ($MM) $510 – $550 $520 – $560
Distributable Cash Flow ($MM) $395 – $435 $405 – $445
Year-over-Year Distribution Growth 28% – 30% 28% – 30%
DCF Coverage Ratio 1.30x – 1.45x 1.30x – 1.45x
Operating:
Gathering Pipelines (Miles) 35 35
Compression Capacity Added (MMcf/d) 490 490
Fresh Water Pipeline Added (Miles) 37 37
Fresh Water Impoundments 4 4
Capital Expenditures ($MM):
Gathering and Compression Infrastructure $350 $350
Fresh Water Infrastructure $75 $75
Advanced Wastewater Treatment $100 $100
Processing and Fractionation Joint Venture – $275
Total Capital Expenditures ($MM) $525 $800
ANTERO MIDSTREAM – 2017 GUIDANCE
Key Operating & Financial Assumptions
391. Per press release dated 2/6/2017.
Liquid “non-E&P assets” of $5.3 Bn
significantly exceeds total debt of $3.7
billion pro forma for recent transactions
Pro Forma Liquidity
Antero Resources (NYSE:AR) Antero Midstream (NYSE:AM)
Pro Forma 9/30/2016 Debt(1) Liquid Non-E&P Assets 9/30/2016 Debt (1) Liquid Assets
Debt Type $MM
Credit facility $208
6.00% senior notes due 2020 -
5.375% senior notes due 2021 1,000
5.125% senior notes due 2022 1,100
5.625% senior notes due 2023 750
5.00% senior notes due 2025 600
Total $3,658
Asset Type $MM
Commodity derivatives(2) $1,600
AM equity ownership(3) 3,691
Cash 10
Total $5,301
Asset Type $MM
Cash $10
Credit facility – commitments(4) 4,000
Credit facility – drawn (208)
Credit facility – letters of credit (709)
Total $3,093
Debt Type $MM
Credit facility $167
5.375% senior notes due 2024 650
Total $817
Asset Type $MM
Cash $9
Total $9
Liquidity
Asset Type $MM
Cash $9
Credit facility – capacity 1,157
Credit facility – drawn (167)
Credit facility – letters of credit -
Total $999
Approximately $3.1 billion of liquidity at AR pro
forma for recent transactions plus an
additional $3.1 billion of AM units
Approximately $1.0 billion of liquidity at AM
following recent senior notes offering
40
Only 14% of AM credit facility capacity drawn following
recent $650 million senior notes offering
1. AR balance sheet data as of 9/30/2016. Antero Resources pro forma for $175 million private placement on 10/3/2016, $170 million AR acreage divestiture closed on 12/16/2016 and $600 million 5.00%
AR senior note offering closed on 12/21/2016 to refinance $525 million 6% senior notes due 2020 callable at 103% and including transaction expenses. Antero Midstream credit facility as of 2/3/2017 pro
forma for 6.0 million unit offering on 2/6/2017 with gross proceeds of $198 million used to fund $155 million MPLX JV payment.
2. Mark-to-market as of 12/31/2016.
3. Based on AR ownership of AM units and closing price as of 2/6/2017.
4. AR credit facility commitments of $4.0 billion, borrowing base of $4.75 billion.
STRONG BALANCE SHEET AND HIGH FLEXIBILITY
2017 CAPITAL BUDGET
By Area
41
$480 Million – 2016
By Segment ($MM)
By Area
$800 Million – 2017
By Segment ($MM)
 Antero Midstream’s 2017 capital budget is $800 million, a 67% increase from the 2016 capital budget of $480 million, including
$275 for the processing and fractionation JV announced on 2/6/2017
130 Completions
$255
53%
$50
11%
$130
27%
$45
9%
Gathering and
Compression
Fresh Water
Advanced
Wastewater
Treatment
Stonewall
Marcellus
$456
95%
Utica
$24
5%
$350
44%
$75
9%
$100
13%
$275
34%
Marcellus
$680
85%
Utica
$120
15%
Advanced
Wastewater
Treatment
Fresh Water
Gathering and
Compression
Processing and
Fractionation
Antero Long Term Firm Processing & Takeaway Position (YE 2018) – Accessing Favorable Markets
Mariner East 2
62 MBbl/d Commitment
Marcus Hook Export
Shell
30 MBbl/d Commitment
Beaver County Cracker (2)
Sabine Pass (Trains 1-4)
50 MMcf/d per Train
(T1 and T2 in-service)
Lake Charles LNG(3)
150 MMcf/d
Freeport LNG
70 MMcf/d
1. February 2017 and full year 2017 futures basis, respectively, provided by Intercontinental Exchange dated 12/30/2016. Favorable markets shaded in green.
2. Shell announced final investment decision (FID) on 6/7/2016.
3. Lake Charles LNG 150 MMcf/d commitment subject to Shell FID.
Chicago(1)
$0.17 /
$(0.04)
CGTLA(1)
$(0.10) /
$(0.09)
TCO(1)
$(0.23) /
$(0.24)
42
Cove Point LNG4.85 Bcf/d
Firm Gas
Takeaway
By YE 2018
YE 2018 Gas Market Mix
Antero 4.85 Bcf/d FT
44%
Gulf Coast
17%
Midwest
13%
Atlantic
Seaboard
13%
Dom S/TETCO
(PA)
13%
TCO
Expect
NYMEX-plus
pricing per
Mcf
Antero Commitments
(3)
(2)
Dom
South(1)
$(0.57) /
$(1.19)
LARGEST FT PORTFOLIO IN NORTHEAST
KEY APPALACHIAN TAKEAWAY PROJECTS
TranscoAtlanticSunrise–
Mid-2018(1.7Bcf/d)
4.8 Bcf/d
5.9 Bcf/d
3.5 Bcf/d
1.8 Bcf/d
Antero
Producing
Areas
Source: Public filings and press releases. Excludes TETCO expansions.
1. 1.05 Bcf/d capacity available to move gas from Leach to the Gulf on CGT Rayne Xpress.
2. 860 MMcf/d of capacity available on CGT Gulf Xpress to move gas to the Gulf Coast markets.
Antero firm transportation commitment
Based on current publicly disclosed in-service dates, by the end of 2019, nine major incremental
projects are expected to be in service, resulting in new takeaway capacity of nearly 17 Bcf/d
Not included on Map
TETCO Expansion (972 MMcf/d)
43
3,250
3,972
1,700
1,750
4,660
1,500 16,832
0
2,000
4,000
6,000
8,000
10,000
12,000
14,000
16,000
18,000
(2Q 2017) (4Q 2017) (2Q 2018) (2H 2018) (4Q 2018) (4Q 2019) Total Incremental
Capacity
MMcf/d
700 MMcf/d
44
KEY APPALACHIAN NEW TAKEAWAY PROJECTS:
UNLOCKING THE NORTHEAST
Nexus
(1,500)
TETCO Expansion
(972)
Leach
Xpress/CGT
Rayne (1,500)
PennEast
(1,100)
Mountaineer/ CGT
Gulf Xpress
(2,660)
Mountain Valley
(2,000)
Atlantic
Sunrise
Rover
Atlantic Coast
3Q 2017
3.3
4Q 2017
7.2
2Q 2018
8.9
2H 2018
10.7
4Q 2018
15.3
4Q 2019
16.8
Total
Constitution (650)
Cumulative
Capacity
(Bcf/d)
Total New
Incremental
FT Capacity
by Year-End
2019
By year-end 2019, an incremental
16.8 Bcf/day of new takeaway
capacity is expected to be in service
in Appalachia
16.8
800 MMcf/d
Ethane – In service
Ethane – Proposed
C3+ NGLs – In service
C3+ NGLs – Proposed
45
NORTHEAST TAKEAWAY ACCESSES ALL MAJOR NGL MARKETS
Note: Project capacities and in-service date per latest Company estimates.
More NGL infrastructure to be built to support growing liquids production in Appalachia
presents additional opportunities for downstream investment
132
96 MVC
90
MVC
100
MVC
120
MVC
120
0
20
40
60
80
100
120
140
160
180
200
2014 2015 2016 2017 2018 2019 2020
MBbl/d
SUSTAINABLE WATER BUSINESS GROWTH
46
Long-term production growth drives substantial water business growth in 2017 and
beyond, underpinned by minimum volume commitments
177Completions
~110Completions
(Guidance)
2020 Earn Out – 200 MBbl/d Avg
131Completions
~170Completions
(Guidance)
Fresh Water Delivery Volumes (MBbl/d)
“Traditional” Completions “Advanced” Completions
utilizing 25% more water
2019 Earn Out – 161 MBbl/d Avg
LTM Production
NTM Production Forecast
Average LTM Production
MAINTENANCE CAPITAL METHODOLOGY
• Maintenance Capital Calculation Methodology – Low Pressure Gathering
– Estimate the number of new well connections needed during the forecast period in order to offset the natural production
decline and maintain the average throughput volume on our system over the LTM period
– (1) Compare this number of well connections to the total number of well connections estimated to be made during such
period, and
– (2) Designate an equal percentage of our estimated low pressure gathering capital expenditures as maintenance capital
expenditures
Maintenance capital expenditures are cash expenditures (including expenditures for the
construction or development of new capital assets or the replacement, improvement or expansion
of existing capital assets) made to maintain, over the long term, our operating capacity or revenue
• Illustrative Example
LTM Forecast Period
Decline of LTM
average throughput
to be replaced with
production volume
from new well
connections
47
• Maintenance Capital Calculation Methodology – Fresh Water Distribution
− Estimate the number of wells to which we would need to distribute fresh water during the forecast period in order to maintain
the average fresh water throughput volume on our system over the LTM period
− (1) Compare this number of wells to the total number of new wells to which we expect to distribute fresh water during such
period, and
− (2) Designate an equal percentage of our estimated water line capital expenditures as maintenance capital expenditures
ANTERO RESOURCES EBITDAX RECONCILIATION
48
EBITDAX Reconciliation
($ in millions) Quarter Ended LTM Ended
9/30/2016 9/30/2016
EBITDAX:
Net income including noncontrolling interest $268.2 $(121.1)
Commodity derivative fair value (gains) (530.4) (670.7)
Net cash receipts on settled derivatives instruments 196.7 1,083.5
Interest expense 59.8 246.1
Income tax expense (benefit) 140.9 (153.6)
Depreciation, depletion, amortization and accretion 199.7 752.1
Impairment of unproved properties 11.8 107.9
Exploration expense 1.2 4.0
Equity-based compensation expense 26.4 94.3
Equity in earnings of unconsolidated affiliate (1.5) (2.0)
Contract termination and rig stacking 0.0 27.6
Consolidated Adjusted EBITDAX $372.8 $1,368.1
ANTERO MIDSTREAM EBITDA RECONCILIATION
49
EBITDA and DCF Reconciliation
$ in thousands
Nine months ended
September 30,
2015 2016
Reconciliation of Net Income to Adjusted EBITDA and Distributable Cash Flow:
Net income $110,097 $163,352
Interest expense 5,266 12,885
Depreciation expense 63,515 74,100
Accretion of contingent acquisition consideration - 10,384
Equity-based compensation 17,663 19,366
Equity in earnings from unconsolidated affiliate - (2,027)
Adjusted EBITDA $196,541 $278,060
Pre-Water Acquisition net income attributed to parent (40,193) -
Pre-Water Acquisition depreciation expense attributed to parent (18,767) -
Pre-Water Acquisition equity-based compensation expense attributed to parent (3,445) -
Pre-Water Acquisition interest expense attributed to parent (2,326) -
Adjusted EBITDA attributable to the Partnership 131,810 278,060
Cash interest paid - attributable to Partnership (2,215) (11,751)
Cash reserved for payment of income tax witholding upon vesting of Antero Midstream LP equity-based
compensation awards - (3,000)
Cash to be received from unconsolidated affiliate - 2,998
Maintenance capital expenditures attributable to Partnership (10,001) (16,156)
Distributable Cash Flow $119,594 $250,151
CAUTIONARY NOTE
The SEC permits oil and gas companies, in their filings with the SEC, to disclose only proved, probable and possible reserve estimates
(collectively, “3P”). Antero has provided internally generated estimates for proved, probable and possible reserves in this presentation in
accordance with SEC guidelines and definitions, which have been audited by Antero’s third-party engineers. Unless otherwise noted,
reserve estimates as of December 31, 2016 assume ethane rejection and strip pricing.
Actual quantities that may be ultimately recovered from Antero’s interests may differ substantially from the estimates in this presentation.
Factors affecting ultimate recovery include the scope of Antero’s ongoing drilling program, which will be directly affected by commodity
prices, the availability of capital, drilling and production costs, availability of drilling services and equipment, drilling results, lease
expirations, transportation constraints, regulatory approvals and other factors, and actual drilling results, including geological and
mechanical factors affecting recovery rates.
In this presentation:
• “3P reserves” refer to Antero’s estimated aggregate proved, probable and possible reserves as of December 31, 2016. The SEC
prohibits companies from aggregating proved, probable and possible reserves in filings with the SEC due to the different levels of
certainty associated with each reserve category.
• “EUR,” or “Estimated Ultimate Recovery,” refers to Antero’s internal estimates of per well hydrocarbon quantities that may be
potentially recovered from a hypothetical future well completed as a producer in the area. These quantities do not necessarily
constitute or represent reserves within the meaning of the Society of Petroleum Engineer’s Petroleum Resource Management
System or the SEC’s oil and natural gas disclosure rules.
• “Condensate” refers to gas having a heat content between 1250 BTU and 1300 BTU in the Utica Shale.
• “Highly-rich gas/condensate” refers to gas having a heat content between 1275 BTU and 1350 BTU in the Marcellus Shale and 1225
BTU and 1250 BTU in the Utica Shale.
• “Highly-rich gas” refers to gas having a heat content between 1200 BTU and 1275 BTU in the Marcellus Shale and 1200 BTU and
1225 BTU in the Utica Shale.
• “Rich gas” refers to gas having a heat content of between 1100 BTU and 1200 BTU.
• “Dry gas” refers to gas containing insufficient quantities of hydrocarbons heavier than methane to allow their commercial extraction or
to require their removal in order to render the gas suitable for fuel use.
Regarding Hydrocarbon Quantities
50

More Related Content

What's hot

Am website presentation (b) january 2016
Am website presentation (b)   january 2016Am website presentation (b)   january 2016
Am website presentation (b) january 2016anteromidstream
 
Mlpa crestwood investor presentation_june 2016
Mlpa crestwood investor presentation_june 2016Mlpa crestwood investor presentation_june 2016
Mlpa crestwood investor presentation_june 2016CrestwoodCorporate
 
Company website presentation april 2016
Company website presentation   april 2016Company website presentation   april 2016
Company website presentation april 2016AnteroResources
 
Goldman Sachs Global Energy Conference
Goldman Sachs Global Energy ConferenceGoldman Sachs Global Energy Conference
Goldman Sachs Global Energy ConferenceAnteroResources
 
November 2016 corporate presentation final
November 2016 corporate presentation finalNovember 2016 corporate presentation final
November 2016 corporate presentation finalDenbury
 
Crestwood MLPA 2017 Annual Investor Conference Presentation
Crestwood MLPA 2017 Annual Investor Conference PresentationCrestwood MLPA 2017 Annual Investor Conference Presentation
Crestwood MLPA 2017 Annual Investor Conference PresentationCrestwoodCorporate
 
Crestwood strategic update april 2016
Crestwood strategic update april 2016Crestwood strategic update april 2016
Crestwood strategic update april 2016Joe Gold
 
Investor presentation december 2015 v final
Investor presentation december 2015 v finalInvestor presentation december 2015 v final
Investor presentation december 2015 v finalCrestwoodCorporate
 
Am website presentation (a) may 2016
Am website presentation (a)   may 2016Am website presentation (a)   may 2016
Am website presentation (a) may 2016anteromidstream
 
Company website presentation (b) september 2016
Company website presentation (b)   september 2016Company website presentation (b)   september 2016
Company website presentation (b) september 2016AnteroResources
 
Arex 1 q16 results presentation
Arex 1 q16 results presentationArex 1 q16 results presentation
Arex 1 q16 results presentationApproachResources
 
Investor presentation march 2016
Investor presentation march 2016Investor presentation march 2016
Investor presentation march 2016CrestwoodCorporate
 
Company website presentation march 2016
Company website presentation   march 2016Company website presentation   march 2016
Company website presentation march 2016AnteroResources
 
National Fuel Gas Company Earnings Slides - Nov 2016
National Fuel Gas Company Earnings Slides - Nov 2016National Fuel Gas Company Earnings Slides - Nov 2016
National Fuel Gas Company Earnings Slides - Nov 2016Marcellus Drilling News
 
2017 credit suisse final
2017 credit suisse final2017 credit suisse final
2017 credit suisse finalDenbury
 

What's hot (20)

Am website presentation (b) january 2016
Am website presentation (b)   january 2016Am website presentation (b)   january 2016
Am website presentation (b) january 2016
 
Mlpa crestwood investor presentation_june 2016
Mlpa crestwood investor presentation_june 2016Mlpa crestwood investor presentation_june 2016
Mlpa crestwood investor presentation_june 2016
 
Company website presentation april 2016
Company website presentation   april 2016Company website presentation   april 2016
Company website presentation april 2016
 
Goldman Sachs Global Energy Conference
Goldman Sachs Global Energy ConferenceGoldman Sachs Global Energy Conference
Goldman Sachs Global Energy Conference
 
CHK 2016 Analyst Day
CHK 2016 Analyst DayCHK 2016 Analyst Day
CHK 2016 Analyst Day
 
November 2016 corporate presentation final
November 2016 corporate presentation finalNovember 2016 corporate presentation final
November 2016 corporate presentation final
 
Johnson Rice Energy Conference
Johnson Rice Energy ConferenceJohnson Rice Energy Conference
Johnson Rice Energy Conference
 
Crestwood MLPA 2017 Annual Investor Conference Presentation
Crestwood MLPA 2017 Annual Investor Conference PresentationCrestwood MLPA 2017 Annual Investor Conference Presentation
Crestwood MLPA 2017 Annual Investor Conference Presentation
 
Barclays CEO Energy Conference
Barclays CEO Energy ConferenceBarclays CEO Energy Conference
Barclays CEO Energy Conference
 
Crestwood strategic update april 2016
Crestwood strategic update april 2016Crestwood strategic update april 2016
Crestwood strategic update april 2016
 
Scotia Howard Weil Energy Conference
Scotia Howard Weil Energy ConferenceScotia Howard Weil Energy Conference
Scotia Howard Weil Energy Conference
 
Investor presentation december 2015 v final
Investor presentation december 2015 v finalInvestor presentation december 2015 v final
Investor presentation december 2015 v final
 
Am website presentation (a) may 2016
Am website presentation (a)   may 2016Am website presentation (a)   may 2016
Am website presentation (a) may 2016
 
Company website presentation (b) september 2016
Company website presentation (b)   september 2016Company website presentation (b)   september 2016
Company website presentation (b) september 2016
 
Arex 1 q16 results presentation
Arex 1 q16 results presentationArex 1 q16 results presentation
Arex 1 q16 results presentation
 
Investor presentation march 2016
Investor presentation march 2016Investor presentation march 2016
Investor presentation march 2016
 
CHK 2018 Q2 Earnings
CHK 2018 Q2 EarningsCHK 2018 Q2 Earnings
CHK 2018 Q2 Earnings
 
Company website presentation march 2016
Company website presentation   march 2016Company website presentation   march 2016
Company website presentation march 2016
 
National Fuel Gas Company Earnings Slides - Nov 2016
National Fuel Gas Company Earnings Slides - Nov 2016National Fuel Gas Company Earnings Slides - Nov 2016
National Fuel Gas Company Earnings Slides - Nov 2016
 
2017 credit suisse final
2017 credit suisse final2017 credit suisse final
2017 credit suisse final
 

Viewers also liked

Am website presentation march 2017
Am website presentation   march 2017Am website presentation   march 2017
Am website presentation march 2017anteromidstream
 
Company website presentation december 2016
Company website presentation   december 2016Company website presentation   december 2016
Company website presentation december 2016AnteroResources
 
Company website presentation (a) september 2016
Company website presentation (a)   september 2016Company website presentation (a)   september 2016
Company website presentation (a) september 2016AnteroResources
 
Company website presentation november 2016
Company website presentation   november 2016Company website presentation   november 2016
Company website presentation november 2016AnteroResources
 
Company website presentation (b) october 2016
Company website presentation (b)   october 2016Company website presentation (b)   october 2016
Company website presentation (b) october 2016AnteroResources
 
Company website presentation july 2016
Company website presentation   july 2016Company website presentation   july 2016
Company website presentation july 2016AnteroResources
 
Barclays conference presentation (website) september 2016 v5
Barclays conference presentation (website)   september 2016 v5Barclays conference presentation (website)   september 2016 v5
Barclays conference presentation (website) september 2016 v5AnteroResources
 
Аналітична характеристика сертифікаційних робіт та методичні рекомендації щод...
Аналітична характеристика сертифікаційних робіт та методичні рекомендації щод...Аналітична характеристика сертифікаційних робіт та методичні рекомендації щод...
Аналітична характеристика сертифікаційних робіт та методичні рекомендації щод...Андрій Лубенець
 
Company website presentation (a) february 2017
Company website presentation (a)   february 2017Company website presentation (a)   february 2017
Company website presentation (a) february 2017AnteroResources
 
Company website presentation (a) december 2016
Company website presentation (a)   december 2016Company website presentation (a)   december 2016
Company website presentation (a) december 2016AnteroResources
 
Company website presentation (b) february 2017
Company website presentation (b)   february 2017Company website presentation (b)   february 2017
Company website presentation (b) february 2017AnteroResources
 
Credit suisse conference presentation february 2017 v-f
Credit suisse conference presentation   february 2017 v-fCredit suisse conference presentation   february 2017 v-f
Credit suisse conference presentation february 2017 v-fAnteroResources
 
Company website presentation february 2017
Company website presentation   february 2017Company website presentation   february 2017
Company website presentation february 2017AnteroResources
 
Company website presentation march 2017
Company website presentation   march 2017Company website presentation   march 2017
Company website presentation march 2017AnteroResources
 
2017 february corporate presentation final
2017 february corporate presentation  final2017 february corporate presentation  final
2017 february corporate presentation finalDenbury
 
Am website presentation (a) february 2017
Am website presentation (a)   february 2017Am website presentation (a)   february 2017
Am website presentation (a) february 2017anteromidstream
 
NAPTP MLP Conference May 20, 2015
NAPTP MLP Conference May 20, 2015NAPTP MLP Conference May 20, 2015
NAPTP MLP Conference May 20, 2015anteromidstream
 
Katietrailerstitles
KatietrailerstitlesKatietrailerstitles
Katietrailerstitlesbir
 

Viewers also liked (20)

Am website presentation march 2017
Am website presentation   march 2017Am website presentation   march 2017
Am website presentation march 2017
 
Company website presentation december 2016
Company website presentation   december 2016Company website presentation   december 2016
Company website presentation december 2016
 
Company website presentation (a) september 2016
Company website presentation (a)   september 2016Company website presentation (a)   september 2016
Company website presentation (a) september 2016
 
Company website presentation november 2016
Company website presentation   november 2016Company website presentation   november 2016
Company website presentation november 2016
 
Company website presentation (b) october 2016
Company website presentation (b)   october 2016Company website presentation (b)   october 2016
Company website presentation (b) october 2016
 
Company website presentation july 2016
Company website presentation   july 2016Company website presentation   july 2016
Company website presentation july 2016
 
Barclays conference presentation (website) september 2016 v5
Barclays conference presentation (website)   september 2016 v5Barclays conference presentation (website)   september 2016 v5
Barclays conference presentation (website) september 2016 v5
 
Аналітична характеристика сертифікаційних робіт та методичні рекомендації щод...
Аналітична характеристика сертифікаційних робіт та методичні рекомендації щод...Аналітична характеристика сертифікаційних робіт та методичні рекомендації щод...
Аналітична характеристика сертифікаційних робіт та методичні рекомендації щод...
 
Company website presentation (a) february 2017
Company website presentation (a)   february 2017Company website presentation (a)   february 2017
Company website presentation (a) february 2017
 
Company website presentation (a) december 2016
Company website presentation (a)   december 2016Company website presentation (a)   december 2016
Company website presentation (a) december 2016
 
Company website presentation (b) february 2017
Company website presentation (b)   february 2017Company website presentation (b)   february 2017
Company website presentation (b) february 2017
 
Credit suisse conference presentation february 2017 v-f
Credit suisse conference presentation   february 2017 v-fCredit suisse conference presentation   february 2017 v-f
Credit suisse conference presentation february 2017 v-f
 
Company website presentation february 2017
Company website presentation   february 2017Company website presentation   february 2017
Company website presentation february 2017
 
Company website presentation march 2017
Company website presentation   march 2017Company website presentation   march 2017
Company website presentation march 2017
 
2017 february corporate presentation final
2017 february corporate presentation  final2017 february corporate presentation  final
2017 february corporate presentation final
 
Eog 1116
Eog 1116Eog 1116
Eog 1116
 
Eog 0217
Eog 0217Eog 0217
Eog 0217
 
Am website presentation (a) february 2017
Am website presentation (a)   february 2017Am website presentation (a)   february 2017
Am website presentation (a) february 2017
 
NAPTP MLP Conference May 20, 2015
NAPTP MLP Conference May 20, 2015NAPTP MLP Conference May 20, 2015
NAPTP MLP Conference May 20, 2015
 
Katietrailerstitles
KatietrailerstitlesKatietrailerstitles
Katietrailerstitles
 

Similar to Am website presentation (c) february 2017

Am website presentation (b) february 2017
Am website presentation (b)   february 2017Am website presentation (b)   february 2017
Am website presentation (b) february 2017anteromidstream
 
Am website presentation april 2017
Am website presentation   april 2017Am website presentation   april 2017
Am website presentation april 2017anteromidstream
 
Howard weil conference presentation march 2017 v-f (small)
Howard weil conference presentation   march 2017 v-f (small)Howard weil conference presentation   march 2017 v-f (small)
Howard weil conference presentation march 2017 v-f (small)AnteroResources
 
Partnership Overview November 2014
Partnership Overview November 2014Partnership Overview November 2014
Partnership Overview November 2014anteromidstream
 
Partnership Overview March 2015
Partnership Overview March 2015Partnership Overview March 2015
Partnership Overview March 2015anteromidstream
 
Am website presentation january 2015
Am website presentation   january 2015Am website presentation   january 2015
Am website presentation january 2015anteromidstream
 
Am website presentation december 2014
Am website presentation   december 2014Am website presentation   december 2014
Am website presentation december 2014anteromidstream
 
Partnership Overview April 2015
Partnership Overview April 2015Partnership Overview April 2015
Partnership Overview April 2015anteromidstream
 
Am website presentation (a) june 2016
Am website presentation (a)   june 2016Am website presentation (a)   june 2016
Am website presentation (a) june 2016anteromidstream
 
Am website presentation (b) june 2016
Am website presentation (b)   june 2016Am website presentation (b)   june 2016
Am website presentation (b) june 2016anteromidstream
 
Am website presentation (c) june 2016
Am website presentation (c)   june 2016Am website presentation (c)   june 2016
Am website presentation (c) june 2016anteromidstream
 
Partnership Overview May 2015
Partnership Overview May 2015Partnership Overview May 2015
Partnership Overview May 2015anteromidstream
 
Am website presentation (a) april 2015
Am website presentation (a)   april 2015Am website presentation (a)   april 2015
Am website presentation (a) april 2015anteromidstream
 
Am website presentation (a) january 2015
Am website presentation (a)   january 2015Am website presentation (a)   january 2015
Am website presentation (a) january 2015anteromidstream
 
Am website presentation february 2015
Am website presentation   february 2015Am website presentation   february 2015
Am website presentation february 2015anteromidstream
 
Am website presentation march 2015
Am website presentation   march 2015Am website presentation   march 2015
Am website presentation march 2015anteromidstream
 
EnLink Midstream / Tall Oak Midstream Acquisition Investor Call
EnLink Midstream / Tall Oak Midstream Acquisition Investor CallEnLink Midstream / Tall Oak Midstream Acquisition Investor Call
EnLink Midstream / Tall Oak Midstream Acquisition Investor CallEnLinkMidstreamLLC
 
Am website presentation (a) april 2015
Am website presentation (a)   april 2015Am website presentation (a)   april 2015
Am website presentation (a) april 2015anteromidstream
 
Am website presentation december 2015
Am website presentation   december 2015Am website presentation   december 2015
Am website presentation december 2015anteromidstream
 
Am website presentation (b) january 2015
Am website presentation (b)   january 2015Am website presentation (b)   january 2015
Am website presentation (b) january 2015anteromidstream
 

Similar to Am website presentation (c) february 2017 (20)

Am website presentation (b) february 2017
Am website presentation (b)   february 2017Am website presentation (b)   february 2017
Am website presentation (b) february 2017
 
Am website presentation april 2017
Am website presentation   april 2017Am website presentation   april 2017
Am website presentation april 2017
 
Howard weil conference presentation march 2017 v-f (small)
Howard weil conference presentation   march 2017 v-f (small)Howard weil conference presentation   march 2017 v-f (small)
Howard weil conference presentation march 2017 v-f (small)
 
Partnership Overview November 2014
Partnership Overview November 2014Partnership Overview November 2014
Partnership Overview November 2014
 
Partnership Overview March 2015
Partnership Overview March 2015Partnership Overview March 2015
Partnership Overview March 2015
 
Am website presentation january 2015
Am website presentation   january 2015Am website presentation   january 2015
Am website presentation january 2015
 
Am website presentation december 2014
Am website presentation   december 2014Am website presentation   december 2014
Am website presentation december 2014
 
Partnership Overview April 2015
Partnership Overview April 2015Partnership Overview April 2015
Partnership Overview April 2015
 
Am website presentation (a) june 2016
Am website presentation (a)   june 2016Am website presentation (a)   june 2016
Am website presentation (a) june 2016
 
Am website presentation (b) june 2016
Am website presentation (b)   june 2016Am website presentation (b)   june 2016
Am website presentation (b) june 2016
 
Am website presentation (c) june 2016
Am website presentation (c)   june 2016Am website presentation (c)   june 2016
Am website presentation (c) june 2016
 
Partnership Overview May 2015
Partnership Overview May 2015Partnership Overview May 2015
Partnership Overview May 2015
 
Am website presentation (a) april 2015
Am website presentation (a)   april 2015Am website presentation (a)   april 2015
Am website presentation (a) april 2015
 
Am website presentation (a) january 2015
Am website presentation (a)   january 2015Am website presentation (a)   january 2015
Am website presentation (a) january 2015
 
Am website presentation february 2015
Am website presentation   february 2015Am website presentation   february 2015
Am website presentation february 2015
 
Am website presentation march 2015
Am website presentation   march 2015Am website presentation   march 2015
Am website presentation march 2015
 
EnLink Midstream / Tall Oak Midstream Acquisition Investor Call
EnLink Midstream / Tall Oak Midstream Acquisition Investor CallEnLink Midstream / Tall Oak Midstream Acquisition Investor Call
EnLink Midstream / Tall Oak Midstream Acquisition Investor Call
 
Am website presentation (a) april 2015
Am website presentation (a)   april 2015Am website presentation (a)   april 2015
Am website presentation (a) april 2015
 
Am website presentation december 2015
Am website presentation   december 2015Am website presentation   december 2015
Am website presentation december 2015
 
Am website presentation (b) january 2015
Am website presentation (b)   january 2015Am website presentation (b)   january 2015
Am website presentation (b) january 2015
 

More from anteromidstream

Antero Midstream Partnership Overview February 2017
Antero Midstream Partnership Overview February 2017Antero Midstream Partnership Overview February 2017
Antero Midstream Partnership Overview February 2017anteromidstream
 
Am website presentation (b) january 2017
Am website presentation (b)   january 2017Am website presentation (b)   january 2017
Am website presentation (b) january 2017anteromidstream
 
Am website presentation january 2017 v7
Am website presentation   january 2017 v7Am website presentation   january 2017 v7
Am website presentation january 2017 v7anteromidstream
 
Am website presentation (a) december 2016
Am website presentation (a)   december 2016Am website presentation (a)   december 2016
Am website presentation (a) december 2016anteromidstream
 
Am website presentation december 2016
Am website presentation   december 2016Am website presentation   december 2016
Am website presentation december 2016anteromidstream
 
Am website presentation november 2016
Am website presentation   november 2016Am website presentation   november 2016
Am website presentation november 2016anteromidstream
 
Am website presentation (a) october 2016
Am website presentation (a)   october 2016Am website presentation (a)   october 2016
Am website presentation (a) october 2016anteromidstream
 
Am website presentation october 2016
Am website presentation   october 2016Am website presentation   october 2016
Am website presentation october 2016anteromidstream
 
Am website presentation september 2016
Am website presentation   september 2016Am website presentation   september 2016
Am website presentation september 2016anteromidstream
 
Am website presentation (a) august 2016
Am website presentation (a)   august 2016Am website presentation (a)   august 2016
Am website presentation (a) august 2016anteromidstream
 
Am website presentation august 2016
Am website presentation   august 2016Am website presentation   august 2016
Am website presentation august 2016anteromidstream
 
Am website presentation (a) july 2016
Am website presentation (a)   july 2016Am website presentation (a)   july 2016
Am website presentation (a) july 2016anteromidstream
 
Am website presentation july 2016
Am website presentation   july 2016Am website presentation   july 2016
Am website presentation july 2016anteromidstream
 
Am website presentation june 2016
Am website presentation   june 2016Am website presentation   june 2016
Am website presentation june 2016anteromidstream
 
Am website presentation may 2016
Am website presentation   may 2016Am website presentation   may 2016
Am website presentation may 2016anteromidstream
 
Am website presentation April 2016
Am website presentation April 2016Am website presentation April 2016
Am website presentation April 2016anteromidstream
 
Am website presentation (a) march 2016
Am website presentation (a)   march 2016Am website presentation (a)   march 2016
Am website presentation (a) march 2016anteromidstream
 
Am website presentation (a) february 2016
Am website presentation (a)   february 2016Am website presentation (a)   february 2016
Am website presentation (a) february 2016anteromidstream
 
Am website presentation (a) february 2016
Am website presentation (a)   february 2016Am website presentation (a)   february 2016
Am website presentation (a) february 2016anteromidstream
 

More from anteromidstream (19)

Antero Midstream Partnership Overview February 2017
Antero Midstream Partnership Overview February 2017Antero Midstream Partnership Overview February 2017
Antero Midstream Partnership Overview February 2017
 
Am website presentation (b) january 2017
Am website presentation (b)   january 2017Am website presentation (b)   january 2017
Am website presentation (b) january 2017
 
Am website presentation january 2017 v7
Am website presentation   january 2017 v7Am website presentation   january 2017 v7
Am website presentation january 2017 v7
 
Am website presentation (a) december 2016
Am website presentation (a)   december 2016Am website presentation (a)   december 2016
Am website presentation (a) december 2016
 
Am website presentation december 2016
Am website presentation   december 2016Am website presentation   december 2016
Am website presentation december 2016
 
Am website presentation november 2016
Am website presentation   november 2016Am website presentation   november 2016
Am website presentation november 2016
 
Am website presentation (a) october 2016
Am website presentation (a)   october 2016Am website presentation (a)   october 2016
Am website presentation (a) october 2016
 
Am website presentation october 2016
Am website presentation   october 2016Am website presentation   october 2016
Am website presentation october 2016
 
Am website presentation september 2016
Am website presentation   september 2016Am website presentation   september 2016
Am website presentation september 2016
 
Am website presentation (a) august 2016
Am website presentation (a)   august 2016Am website presentation (a)   august 2016
Am website presentation (a) august 2016
 
Am website presentation august 2016
Am website presentation   august 2016Am website presentation   august 2016
Am website presentation august 2016
 
Am website presentation (a) july 2016
Am website presentation (a)   july 2016Am website presentation (a)   july 2016
Am website presentation (a) july 2016
 
Am website presentation july 2016
Am website presentation   july 2016Am website presentation   july 2016
Am website presentation july 2016
 
Am website presentation june 2016
Am website presentation   june 2016Am website presentation   june 2016
Am website presentation june 2016
 
Am website presentation may 2016
Am website presentation   may 2016Am website presentation   may 2016
Am website presentation may 2016
 
Am website presentation April 2016
Am website presentation April 2016Am website presentation April 2016
Am website presentation April 2016
 
Am website presentation (a) march 2016
Am website presentation (a)   march 2016Am website presentation (a)   march 2016
Am website presentation (a) march 2016
 
Am website presentation (a) february 2016
Am website presentation (a)   february 2016Am website presentation (a)   february 2016
Am website presentation (a) february 2016
 
Am website presentation (a) february 2016
Am website presentation (a)   february 2016Am website presentation (a)   february 2016
Am website presentation (a) february 2016
 

Recently uploaded

如何办理(UTS毕业证书)悉尼科技大学毕业证学位证书
如何办理(UTS毕业证书)悉尼科技大学毕业证学位证书如何办理(UTS毕业证书)悉尼科技大学毕业证学位证书
如何办理(UTS毕业证书)悉尼科技大学毕业证学位证书Fis s
 
VIP 7001035870 Find & Meet Hyderabad Call Girls Shamshabad high-profile Call ...
VIP 7001035870 Find & Meet Hyderabad Call Girls Shamshabad high-profile Call ...VIP 7001035870 Find & Meet Hyderabad Call Girls Shamshabad high-profile Call ...
VIP 7001035870 Find & Meet Hyderabad Call Girls Shamshabad high-profile Call ...aditipandeya
 
Collective Mining | Corporate Presentation - April 2024
Collective Mining | Corporate Presentation - April 2024Collective Mining | Corporate Presentation - April 2024
Collective Mining | Corporate Presentation - April 2024CollectiveMining1
 
Sustainability Leadership, April 26 2024
Sustainability Leadership, April 26 2024Sustainability Leadership, April 26 2024
Sustainability Leadership, April 26 2024TeckResourcesLtd
 
VIP 7001035870 Find & Meet Hyderabad Call Girls Abids high-profile Call Girl
VIP 7001035870 Find & Meet Hyderabad Call Girls Abids high-profile Call GirlVIP 7001035870 Find & Meet Hyderabad Call Girls Abids high-profile Call Girl
VIP 7001035870 Find & Meet Hyderabad Call Girls Abids high-profile Call Girladitipandeya
 
Cyberagent_For New Investors_EN_240424.pdf
Cyberagent_For New Investors_EN_240424.pdfCyberagent_For New Investors_EN_240424.pdf
Cyberagent_For New Investors_EN_240424.pdfCyberAgent, Inc.
 
Osisko Gold Royalties Ltd - Corporate Presentation, April 23, 2024
Osisko Gold Royalties Ltd - Corporate Presentation, April 23, 2024Osisko Gold Royalties Ltd - Corporate Presentation, April 23, 2024
Osisko Gold Royalties Ltd - Corporate Presentation, April 23, 2024Osisko Gold Royalties Ltd
 
Short-, Mid-, and Long-term gxxoals.pptx
Short-, Mid-, and Long-term gxxoals.pptxShort-, Mid-, and Long-term gxxoals.pptx
Short-, Mid-, and Long-term gxxoals.pptxHenryBriggs2
 
CALL ON ➥8923113531 🔝Call Girls Fazullaganj Lucknow best sexual service
CALL ON ➥8923113531 🔝Call Girls Fazullaganj Lucknow best sexual serviceCALL ON ➥8923113531 🔝Call Girls Fazullaganj Lucknow best sexual service
CALL ON ➥8923113531 🔝Call Girls Fazullaganj Lucknow best sexual serviceanilsa9823
 
VIP 7001035870 Find & Meet Hyderabad Call Girls Miyapur high-profile Call Girl
VIP 7001035870 Find & Meet Hyderabad Call Girls Miyapur high-profile Call GirlVIP 7001035870 Find & Meet Hyderabad Call Girls Miyapur high-profile Call Girl
VIP 7001035870 Find & Meet Hyderabad Call Girls Miyapur high-profile Call Girladitipandeya
 
Malad Escorts, (Pooja 09892124323), Malad Call Girls Service
Malad Escorts, (Pooja 09892124323), Malad Call Girls ServiceMalad Escorts, (Pooja 09892124323), Malad Call Girls Service
Malad Escorts, (Pooja 09892124323), Malad Call Girls ServicePooja Nehwal
 
VIP Call Girl Amritsar 7001035870 Enjoy Call Girls With Our Escorts
VIP Call Girl Amritsar 7001035870 Enjoy Call Girls With Our EscortsVIP Call Girl Amritsar 7001035870 Enjoy Call Girls With Our Escorts
VIP Call Girl Amritsar 7001035870 Enjoy Call Girls With Our Escortssonatiwari757
 
Q3 FY24 Earnings Conference Call Presentation
Q3 FY24 Earnings Conference Call PresentationQ3 FY24 Earnings Conference Call Presentation
Q3 FY24 Earnings Conference Call PresentationSysco_Investors
 
CALL ON ➥8923113531 🔝Call Girls Vineet Khand Lucknow best Night Fun service 🧦
CALL ON ➥8923113531 🔝Call Girls Vineet Khand Lucknow best Night Fun service  🧦CALL ON ➥8923113531 🔝Call Girls Vineet Khand Lucknow best Night Fun service  🧦
CALL ON ➥8923113531 🔝Call Girls Vineet Khand Lucknow best Night Fun service 🧦anilsa9823
 
Methanex Investor Presentation (April 2024)
Methanex Investor Presentation (April 2024)Methanex Investor Presentation (April 2024)
Methanex Investor Presentation (April 2024)Methanex Corporation
 

Recently uploaded (20)

如何办理(UTS毕业证书)悉尼科技大学毕业证学位证书
如何办理(UTS毕业证书)悉尼科技大学毕业证学位证书如何办理(UTS毕业证书)悉尼科技大学毕业证学位证书
如何办理(UTS毕业证书)悉尼科技大学毕业证学位证书
 
VIP 7001035870 Find & Meet Hyderabad Call Girls Shamshabad high-profile Call ...
VIP 7001035870 Find & Meet Hyderabad Call Girls Shamshabad high-profile Call ...VIP 7001035870 Find & Meet Hyderabad Call Girls Shamshabad high-profile Call ...
VIP 7001035870 Find & Meet Hyderabad Call Girls Shamshabad high-profile Call ...
 
Collective Mining | Corporate Presentation - April 2024
Collective Mining | Corporate Presentation - April 2024Collective Mining | Corporate Presentation - April 2024
Collective Mining | Corporate Presentation - April 2024
 
Sustainability Leadership, April 26 2024
Sustainability Leadership, April 26 2024Sustainability Leadership, April 26 2024
Sustainability Leadership, April 26 2024
 
VIP 7001035870 Find & Meet Hyderabad Call Girls Abids high-profile Call Girl
VIP 7001035870 Find & Meet Hyderabad Call Girls Abids high-profile Call GirlVIP 7001035870 Find & Meet Hyderabad Call Girls Abids high-profile Call Girl
VIP 7001035870 Find & Meet Hyderabad Call Girls Abids high-profile Call Girl
 
Cyberagent_For New Investors_EN_240424.pdf
Cyberagent_For New Investors_EN_240424.pdfCyberagent_For New Investors_EN_240424.pdf
Cyberagent_For New Investors_EN_240424.pdf
 
Osisko Gold Royalties Ltd - Corporate Presentation, April 23, 2024
Osisko Gold Royalties Ltd - Corporate Presentation, April 23, 2024Osisko Gold Royalties Ltd - Corporate Presentation, April 23, 2024
Osisko Gold Royalties Ltd - Corporate Presentation, April 23, 2024
 
Short-, Mid-, and Long-term gxxoals.pptx
Short-, Mid-, and Long-term gxxoals.pptxShort-, Mid-, and Long-term gxxoals.pptx
Short-, Mid-, and Long-term gxxoals.pptx
 
CALL ON ➥8923113531 🔝Call Girls Fazullaganj Lucknow best sexual service
CALL ON ➥8923113531 🔝Call Girls Fazullaganj Lucknow best sexual serviceCALL ON ➥8923113531 🔝Call Girls Fazullaganj Lucknow best sexual service
CALL ON ➥8923113531 🔝Call Girls Fazullaganj Lucknow best sexual service
 
VIP 7001035870 Find & Meet Hyderabad Call Girls Miyapur high-profile Call Girl
VIP 7001035870 Find & Meet Hyderabad Call Girls Miyapur high-profile Call GirlVIP 7001035870 Find & Meet Hyderabad Call Girls Miyapur high-profile Call Girl
VIP 7001035870 Find & Meet Hyderabad Call Girls Miyapur high-profile Call Girl
 
Call Girls 🫤 Nehru Place ➡️ 9999965857 ➡️ Delhi 🫦 Russian Escorts FULL ENJOY
Call Girls 🫤 Nehru Place ➡️ 9999965857  ➡️ Delhi 🫦  Russian Escorts FULL ENJOYCall Girls 🫤 Nehru Place ➡️ 9999965857  ➡️ Delhi 🫦  Russian Escorts FULL ENJOY
Call Girls 🫤 Nehru Place ➡️ 9999965857 ➡️ Delhi 🫦 Russian Escorts FULL ENJOY
 
@9999965857 🫦 Sexy Desi Call Girls Karol Bagh 💓 High Profile Escorts Delhi 🫶
@9999965857 🫦 Sexy Desi Call Girls Karol Bagh 💓 High Profile Escorts Delhi 🫶@9999965857 🫦 Sexy Desi Call Girls Karol Bagh 💓 High Profile Escorts Delhi 🫶
@9999965857 🫦 Sexy Desi Call Girls Karol Bagh 💓 High Profile Escorts Delhi 🫶
 
Call Girls 🫤 Hauz Khas ➡️ 9999965857 ➡️ Delhi 🫦 Russian Escorts FULL ENJOY
Call Girls 🫤 Hauz Khas ➡️ 9999965857  ➡️ Delhi 🫦  Russian Escorts FULL ENJOYCall Girls 🫤 Hauz Khas ➡️ 9999965857  ➡️ Delhi 🫦  Russian Escorts FULL ENJOY
Call Girls 🫤 Hauz Khas ➡️ 9999965857 ➡️ Delhi 🫦 Russian Escorts FULL ENJOY
 
Call Girls 🫤 East Of Kailash ➡️ 9999965857 ➡️ Delhi 🫦 Russian Escorts FULL ...
Call Girls 🫤 East Of Kailash ➡️ 9999965857  ➡️ Delhi 🫦  Russian Escorts FULL ...Call Girls 🫤 East Of Kailash ➡️ 9999965857  ➡️ Delhi 🫦  Russian Escorts FULL ...
Call Girls 🫤 East Of Kailash ➡️ 9999965857 ➡️ Delhi 🫦 Russian Escorts FULL ...
 
Malad Escorts, (Pooja 09892124323), Malad Call Girls Service
Malad Escorts, (Pooja 09892124323), Malad Call Girls ServiceMalad Escorts, (Pooja 09892124323), Malad Call Girls Service
Malad Escorts, (Pooja 09892124323), Malad Call Girls Service
 
VIP Call Girl Amritsar 7001035870 Enjoy Call Girls With Our Escorts
VIP Call Girl Amritsar 7001035870 Enjoy Call Girls With Our EscortsVIP Call Girl Amritsar 7001035870 Enjoy Call Girls With Our Escorts
VIP Call Girl Amritsar 7001035870 Enjoy Call Girls With Our Escorts
 
Q3 FY24 Earnings Conference Call Presentation
Q3 FY24 Earnings Conference Call PresentationQ3 FY24 Earnings Conference Call Presentation
Q3 FY24 Earnings Conference Call Presentation
 
CALL ON ➥8923113531 🔝Call Girls Vineet Khand Lucknow best Night Fun service 🧦
CALL ON ➥8923113531 🔝Call Girls Vineet Khand Lucknow best Night Fun service  🧦CALL ON ➥8923113531 🔝Call Girls Vineet Khand Lucknow best Night Fun service  🧦
CALL ON ➥8923113531 🔝Call Girls Vineet Khand Lucknow best Night Fun service 🧦
 
Escort Service Call Girls In Shalimar Bagh, 99530°56974 Delhi NCR
Escort Service Call Girls In Shalimar Bagh, 99530°56974 Delhi NCREscort Service Call Girls In Shalimar Bagh, 99530°56974 Delhi NCR
Escort Service Call Girls In Shalimar Bagh, 99530°56974 Delhi NCR
 
Methanex Investor Presentation (April 2024)
Methanex Investor Presentation (April 2024)Methanex Investor Presentation (April 2024)
Methanex Investor Presentation (April 2024)
 

Am website presentation (c) february 2017

  • 2. FORWARD-LOOKING STATEMENTS This presentation contains forward-looking statements. All statements, other than statements of historical facts, included in this presentation that address activities, events or developments that Antero Midstream Partners LP, and its subsidiaries (collectively, the “Partnership”) expect, believe or anticipate will or may occur in the future are forward-looking statements. The words “believe,” “expect,” “anticipate,” “plan,” “intend,” “estimate,” “project,” “foresee,” “should,” “would,” “could,” or other similar expressions are intended to identify forward-looking statements. However, the absence of these words does not mean that the statements are not forward-looking. Without limiting the generality of the foregoing, forward-looking statements contained in this presentation specifically include expectations of plans, strategies, objectives, and anticipated financial and operating results of the Partnership and Antero Resources Corporation (“Antero Resources”). These statements are based on certain assumptions made by the Partnership and Antero Resources based on management’s experience and perception of historical trends, current conditions, anticipated future developments and other factors believed to be appropriate. Such statements are subject to a number of assumptions, risks and uncertainties, many of which are beyond the control of the Partnership, which may cause actual results to differ materially from those implied or expressed by the forward-looking statements. These include the factors discussed or referenced under the heading “Item 1A. Risk Factors” in our Annual Report on Form 10-K for the year ended December 31, 2015 and in the Partnership’s subsequent filings with the SEC. The Partnership cautions you that these forward-looking statements are subject to risks and uncertainties that may cause these statements to be inaccurate, and readers are cautioned not to place undue reliance on such statements. These risks include, but are not limited to, Antero Resources’ expected future growth, Antero Resources’ ability to meet its drilling and development plan, commodity price volatility, inflation, environmental risks, drilling and completion and other operating risks, regulatory changes, the uncertainty inherent in projecting future rates of production, cash flow and access to capital, the timing of development expenditures, and the other risks discussed or referenced under the heading “Item 1A. Risk Factors” in the Partnership’s Annual Report on Form 10-K for the year ended December 31, 2015 and in the Partnership’s subsequent filings with the SEC. Our ability to make future distributions is substantially dependent upon the development and drilling plan of Antero Resources, which itself is substantially dependent upon the review and approval by the board of directors of Antero Resources of its capital budget on an annual basis. In connection with the review and approval of the annual capital budget by the board of directors of Antero Resources, the board of directors will take into consideration many factors, including expected commodity prices and the existing contractual obligations and capital resources and liquidity of Antero Resources at the time. Any forward-looking statement speaks only as of the date on which such statement is made, and the Partnership undertakes no obligation to correct or update any forward-looking statement, whether as a result of new information, future events or otherwise, except as required by applicable law. 1 Antero Midstream Partners LP is denoted as “AM” and Antero Resources Corporation is denoted as “AR” in the presentation, which are their respective New York Stock Exchange ticker symbols.
  • 3. ANTERO MIDSTREAM PROFILE 2 Market Cap………………....... Enterprise Value….........……. LTM EBITDA(1)………......…… % Gathering/Compression % Water Net Debt(2)/LTM EBITDA…….. Gross Dedicated Acres(3)……. $6.2 Billion $7.0 Billion $404 Million 65% 35% 2.0x 528,000 Note: Market cap and enterprise value as of 2/6/2017 pro forma for the 6.0 million unit offering with gross proceeds of $198 million used to fund $155 million MPLX JV payment. 1. Twelve months ended 12/31/2016. Includes midpoint of preliminary unaudited results, per information available to the Partnership as of the 2/6/2017 offering. 2. Net debt based on credit facility borrowings as of 2/3/2017 per S-3 filing dated 2/6/2017 pro forma for 2/6/2017 unit offering of $198 million and $155 million MPLX JV payment. 3. Excludes 173,000 gross acres dedicated to third parties for gathering and compression services.
  • 4. JOINT VENTURE OVERVIEW 3 Antero Midstream (NYSE: AM) and MPLX (NYSE: MPLX) have formed a 50/50 joint venture for processing and fractionation infrastructure in the core of the liquids-rich Marcellus and Utica Shales Majorsville Complex Mobley Complex Houston Complex Keystone Complex Harmon Creek Complex Hopedale Fractionation Complex Hopedale 1 – 2 – In Service Hopedale 3 – In Service – 60,000 Bbl/d Potential Future Capacity Cadiz Complex Seneca Complex Seneca 1 - 4 - In Service Ohio Condensate Stabilization Strategic Rationale • Further aligns the largest core liquids-rich resource base with the largest processing and fractionation footprint in Appalachia ‒ Up to 11 additional processing plants ‒ 20,000 Bbl/d of capacity at Hopedale 3 fractionation facility with an option to invest in future fractionation capacity ‒ Over $800 million project inventory through 2020 (net to AM), including ~$155 million contribution upfront for processing and fractionation infrastructure • Fits with AM’s “full value chain organic growth” strategy ‒ Long-term 100% fixed-fee revenues ‒ Significant MVCs on processing ‒ Full build out EBITDA multiple of 4x – 6x ‒ 15% – 18% IRR • Improved visibility throughout vertical value chain and ability to deploy “just-in-time” capital supporting Antero Resources’ rich gas development ‒ Pro forma for the JV, AM has $2.7 billion of organic growth opportunities from 2017 – 2020 at attractive 4x – 6x investment to EBITDA multiples Sherwood Complex Sherwood 1 - 6 - In Service – 1,200 MMcf/d Sherwood 7 – 1Q17 – 200 MMcf/d Sherwood 8 – 3Q17 – 200 MMcf/d Sherwood 9 – 1Q18 – 200 MMcf/d Sherwood 10- 11 – Potential – 400 MMcf/d 1. RigData as of 01/06/17. Rigs drilling in rich gas areas only. 2. New West Virginia site location still to be determined. (1) New Complex (2) Future Processing TBA 1 – 6 – Potential – 1,200 MMcf/d
  • 5. Joint Venture Assets JOINT VENTURE: PROCESSING ASSET SUMMARY 4 Joint Venture Processing AssetsSummary • AM and MPLX have formed a 50/50 joint venture to invest in Marcellus processing infrastructure ‒ The JV could construct up to 11 new 200 MMcf/d processing plants at both Sherwood and a new location in Tyler, Wetzel or Doddridge County to meet Antero’s liquids-rich gas production growth profile ‒ All JV processing assets will be operated by MPLX • Antero Resources is the anchor producer ‒ Long-term fixed-fee agreement with inflation protection and significant minimum volume commitments • Antero Midstream has released 195,000 gross processable acres to the JV in Tyler, Wetzel and Ritchie Counties, WV ‒ Over 2,100 undrilled locations and 29 Tcfe of net 3P reserves dedicated to the JV(1) • AM expects the JV to invest up to $1.3 billion(3) over the next four years in processing infrastructure ‒ Net capital investment of up to $650 million over 4 years, including ~$95 million contribution up front for processing infrastructure under construction (three Sherwood plants) ‒ JV excludes NGL pipeline infrastructure as well as de- ethanization facilities Sherwood Complex Sherwood 1 - 6 - In Service Sherwood 7 – 1Q17 Sherwood 8 – 3Q17 Sherwood 9 – 1Q18 Sherwood 10- 11 – Potential New Complex (2) Future Processing TBA 1 – 6 – Potential – 1,200 MMcf/d JV Plants 195,000 Gross Acres 167,000 Gross Acres 1 2 3 4 5 6 7 8 9 10 = 200 MMcf/d of capacity Note: RigData as of 01/06/17. Rigs drilling in rich gas areas only. 1. Antero undrilled 3P locations and 3P reserves at strip pricing as of 12/31/2016 with Btu greater than 1100. 2. New West Virginia site location still to be determined. 3. Antero Midstream management estimate. Plants 10 11 1 2 3 4 5 6 (1)
  • 6. Joint Venture Assets JOINT VENTURE: FRACTIONATION ASSET SUMMARY 5 Joint Venture Fractionation AssetsSummary JV Capacity • AM and MPLX have formed a 50/50 joint venture to invest in C3+ fractionation infrastructure in Appalachia ‒ JV will purchase 1/3 capacity up front in Hopedale 3 ‒ Option to buy on similar terms additional fractionation capacity with incremental C3+ production growth from the JV processing facilities ‒ All JV fractionation assets will be operated by MPLX • Antero Resources is the anchor producer, with additional third party volumes ‒ Long-term fixed-fee agreement with inflation protection ‒ Long-term fixed-fee agreements with other established Appalachian producers • Strategic location with access to liquids pipelines including Mariner East/Mariner West, TEPPCO, and Cornerstone • AM expects the JV to invest up to $300 million(1) over the next four years in fractionation infrastructure at Hopedale ‒ Antero Midstream net capital investment of up to $150 million over 4 years, including ~$60 million upon closing for existing fractionation infrastructure Mariner East ATEX Hopedale Fractionation Complex Hopedale 1 – 2 – In Service Hopedale 3 – In Service – 60,000 Bbl/d Note: RigData as of 01/06/17. Rigs drilling in rich gas areas only. 1. Antero Midstream management estimate. 1 2 3 Potential Future Capacity Plants (1)
  • 7. •Cornerstone and Utica build-out projects critical to delivery of natural gasoline to Midwest refinery markets and Western Canada •Exploring long-term butane-to-alkylate project to create additional in-basin demand •Supporting the next phase of NGL marketing with unit train deliveries from the region •Progressing infrastructure options to move propane to East Coast and Gulf Coast markets •Largest fully integrated de-ethanization system in the Marcellus and Utica shales •Access to all major takeaway pipelines: ATEX, Mariner East and Mariner West •Well-positioned to support development of potential steam crackers in Northeast FOCUSED ON NGL SOLUTIONS 6 MPLX leads the development of infrastructure to process and fractionate Northeast NGLs as well as to link NGL supply with market demand and enhance value for producers Ethane Propane Natural Gasoline Butanes Antero Midstream JV alignment with MPLX adds momentum to the Northeast NGL infrastructure buildout
  • 8. CREATING A DIVERSIFIED ASSET MIX IN THE NORTHEAST 7 Antero Midstream is creating a diversified organic midstream infrastructure business in the Northeast that supports the long-term growth profile of the Marcellus and Utica shales 63% 35% 2% Gathering & Compression Fresh Water Delivery Regional Gas Pipeline EBITDA Contribution % EBITDA Contribution % 60% 24% 4% 10% 2% Gathering & CompressionFresh Water Delivery Processing & Fractionation JV Regional Gas Pipeline Wastewater Treatment 2016 (1) 2020E 1. Contribution % based on LTM EBITDA for twelve months ending September 30, 2016.
  • 9. KEY ATTRIBUTES –PROCESSING & FRACTIONATION JV 8 • Aligns largest core liquids-rich resource base (AR) with the largest processing & fractionation footprint (MPLX) in Appalachia • JV secures over $800 million in organic project inventory for AM for 2017 to 2020 period • JV processing volumes driven by AR production volumes • JV fractionation volumes driven by both AR and third party producers • Attractive expected mid to high-teens rates of return • Diversifies AM’s investment portfolio and cash flow contribution mix • Initial JV facilities in-service and cash flow producing in 1Q 2017 - Sherwood 7 processing and Hopedale 3 fractionation • Accretive transaction for Antero Midstream • Further strengthens long-term Antero relationship with MarkWest and now MPC/MPLX (Baa3/BBB-) to facilitate Northeast NGL infrastructure buildout
  • 10. $1.03 $1.33 $0.00 $0.50 $1.00 $1.50 $2.00 $2.50 $3.00 $3.50 2016E 2017E 2018E 2019E 2020E Updated 2017 Guidance(2) 2017 GUIDANCE AND LONG TERM TARGETS 9 DCF Coverage: 1.30x – 1.45x > 1.25x Distribution Growth(1): $520 – $560 Peer Leading GrowthEBITDA ($MM): $800 $2.7 Billion organic opportunity set from 2017 – 2020Capital Expenditures ($MM): 2.0x – 2.5x Low 2-times rangeLeverage: 2018 - 2020 Long-Term Targets 1. Assumes midpoint of 2017 distribution growth guidance and long-term target. Future distributions subject to Board approval. 2. Per press release dated 2/6/2017. Guidance Long Term Targets 2016A
  • 11. At IPO November (2014) 1. Excludes 173,000 gross acres dedicated to third parties for gathering and compression services. 2. Adjusted EBITDA attributable to the partnership for the twelve months ending September 30, 2014 and December 31, 2016. LTM EBITDA for period ending December 31, 2016 based on actuals through September 30, 2016 and midpoint of preliminary unaudited results for the three months ended December 31, 2016, per information available to the Partnership as of the date of this offering. 3. For the three months ended September 30, 2016. TRACK RECORD OF HIGH GROWTH 10 Distribution Per Unit: $0.17 (MQD) $0.28 Gross Dedicated Acreage(1): Low Pressure: 532 MMcf/d Compression: 116 MMcf/d High Pressure: 531 MMcf/d Low Pressure: 1,431 MMcf/d Compression: 777 MMcf/d High Pressure: 1,351 MMcf/d Throughput Volumes(3): Current $45 $404LTM EBITDA(2): N/A 140 MBbl/d Fresh Water Delivery Volumes(3): 418,000 Gross Acres +65% +798% +169% +570% +154% +100% 528,000 Gross Acres +26%
  • 12. 32 32 32 35 36 41 43 46 10 15 20 25 30 35 40 45 50 1Q15 2Q15 3Q15 4Q15 1Q16 2Q16 3Q16 4Q16 BarrelsofWaterPer FootofLateral 11 AR Has Increased Proppant Load by Over 33% in the Marcellus and Utica Pilot Testing Demonstrated Improved Recoveries While Maintaining Well Density AR Advanced Marcellus Completion Designs Utilizing 38 to 45 Barrels of Water Per Lateral Foot, a 19% to 41% Increase  New AR completion designs result in more water utilization driving higher AM fees, while increased proppant load generates encouraging early results with potential long-term benefits to AM gathering throughput ADVANCED COMPLETIONS DRIVE INCREASED WATER VOLUMES 1,182 1,030 1,005 1,281 1,382 1,590 1,661 2,035 - 500 1,000 1,500 2,000 2,500 1Q15 2Q15 3Q15 4Q15 1Q16 2Q16 3Q16 4Q16 SandPlacedPerFootof Lateral
  • 13. $7.1 $9.7 $12.3 41% 57% 75% 0% 20% 40% 60% 80% 100% 120% $0.0 $5.0 $10.0 $15.0 $20.0 1.7 2.1 2.0 2.5 2.3 2.8 Pre-TaxROR Pre-TaxPV-10 Pre-Tax PV-10 Pre-Tax ROR $11.5 $15.0 $18.4 67% 93% 122% 0% 20% 40% 60% 80% 100% 120% 140% $0.0 $5.0 $10.0 $15.0 $20.0 1.7 2.3 2.0 2.7 2.3 3.1 Pre-TaxPV-10 Pre-Tax PV-10 Pre-Tax ROR 121. See Appendix for SWE assumptions and 12/31/2016 pricing. 2. Assumes ethane rejection. Highly-Rich Gas/Condensate(1) Wellhead Bcf/1,000’: Processed Bcfe/1,000’: Antero expects to complete 114 wells in 2017 in the highly-rich gas regimes (fully dedicated to AM) where 2016 advanced completions are tracking 2.0 Bcf/1,000’ of lateral 2.0 2.7 2.0 2.5 20 Planned 2017 Completions IMPROVING MARCELLUS RETURNS Wellhead Bcf/1,000’: Processed Bcfe/1,000’: Highly-Rich Gas(1) 94 Planned 2017 Completions 2016 Advanced Completion Results
  • 14. 13 LEADING APPALACHIA MIDSTREAM BUSINESS MODEL Premier E&P Operator in Appalachia High Growth Sponsor Drives AM Throughput Growth “Just-in-time” Non-Speculative Capital Program Opportunity to Build Out Northeast Value Chain ~$1.0 Billion of AM Liquidity 100% Fixed Fee and Largest Firm Transport and Hedge Portfolio
  • 15. 0 10 20 30 40 50 60 70 80 AR RRC EQT SWN CHX CNX GPOR COG RICE (MBbl/d) 0 500 1,000 1,500 2,000 2,500 EQT AR CHK COG RRC SWN CNX 0 500 1,000 1,500 2,000 2,500 3,000 3,500 0 2,000 4,000 6,000 8,000 10,000 12,000 14,000 AR EQT RRC COG CNX CHK SWN Top Producers in Appalachia (Net MMcfe/d) – 3Q 2016(1)(2) Top 12 U.S. Natural Gas Producers (Net MMcf/d) – 3Q 2016(1) Appalachian Producers by Proved Reserves (Bcfe) – YE 2015(1)(2) Appalachian Producers Net C2+ NGL Production (MBbl/d) – 3Q 2016(2) 1. Based on company filings and presentations. Excludes pro forma additions via acquisitions. 2. Appalachian only production and reserves where available. 3. Includes proved reserves categorized in “Northern Division” consisting of Utica Shale, Marcellus Shale and Powder River Basin. (3) 14 Appalachian Peers Largest Proved Reserve Base In Appalachia ) ) ) ) Top NGL producer in Appalachia in 3Q ‘16 2nd Largest Appalachian Producer in 3Q ‘16 8th Largest Gas Producer in U.S. in 3Q ‘16 SPONSOR STRENGTH – LEADERSHIP IN APPALACHIAN BASIN  Antero has the largest proved reserve base, largest core liquids-rich acreage position and is one of the largest producers in the Appalachian Basin and the U.S.
  • 16. $198 $341 $434 $649 $1,164 $1,221 $1,400 $1,495 $0 $200 $400 $600 $800 $1,000 $1,200 $1,400 $1,600 2010 2011 2012 2013 2014 2015 2016E 2017E -5,000 5,000 15,000 25,000 35,000 45,000 55,000 65,000 75,000 85,000 95,000 2010 2011 2012 2013 2014 2015 2016E 2017E NGLs (C3+) Oil Ethane 5 246 6,436 23,051 48,298 73,000 51% Growth Guidance 92,500 26.5% Growth Guidance 1. Represents midpoint of updated 2017 production guidance of 20% to 25% per press release dated 1/4/2017. 2. Represents midpoint of updated long-term guidance of 20% to 22% per press release dated 1/4/2017. 3. Represents Bloomberg street consensus estimates as of 12/31/2016. 1,800 2,205 2,668 3,228 3,906 0 500 1,000 1,500 2,000 2,500 3,000 3,500 4,000 Marcellus Utica Guidance 30 124 239 522 1,007 1,493 0 50 100 150 200 2010 2011 2012 2013 2014 2015 2016E 2017E Marcellus Utica Deferred Completions 19 38 60 114 131 110 22.5% Growth Guidance(1) 20% – 22% Growth Target(2)  Antero is in the unique position of sustaining growth and value creation through the price down cycle Street Consensus(3) SPONSOR STRENGTH – GROWTH & MOMENTUM THROUGH THE DOWN CYCLE 200 170 180181177 15 Average Net Daily Production (MMcfe/d) Average Net Daily Liquids Production (Bbl/d) Operated Gross Wells Completed Consolidated EBITDAX ($MM)
  • 17. Leading Appalachia Core Acreage Position Antero has the largest core acreage position in Appalachia, particularly as it relates to undeveloped acreage and is running 36% of the total rigs in liquids-rich core areas 591 575 397 388 332 288 259 234 234 200 200 171 155 - 100 200 300 400 500 600 AR P1 P2 P3 P4 P5 P6 P7 P8 P9 P10 P11 P12 Core Net Acres Dry Core Net Acres Liquids-Rich Developed Acreage Marker AR has dominant liquids-rich position SPONSOR STRENGTH – LARGEST CORE ACREAGE POSITION IN APPALACHIA 16Source: Core outlines based upon Antero geologic interpretation, well control and peer acreage positions based on investor presentations, news releases and 10-K/10-Qs. Rig information per RigData as of 12/31/2016. Competitor leasehold positions analyzed include Ascent (private), CHK, CNX, COG, CVX, ECR, EQT, GPOR, NBL, RICE, RRC, SWN.
  • 18. 247 1,060 1,756 2,536 3,419 3,611 3,645 0 500 1,000 1,500 2,000 2,500 3,000 3,500 4,000 $1.50 $2.00 $2.50 $3.00 $3.50 $4.00 $4.00 Locations Marcellus Rich Gas Marcellus Dry Gas Ohio Utica Rich Gas Ohio Utica Dry Gas 1. Marcellus and Utica 3P locations as of 1/31/2017. Categorized by breakeven price solving for a 20% BTAX ROR and assuming 50% of AM fees due to AR ownership of AM. Assumes strip pricing for oil which averages $56.00/Bbl over the next five years and 50% of WTI for NGLs ($27/Bbl). 2. Includes 3,443 total core locations plus 202 non-core 3P locations , including 211 3P locations with laterals less than 4,000 feet. 17 Cumulative 3P Drilling Inventory – Breakeven Prices at 20% ROR (1)(2) Marcellus Rich Gas Marcellus Dry Gas Ohio Utica Rich Gas < << << < < Antero has a 15 year drilling inventory at $3.00 natural gas or less at the 2017 development pace (170 completions), excluding 2,000 incremental locations representing additional 15 Tcf risked resource ~70% of total locations generate at least a 20% rate of return at $3.00/Mcf Nymex 29% of total locations generate at least a 20% rate of return at $2.00/Mcf Nymex 8,253’8,062’8,177’8,607’8,630’9,1099,229’ Average Lateral Length Ohio Utica Dry Gas NYMEX Natural Gas Price ($/MMBtu) SPONSOR STRENGTH – SUSTAINABLE INVENTORY OF LOW BREAKEVEN PRICES
  • 19. 3.2 3.5 4.0 3.2 3.7 6.0 0.0 1.0 2.0 3.0 4.0 5.0 6.0 7.0 2014 2015 Q4 2016 Record StagesperDay8,052 8,910 8,9038,543 8,575 9,221 (1,000) 1,000 3,000 5,000 7,000 9,000 11,000 2014 2015 Q4 2016 Record LateralLength(feet) 29 24 12 9 29 31 13 0 5 10 15 20 25 30 35 40 45 2014 2015 Q4 2016 Record DrillingDays $1.34 $1.18 $0.84 $1.55 $1.36 $0.99 $0.00 $0.50 $1.00 $1.50 $2.00 2014 2015 Q4 2016 WellCostper1,000’ofLateral ($MM) 18 SPONSOR STRENGTH – AR’S CONTINUOUS OPERATING IMPROVEMENT Increasing Completion Stages per Day Drilling Longer Laterals Dramatic Decrease in Drilling Days Declining Well Costs per 1,000’ Drilling longer laterals while reducing drilling days by 60% More efficient completions (“zipper fracs”) are increasing stages per day Reducing well costs by ~35% since 2014 Continuing to be an industry leader in drilling longer laterals Driving drilling and completion efficiencies which continues to lower well costs Record Record 14,014 Record 10.0
  • 20. 32 33 46 35 34 39 0 10 20 30 40 50 2014 2015 Q4 2016 BarrelsofWaterPerFoot 1,165 1,163 2,035 1,267 1,298 1,802 - 400 800 1,200 1,600 2,000 2,400 2014 2015 Q4 2016 PoundsofProppantPerFoot $0.88 $0.73 $0.41 $1.28 $0.94 $0.68 $0.00 $0.50 $1.00 $1.50 2014 2015 Q4 2016 F&DperMcfe 1. Based on statistics for wells completed within each respective period. 2. Ethane rejection assumed. 3. Current D&C cost per 1,000’ lateral divided by net EUR per 1,000’ lateral assuming 85% NRI in Marcellus and 81% NRI in Utica. 19 SPONSOR STRENGTH – AR’S DRAMATICALLY LOWER F&D COSTS Increasing Water Per Foot Much Lower F&D Cost per Mcfe(2)(3) Increasing Proppant Per Foot Increasing EUR per 1,000’ (Bcfe)(1)(2) Higher proppant concentration has contributed to higher recoveries Higher proppant concentration requires increased water usage Since 2014, Antero has increased EURs by 33% in the Marcellus and 20% in the Utica Bottom line: F&D costs per Mcfe have declined by 52% in the Marcellus and 46% in the Utica since 2014 Enhanced completion designs have contributed to improved recoveries (for AR) and volume throughput (for AM) Record Record 562,555 1.8 1.9 2.4 2.9 1.5 1.8 1.8 0.0 0.5 1.0 1.5 2.0 2.5 3.0 2014 2015 Q4 2016 ProcessedEURper1,000' ofLateral(Bcfe) Record
  • 21. 170 190 190 255 0 50 100 150 200 250 300 2017E 2018E 2019E 2020E Marcellus Rich Gas Marcellus Dry Gas Utica Rich Gas Ohio Utica Dry Gas 3,645 Locations 2,840 Locations Expect to place >800 new Marcellus and Ohio Utica wells to sales by YE 2020 1. Marcellus and Utica 3P locations as of 12/31/2016 pro forma for recent acreage acquisitions. Excludes WV/PA Utica Dry locations. Average Lateral Length ~8,998 feet 20 CURRENT UNDRILLED 3P LOCATIONS BY BTU REGIME(1) ESTIMATED YE 2020 UNDRILLED 3P LOCATIONS Antero plans to develop over 800 horizontal locations in the Marcellus and Ohio Utica by the end of the decade while utilizing less than 25% of its current 3P drilling inventory Planned Antero Well Completions by Year Marcellus Rich Gas Ohio Utica Rich Gas Ohio Utica Dry Gas Marcellus Dry Gas 6% Ohio Utica Dry Gas 172 Locations11% Utica Rich Gas 303 Locations 20% Marcellus Dry Gas 562 Locations 63% Marcellus Rich Gas 1,803 Locations 16% Marcellus Dry Gas 572 Locations 64% Marcellus Rich Gas 2,351 Locations 13% Utica Rich Gas 469 Locations 7% Ohio Utica Dry Gas 253 Locations 9,000’ ORGANIC GROWTH – MULTI-YEAR GROWTH ENGINE
  • 22. 77 125 140 186 105 89 64 113 97 105 140 0 20 40 60 80 100 120 140 160 180 200 36 41 116 222 358 454 435 478 606 658 777 0 200 400 600 800 1,000 1,200 126 266 531 908 1,134 1,197 1,216 1,195 1,222 1,253 1,351 0 200 400 600 800 1,000 1,200 1,400 1,600 1,800 2,000 331 386 532 738 935 965 1,038 1,124 1,303 1,353 1,431 0 200 400 600 800 1,000 1,200 1,400 1,600 1,800 2,000 Low Pressure Gathering (MMcf/d) Compression (MMcf/d) High Pressure Gathering (MMcf/d) 21Note: Y-O-Y growth based on 3Q’15 to 3Q’16. ORGANIC GROWTH – HIGH GROWTH MIDSTREAM THROUGHPUT Fresh Water Delivery (MBbl/d) Marcellus Utica Marcellus Utica Marcellus Utica Marcellus Utica
  • 23. ORGANIC GROWTH – DRIVES VALUE CREATION 22 • Organic growth strategy provides attractive returns and project economics, while avoiding the competitive acquisition market and reliance on capital markets • Industry leading organic growth story – ~$2.4 billion in capital spent through 09/30/2016 on gathering and compression and water assets – $525 million in additional capital forecast for the twelve-month period ending 12/31/17 – 4-year identified investment opportunity set of $2.7 billion Note: Precedent data per IHS Herold’s research and public filings. 1. Antero organic multiple calculated as gathering and compression and water capital expended through Q3 2016 divided by midpoint of 2017 EBITDA guidance of $500 to $550 million, assuming 12-15 month lag between capital incurred and full system utilization. 2. Selected gathering and compression drop down acquisitions since 1/1/2015. Drop down multiples are based on NTM EBITDA. Source: Barclays. 4.4x 13.3x 10.5x10.3x 10.0x10.0x 9.5x 9.0x9.0x9.0x8.8x8.8x8.7x 8.4x 7.8x 6.0x5.9x5.8x 5.0x 0.0x 1.0x 2.0x 3.0x 4.0x 5.0x 6.0x 7.0x 8.0x 9.0x 10.0x 11.0x 12.0x 13.0x 14.0x Drop Down Multiple (2) Organic EBITDA Multiple vs. Precedent Drop Down Multiples Median: 8.8x Value creation for the AM unit holder = Build at 4x to 7x EBITDA vs. Drop Down / Buy at 8x to 12x EBITDA
  • 24. 25% 15% 10% 25% 30% 15% 25% 15% 35% 25% 20% 35% 40% 25% 35% 18% 0% 5% 10% 15% 20% 25% 30% 35% 40% 45% InternalRateofReturn LP Gathering HP Gathering Compression Condensate Gathering Fresh Water Delivery Advanced Wastewater Treatment Stonewall Gathering Pipeline Processing/ Fractionation Unlevered IRR Range: 25% - 35% 15% - 25% 10% - 20% 25% - 35% 30% - 40% 15% - 25% 25% - 35% 15% - 18% Payout (Years): 2.5 - 4.0 3.5 - 4.5 4.0 - 6.5 2.0 - 3.5 2.0 - 3.0 6.0 - 8.0 2.0 - 3.5 5.0 - 6.0 Minimum Volume Commitments: N/A 75% 70% N/A Yes N/A 80% Yes 2017 Capex Total Marcellus $655 $80 $60 $115 - $50 $75 - $275 Utica 145 45 10 40 - 25 25 - - Total Capex $800 $125 $70 $155 $0 $75 $100 $0 $275 % of Capex 100% 16% 9% 19% 0% 9% 13% 0% 34% Included in 2017 Budget: Marcellus & Utica Marcellus & Utica Marcellus & Utica Utica Marcellus & Utica Marcellus & Utica Marcellus Marcellus & Utica 4-year identified investment opportunity set $2.7 B 20% - 25% 8% - 13% 25% - 30% 0% 5% - 10% 3% - 5% 0% 25% - 30% Additional In-hand Opportunities: Dry Utica Upper Devonian Dry Utica Upper Devonian Dry Utica Upper Devonian Utica Stabilization Dry Utica Upper Devonian Dry Utica Upper Devonian Third Party Fractionation 23 Project Economics by Segment(1) 1. Based on management capex, operating cost and throughput assumptions by project. Wtd. Avg. 21% IRR ORGANIC GROWTH – ESTIMATED PROJECT ECONOMICS BY SEGMENT
  • 25. 24 In-service 2017 Budget HIGH VISIBILITY – PROJECTED MIDSTREAM BUILDOUT Utica Marcellus
  • 26. - 1,000,000 2,000,000 3,000,000 4,000,000 5,000,000 6,000,000 25 BBtu/d Antero Resources Transportation Portfolio • Antero Resources has built the largest firm transportation portfolio in Appalachian Basin with 4.85 BBtu/d by year end 2018 • Realized pricing in line with Nymex gas prices year-to-date in 2016, before hedges 2015 2016E 2017E 2018E Favorable: Chicago MichCon Gulf Coast NYMEX TCO AR Increasing Access to Favorable Markets Less favorable: TETCO M2 Dominion South 74% 26% 99% 1% 97% 3% 97% 3% (Stonewall/WB) Mid-Atlantic/NYMEX (Stonewall/TGP) Gulf Coast (TCO) Appalachia or Gulf Coast Appalachia Appalachia (REX/ANR/NGPL/MGT) Midwest (ANR/Rover) Gulf Coast MITIGATED COMMODITY RISK – FIRM TRANSPORTATION & SALES PORTFOLIO Gross Gas Production (BBtu/d) 2017 Production Guidance: 20% – 25% 2018 – 2020 Production Target: 20% – 22%(1) 1. Per press release dated 01/04/2017.
  • 27. $0.00 $1.00 $2.00 $3.00 $4.00 $5.00 $6.00 ($50) $0 $50 $100 $150 $200 $250 $300 $MM 26  Hedging is a key component of Antero’s business model which includes development of a large, repeatable drilling inventory – Locks in higher returns in a low commodity price environment and reduces the amount of time for well payout, thereby enhancing liquidity  Antero has realized $2.7 billion of gains on commodity hedges since 2009 – Gains realized in 31 of last 32 quarters, or 97% of the quarters since 2009 ● Based on Antero’s hedge position and strip pricing as of 12/31/2016, the unrealized commodity derivative value is $1.6 billion ● Significant additional hedge capacity remains under the credit facility hedging covenant for 2020 – 2022 period Quarterly Realized Hedge Gains / (Losses) Realized Hedge Gains Projected Hedge Gains NYMEX Natural Gas Historical Spot Prices ($/MMBtu) NYMEX Natural Gas Futures Prices 12/31/16 3.4 Tcfe Hedged at average price of $3.63/MMBtu through 2022 Average Hedge Prices ($/MMBtu) $3.35 $3.51 $3.91 $3.70 $3.66 $3.21 $1.6 Billion in Projected Hedge Gains Through 2022 Realized $2.7 Billion in Hedge Gains Since 2009 INTEGRAL TO BUSINESS MODEL
  • 28. Regional Gas Pipeline – 15% Ownership Miles Capacity In-Service Stonewall Gathering Pipeline(2) 67 1.4 Bcf/d Yes 1. Acquired by AM from AR for a $1.05 billion upfront payment and a $125 million earn out in each of 2019 and 2020. 2. Antero Midstream owns 15% ownership in Stonewall pipeline. End Users End Users Gas Processing Y-Grade Pipeline Long-Haul Interstate Pipeline Inter Connect NGL Product Pipelines Fractionation Compression Low Pressure Gathering Well Pad Terminals and Storage AM has option to participate in terminaling and storage projects offered to AR AM Owned Assets Condensate Gathering Stabilization End Users (Ethane, Propane, Butane, etc.) 27 FULL MIDSTREAM VALUE CHAIN BUILDOUT AM/MPLX JV Assets Processing and fractionation infrastructure adds to AM’s full value chain model AM Option Assets
  • 29. 2.0x 0.0x 0.5x 1.0x 1.5x 2.0x 2.5x 3.0x 3.5x 4.0x Peer 1 Peer 2 Peer 3 Peer 4 Peer 5 Peer 6 Peer 7 NetDebt/LTMEBITDA • $1.5 billion revolver in place to fund future growth capital (5.0x Debt/EBITDA Cap) • Liquidity of $999 million at 2/3/2017 based off $1,157 million revolver pro forma for 6.0 million unit offering on 2/6/2017 for gross proceeds of $198 million used to fund $155 million MPLX JV payment • Sponsor (NYSE: AR) has Ba2/BB corporate debt ratings • AM corporate debt ratings also Ba2/BB AM Liquidity (9/30/2016) AM Peer Leverage Comparison(1) ($ in millions) Revolver Capacity $1,157 Less: Borrowings (167) Plus: Cash 9 Liquidity $999 1. As of 9/30/2016. Peers include TEP, EQM, WES, RMP, SHLX, DM, and CNNX. 2. Antero Midstream credit facility as of 2/3/2017 pro forma for 6.0 million unit offering on 2/6/2017 with gross proceeds of $198 million used to fund $155 million MPLX JV payment. Financial Flexibility 28 STRONG FINANCIAL POSITION – SIGNIFICANT FINANCIAL FLEXIBILITY (2)
  • 30. TOP TIER DISTRIBUTION GROWTH & HEALTHY COVERAGE 29 3 –Year Street Consensus Distribution Growth Rate and DCF Coverage(1) 1. Based on Bloomberg 2016-2018 Bloomberg consensus estimates as of 12/31/2016. 29% 29% 24% 23% 23% 22% 20% 19% 13% 12% 8% >1.2x 1.5x 1.9x 1.4x 1.3x 1.2x 1.6x 1.5x 1.4x 1.3x 1.2x 0.0x 0.2x 0.4x 0.6x 0.8x 1.0x 1.2x 1.4x 1.6x 1.8x 2.0x 0% 5% 10% 15% 20% 25% 30% 35% 40% AM Target SHLX VLP PSXP DM TEP RMP EQM CNNX MPLX WES Distribution Growth DCF Coverage Ratio
  • 31. Antero Midstream (NYSE: AM) Asset Overview 30
  • 32. 31 Gathering and Compression Assets ANTERO MIDSTREAM GATHERING AND COMPRESSION ASSET OVERVIEW 1. Based on 2016 capital budget. 2. Includes both expansion capital and maintenance capital. • Gathering and compression assets in core of rapidly growing Marcellus and Utica Shale plays – Acreage dedication of ~528,000 gross leasehold acres for gathering and compression services – Additional stacked pay potential with dedication on ~278,000 gross acres of Utica deep rights underlying the Marcellus in WV and PA – 100% fixed fee long term contracts Projected Gathering and Compression Infrastructure Marcellus Shale Utica Shale Total YE 2016E Cumulative Gathering/ Compression Capex ($MM)(1) $1,216 $482 $1,698 Gathering Pipelines (Miles) 213 94 307 Compression Capacity (MMcf/d) 1,015 120 1,135 Condensate Gathering Pipelines (Miles) - 19 19 2017E Gathering/Compression Capex Budget ($MM)(2) $255 $95 $350 Gathering Pipelines (Miles) 30 5 35 Compression Capacity (MMcf/d) 490 - 490
  • 33. ANTERO MIDSTREAM ASSETS – RICH GAS MARCELLUS • Provides Marcellus gathering and compression services − Liquids-rich gas is delivered to MPLX’s 1.2 Bcf/d Sherwood processing complex • Significant growth projected over the next twelve months as set out below: • Antero plans to operate an average of four drilling rigs in the Marcellus Shale during 2017, including intermediate rigs • Antero plans to complete 135 Marcellus wells, 113 of which are located on AM dedicated acreage − AM dedicated acreage contains over 2,000 gross undeveloped Marcellus locations • Antero 2017 development plan averages nine wells per pad, improving economics at AM Marcellus Gathering & Compression Note: Antero acreage position reflects tax districts in which greater than 3,000 net acres are owned. YE 2016 YE 2017E Low Pressure Gathering Pipelines (Miles) 115 126 High Pressure Gathering Pipelines (Miles) 98 117 Compression Capacity (MMcf/d) 1,015 1,505 Acquisition Acreage 32
  • 34. • Provides Utica gathering and compression services − Liquids-rich gas delivered into MPLX’s 800 MMcf/d Seneca processing complex − Condensate delivered to centralized stabilization and truck loading facilities • Significant growth projected over the next twelve months as set out below: • Antero plans to operate an average of three drilling rigs in the Utica Shale during 2017, including intermediate rigs • All 35 gross wells targeted to be completed in 2016 are on Antero Midstream’s footprint • Antero 2017 development program plan averages six wells per pad Utica Gathering & Compression Note: Antero acreage position reflects tax districts in which greater than 3,000 net acres are owned. ANTERO MIDSTREAM ASSETS – RICH & DRY GAS UTICA YE 2016 YE 2017E Low Pressure Gathering Pipelines (Miles) 58 63 High Pressure Gathering Pipelines (Miles) 36 36 Condensate Pipelines (Miles) 19 19 Compression Capacity (MMcf/d) 120 120 33
  • 35. ANTERO MIDSTREAM WATER BUSINESS OVERVIEW 34 Water Business Assets  AM acquired AR’s integrated water business for $1.05 billion plus earn out payments of $125 million at year-end in each of 2019 and 2020 − The acquired business includes Antero’s Marcellus and Utica freshwater delivery business, the fully-contracted future advanced wastewater treatment complex and all fluid handling and disposal services for Antero • Fresh water delivery assets provide fresh water to support Marcellus and Utica well completions – Year-round water supply sources: Clearwater Facility, Ohio River, local rivers & reservoirs(2) – 100% fixed fee long term contracts Note: Antero acreage position reflects tax districts in which greater than 3,000 net acres are owned. 1. All Antero water withdrawal sites are fully permitted under long-term state regulatory permits both in WV and OH. 2. Based on 2016 capital budget. 3. Marcellus assumes fee of $3.69 per barrel subject to annual inflation and 40 barrels of water per lateral foot that utilize the fresh water delivery system based on 9,000 foot lateral. Operating margin excludes G&A. Utica assumes fee of $3.64 per barrel subject to annual inflation and 37 barrels of water per lateral foot that utilize the fresh water delivery system based on 9,000 foot lateral. Water volumes assume 5% recycling. Operating margin excludes G&A. Antero Clearwater advanced wastewater treatment facility currently under construction – connects to Antero freshwater delivery system Projected Water Business Infrastructure(1) Marcellus Shale Utica Shale Total YE 2016E Cumulative Fresh Water Delivery Capex ($MM) (2) $509 $72 $581 Water Pipelines (Miles) 203 83 286 Fresh Water Storage Impoundments 23 13 36 2017E Fresh Water Delivery Capex Budget ($MM) $50 $25 $75 Water Pipelines (Miles) 28 9 37 Fresh Water Storage Impoundments 3 1 4 Cash Operating Margin per Well(3) $1.0MM - $1.1MM $925k - $975k 2017E Advanced Waste Water Treatment Budget ($MM) $100 2017E Total Water Business Budget ($MM) $175
  • 36. 0 10,000 20,000 30,000 40,000 50,000 60,000 70,000 80,000 Antero Clearwater Advanced Wastewater Treatment Capacity (Bbl/d) Produced/Flowback Volumes (Bbl/d) Illustrative Produced & Flowback Water VolumesAdvanced Wastewater Treatment Antero Produced Water Services and Freshwater Delivery Business Antero Advanced Wastewater Treatment 3rd Party Recycling and Well Disposal (Bbl/d) Advanced Wastewater Treatment Complex Estimated capital expenditures ($ million)(1) ~$275 Standalone EBITDA at 100% utilization(2) ~$55 – $65 Implied investment to standalone EBITDA build-out multiple ~4x – 5x Estimated per well savings to Antero Resources ~$150,000 Estimated in-service date Late 2017 Operating capacity (Bbl/d) 60,000 Operating agreement • Antero has contracted with Veolia to build the largest advanced wastewater treatment complex in the world for oil and gas produced water • Veolia will build and operate, and Antero will fund and own the Clearwater facility − Will treat and recycle AR produced and flowback water − Creates additional year-round water source for completions − Will have capacity for significant third party business 1. Includes capital to construct pipeline to connect facility to freshwater delivery system. Includes $10 million that AR agreed to fund in the drop down transaction. 2. Standalone EBITDA projection assumes inter-company fixed fee for recycling of $4.00 per barrel and 60,000 barrels per day of capacity. Does not include potential sales of marketable byproducts. 20 Years, Extendable Integrated Water Business Antero Advanced Wastewater Treatment Freshwater delivery system Flowback and produced Water Well Pad Well Pad Completion Operations Producing Freshwater Salt Calcium Chloride Marketable byproduct Marketable byproduct used in oil and gas operations Freshwater delivery system ANTERO MIDSTREAM ADVANCED WASTEWATER TREATMENT ASSET OVERVIEW Capacity for third party business 35
  • 37. AM UPSIDE OPPORTUNITY SET 36 ACTIVITY CURRENTLY DEDICATED TO AM Third Party Business Transportation and Marketing • Opportunity to expand fresh water, waste water and gathering/compression services to third parties in Marcellus and Utica to enhance asset utilization • AR must request a bid from AM and can only reject if third party service fees are lower. AM has right to match lower fee offer. WV/PA Utica Dry Gas • 247,000 gross acres of AR Utica dry gas acreage underlying the Marcellus in West Virginia and Pennsylvania dedicated to AM • AR has drilled and completed its first WV Utica well AR Acreage Consolidation • Future acreage acquisitions by AR are dedicated to AM for gathering, compression, processing and water services (excluding existing third-party and/or JV dedications)
  • 38. Low Cost Marcellus/Utica Focus “Best-in-Class” Distribution Growth 37 CATALYSTS • 30% for 2016 and 28% to 30% through 2020 targeted based on sponsor targeted production CAGR of 20% to 22% through 2020 • AM sponsor is the most active operator in Appalachia; 20% - 25% production growth guidance for 2017 supported by $1.5 billion capital budget, firm processing and takeaway, long-term natural gas hedges and $4.1 billion of liquidity • AR targeting 20% to 22% production CAGR through 2020 • Sponsor operations target two of the lowest cost shale plays in North America • Attractive well economics support continued drilling at current prices • $2.7 billion of capital investment opportunities from 2017 – 2020; additional third party business expansion opportunities Appalachian Basin Midstream Growth High Growth Sponsor Production Profile 1 2 3 4 5 6 • Acquisition of integrated water business from AR expected to result in distributable cash flow per unit accretion in 2017+ Consolidation and Stacked Pay Upside • AR plans to continue to consolidate Marcellus/Utica acreage • Development of Utica Shale Dry Gas resource will provide further midstream infrastructure expansion opportunities Integrated Water Business Drop Down 7 • Established key partnership with MPLX to expand AM’s full value chain organic growth strategy and enhance long-term distribution growth Processing & Fractionation Joint Venture
  • 40. Key Variable 2017 Previous Guidance 2017 Updated Guidance(1) Financial: Net Income ($MM) $295 – $335 $305 – $345 Adjusted EBITDA ($MM) $510 – $550 $520 – $560 Distributable Cash Flow ($MM) $395 – $435 $405 – $445 Year-over-Year Distribution Growth 28% – 30% 28% – 30% DCF Coverage Ratio 1.30x – 1.45x 1.30x – 1.45x Operating: Gathering Pipelines (Miles) 35 35 Compression Capacity Added (MMcf/d) 490 490 Fresh Water Pipeline Added (Miles) 37 37 Fresh Water Impoundments 4 4 Capital Expenditures ($MM): Gathering and Compression Infrastructure $350 $350 Fresh Water Infrastructure $75 $75 Advanced Wastewater Treatment $100 $100 Processing and Fractionation Joint Venture – $275 Total Capital Expenditures ($MM) $525 $800 ANTERO MIDSTREAM – 2017 GUIDANCE Key Operating & Financial Assumptions 391. Per press release dated 2/6/2017.
  • 41. Liquid “non-E&P assets” of $5.3 Bn significantly exceeds total debt of $3.7 billion pro forma for recent transactions Pro Forma Liquidity Antero Resources (NYSE:AR) Antero Midstream (NYSE:AM) Pro Forma 9/30/2016 Debt(1) Liquid Non-E&P Assets 9/30/2016 Debt (1) Liquid Assets Debt Type $MM Credit facility $208 6.00% senior notes due 2020 - 5.375% senior notes due 2021 1,000 5.125% senior notes due 2022 1,100 5.625% senior notes due 2023 750 5.00% senior notes due 2025 600 Total $3,658 Asset Type $MM Commodity derivatives(2) $1,600 AM equity ownership(3) 3,691 Cash 10 Total $5,301 Asset Type $MM Cash $10 Credit facility – commitments(4) 4,000 Credit facility – drawn (208) Credit facility – letters of credit (709) Total $3,093 Debt Type $MM Credit facility $167 5.375% senior notes due 2024 650 Total $817 Asset Type $MM Cash $9 Total $9 Liquidity Asset Type $MM Cash $9 Credit facility – capacity 1,157 Credit facility – drawn (167) Credit facility – letters of credit - Total $999 Approximately $3.1 billion of liquidity at AR pro forma for recent transactions plus an additional $3.1 billion of AM units Approximately $1.0 billion of liquidity at AM following recent senior notes offering 40 Only 14% of AM credit facility capacity drawn following recent $650 million senior notes offering 1. AR balance sheet data as of 9/30/2016. Antero Resources pro forma for $175 million private placement on 10/3/2016, $170 million AR acreage divestiture closed on 12/16/2016 and $600 million 5.00% AR senior note offering closed on 12/21/2016 to refinance $525 million 6% senior notes due 2020 callable at 103% and including transaction expenses. Antero Midstream credit facility as of 2/3/2017 pro forma for 6.0 million unit offering on 2/6/2017 with gross proceeds of $198 million used to fund $155 million MPLX JV payment. 2. Mark-to-market as of 12/31/2016. 3. Based on AR ownership of AM units and closing price as of 2/6/2017. 4. AR credit facility commitments of $4.0 billion, borrowing base of $4.75 billion. STRONG BALANCE SHEET AND HIGH FLEXIBILITY
  • 42. 2017 CAPITAL BUDGET By Area 41 $480 Million – 2016 By Segment ($MM) By Area $800 Million – 2017 By Segment ($MM)  Antero Midstream’s 2017 capital budget is $800 million, a 67% increase from the 2016 capital budget of $480 million, including $275 for the processing and fractionation JV announced on 2/6/2017 130 Completions $255 53% $50 11% $130 27% $45 9% Gathering and Compression Fresh Water Advanced Wastewater Treatment Stonewall Marcellus $456 95% Utica $24 5% $350 44% $75 9% $100 13% $275 34% Marcellus $680 85% Utica $120 15% Advanced Wastewater Treatment Fresh Water Gathering and Compression Processing and Fractionation
  • 43. Antero Long Term Firm Processing & Takeaway Position (YE 2018) – Accessing Favorable Markets Mariner East 2 62 MBbl/d Commitment Marcus Hook Export Shell 30 MBbl/d Commitment Beaver County Cracker (2) Sabine Pass (Trains 1-4) 50 MMcf/d per Train (T1 and T2 in-service) Lake Charles LNG(3) 150 MMcf/d Freeport LNG 70 MMcf/d 1. February 2017 and full year 2017 futures basis, respectively, provided by Intercontinental Exchange dated 12/30/2016. Favorable markets shaded in green. 2. Shell announced final investment decision (FID) on 6/7/2016. 3. Lake Charles LNG 150 MMcf/d commitment subject to Shell FID. Chicago(1) $0.17 / $(0.04) CGTLA(1) $(0.10) / $(0.09) TCO(1) $(0.23) / $(0.24) 42 Cove Point LNG4.85 Bcf/d Firm Gas Takeaway By YE 2018 YE 2018 Gas Market Mix Antero 4.85 Bcf/d FT 44% Gulf Coast 17% Midwest 13% Atlantic Seaboard 13% Dom S/TETCO (PA) 13% TCO Expect NYMEX-plus pricing per Mcf Antero Commitments (3) (2) Dom South(1) $(0.57) / $(1.19) LARGEST FT PORTFOLIO IN NORTHEAST
  • 44. KEY APPALACHIAN TAKEAWAY PROJECTS TranscoAtlanticSunrise– Mid-2018(1.7Bcf/d) 4.8 Bcf/d 5.9 Bcf/d 3.5 Bcf/d 1.8 Bcf/d Antero Producing Areas Source: Public filings and press releases. Excludes TETCO expansions. 1. 1.05 Bcf/d capacity available to move gas from Leach to the Gulf on CGT Rayne Xpress. 2. 860 MMcf/d of capacity available on CGT Gulf Xpress to move gas to the Gulf Coast markets. Antero firm transportation commitment Based on current publicly disclosed in-service dates, by the end of 2019, nine major incremental projects are expected to be in service, resulting in new takeaway capacity of nearly 17 Bcf/d Not included on Map TETCO Expansion (972 MMcf/d) 43
  • 45. 3,250 3,972 1,700 1,750 4,660 1,500 16,832 0 2,000 4,000 6,000 8,000 10,000 12,000 14,000 16,000 18,000 (2Q 2017) (4Q 2017) (2Q 2018) (2H 2018) (4Q 2018) (4Q 2019) Total Incremental Capacity MMcf/d 700 MMcf/d 44 KEY APPALACHIAN NEW TAKEAWAY PROJECTS: UNLOCKING THE NORTHEAST Nexus (1,500) TETCO Expansion (972) Leach Xpress/CGT Rayne (1,500) PennEast (1,100) Mountaineer/ CGT Gulf Xpress (2,660) Mountain Valley (2,000) Atlantic Sunrise Rover Atlantic Coast 3Q 2017 3.3 4Q 2017 7.2 2Q 2018 8.9 2H 2018 10.7 4Q 2018 15.3 4Q 2019 16.8 Total Constitution (650) Cumulative Capacity (Bcf/d) Total New Incremental FT Capacity by Year-End 2019 By year-end 2019, an incremental 16.8 Bcf/day of new takeaway capacity is expected to be in service in Appalachia 16.8 800 MMcf/d
  • 46. Ethane – In service Ethane – Proposed C3+ NGLs – In service C3+ NGLs – Proposed 45 NORTHEAST TAKEAWAY ACCESSES ALL MAJOR NGL MARKETS Note: Project capacities and in-service date per latest Company estimates. More NGL infrastructure to be built to support growing liquids production in Appalachia presents additional opportunities for downstream investment
  • 47. 132 96 MVC 90 MVC 100 MVC 120 MVC 120 0 20 40 60 80 100 120 140 160 180 200 2014 2015 2016 2017 2018 2019 2020 MBbl/d SUSTAINABLE WATER BUSINESS GROWTH 46 Long-term production growth drives substantial water business growth in 2017 and beyond, underpinned by minimum volume commitments 177Completions ~110Completions (Guidance) 2020 Earn Out – 200 MBbl/d Avg 131Completions ~170Completions (Guidance) Fresh Water Delivery Volumes (MBbl/d) “Traditional” Completions “Advanced” Completions utilizing 25% more water 2019 Earn Out – 161 MBbl/d Avg
  • 48. LTM Production NTM Production Forecast Average LTM Production MAINTENANCE CAPITAL METHODOLOGY • Maintenance Capital Calculation Methodology – Low Pressure Gathering – Estimate the number of new well connections needed during the forecast period in order to offset the natural production decline and maintain the average throughput volume on our system over the LTM period – (1) Compare this number of well connections to the total number of well connections estimated to be made during such period, and – (2) Designate an equal percentage of our estimated low pressure gathering capital expenditures as maintenance capital expenditures Maintenance capital expenditures are cash expenditures (including expenditures for the construction or development of new capital assets or the replacement, improvement or expansion of existing capital assets) made to maintain, over the long term, our operating capacity or revenue • Illustrative Example LTM Forecast Period Decline of LTM average throughput to be replaced with production volume from new well connections 47 • Maintenance Capital Calculation Methodology – Fresh Water Distribution − Estimate the number of wells to which we would need to distribute fresh water during the forecast period in order to maintain the average fresh water throughput volume on our system over the LTM period − (1) Compare this number of wells to the total number of new wells to which we expect to distribute fresh water during such period, and − (2) Designate an equal percentage of our estimated water line capital expenditures as maintenance capital expenditures
  • 49. ANTERO RESOURCES EBITDAX RECONCILIATION 48 EBITDAX Reconciliation ($ in millions) Quarter Ended LTM Ended 9/30/2016 9/30/2016 EBITDAX: Net income including noncontrolling interest $268.2 $(121.1) Commodity derivative fair value (gains) (530.4) (670.7) Net cash receipts on settled derivatives instruments 196.7 1,083.5 Interest expense 59.8 246.1 Income tax expense (benefit) 140.9 (153.6) Depreciation, depletion, amortization and accretion 199.7 752.1 Impairment of unproved properties 11.8 107.9 Exploration expense 1.2 4.0 Equity-based compensation expense 26.4 94.3 Equity in earnings of unconsolidated affiliate (1.5) (2.0) Contract termination and rig stacking 0.0 27.6 Consolidated Adjusted EBITDAX $372.8 $1,368.1
  • 50. ANTERO MIDSTREAM EBITDA RECONCILIATION 49 EBITDA and DCF Reconciliation $ in thousands Nine months ended September 30, 2015 2016 Reconciliation of Net Income to Adjusted EBITDA and Distributable Cash Flow: Net income $110,097 $163,352 Interest expense 5,266 12,885 Depreciation expense 63,515 74,100 Accretion of contingent acquisition consideration - 10,384 Equity-based compensation 17,663 19,366 Equity in earnings from unconsolidated affiliate - (2,027) Adjusted EBITDA $196,541 $278,060 Pre-Water Acquisition net income attributed to parent (40,193) - Pre-Water Acquisition depreciation expense attributed to parent (18,767) - Pre-Water Acquisition equity-based compensation expense attributed to parent (3,445) - Pre-Water Acquisition interest expense attributed to parent (2,326) - Adjusted EBITDA attributable to the Partnership 131,810 278,060 Cash interest paid - attributable to Partnership (2,215) (11,751) Cash reserved for payment of income tax witholding upon vesting of Antero Midstream LP equity-based compensation awards - (3,000) Cash to be received from unconsolidated affiliate - 2,998 Maintenance capital expenditures attributable to Partnership (10,001) (16,156) Distributable Cash Flow $119,594 $250,151
  • 51. CAUTIONARY NOTE The SEC permits oil and gas companies, in their filings with the SEC, to disclose only proved, probable and possible reserve estimates (collectively, “3P”). Antero has provided internally generated estimates for proved, probable and possible reserves in this presentation in accordance with SEC guidelines and definitions, which have been audited by Antero’s third-party engineers. Unless otherwise noted, reserve estimates as of December 31, 2016 assume ethane rejection and strip pricing. Actual quantities that may be ultimately recovered from Antero’s interests may differ substantially from the estimates in this presentation. Factors affecting ultimate recovery include the scope of Antero’s ongoing drilling program, which will be directly affected by commodity prices, the availability of capital, drilling and production costs, availability of drilling services and equipment, drilling results, lease expirations, transportation constraints, regulatory approvals and other factors, and actual drilling results, including geological and mechanical factors affecting recovery rates. In this presentation: • “3P reserves” refer to Antero’s estimated aggregate proved, probable and possible reserves as of December 31, 2016. The SEC prohibits companies from aggregating proved, probable and possible reserves in filings with the SEC due to the different levels of certainty associated with each reserve category. • “EUR,” or “Estimated Ultimate Recovery,” refers to Antero’s internal estimates of per well hydrocarbon quantities that may be potentially recovered from a hypothetical future well completed as a producer in the area. These quantities do not necessarily constitute or represent reserves within the meaning of the Society of Petroleum Engineer’s Petroleum Resource Management System or the SEC’s oil and natural gas disclosure rules. • “Condensate” refers to gas having a heat content between 1250 BTU and 1300 BTU in the Utica Shale. • “Highly-rich gas/condensate” refers to gas having a heat content between 1275 BTU and 1350 BTU in the Marcellus Shale and 1225 BTU and 1250 BTU in the Utica Shale. • “Highly-rich gas” refers to gas having a heat content between 1200 BTU and 1275 BTU in the Marcellus Shale and 1200 BTU and 1225 BTU in the Utica Shale. • “Rich gas” refers to gas having a heat content of between 1100 BTU and 1200 BTU. • “Dry gas” refers to gas containing insufficient quantities of hydrocarbons heavier than methane to allow their commercial extraction or to require their removal in order to render the gas suitable for fuel use. Regarding Hydrocarbon Quantities 50