Background:
Pente Grammai is an ancient Greek board game, played with two opposing players and involves the rolling of dice (values 1-6) in order to traverse the board in a counter-clockwise manner.
Figure 1. Initial Setup
Figure 2. Playable Squares
Rules:
The initial setup for Pente Grammai is illustrated in Figure 1, with the green circles representing player 1, and red circles player 2. The figure also illustrates how the players can traverse the board, with both red and green moving in the direction of the arrows, based on a die roll at the beginning of the turn. Each player can choose to move a single piece, with the only restriction being that the piece can’t land on an occupied square.
While the player follows the arrows, the space where the red and green circles are placed in Figure 1, are not the only playable ones. As illustrated by Figure 2 in yellow, the squares along the two vertical lines are also playable. These serve as extra spots for the square at the base of the vertical line. Thus, if the rightmost red piece in Figure 1, rolls a three, the piece would land at the base of the top vertical line. Since the base square is already occupied, the red piece will be placed at the next empty spot on the vertical line. Moving a piece to the vertical line is only possible if a piece is supposed to land at the base of the line.
The line filled with yellow circles in Figure 2, is called the sacred line. If a piece lands there, the player earns an extra turn with a new die roll. It is possible to play several turns in a row if a player keeps landing on the sacred line.
A player is obligated to play on his turn, if a legal move is possible. An illegal move constitutes moving to an occupied spot. If no legal moves are available, then the player can forfeit his turn.
Example Turn:
Figure 4
Figure 5
Figure 3
In Figure 3, it is the red player’s turn and a 2 has been rolled. With most regular squares occupied, red only has two options which involve moving to either the top or bottom sacred line. The two moves are illustrated in Figures 4 and 5.
For Figure 4, the base is empty so the red piece can safely move there. For Figure 5, the base spot is occupied by a green square, but since the sacred line is effectively a collection of extra spaces for the base, red can move to the next empty spot on the top sacred line.
Victory Conditions:
If a player places all of his pieces on the sacred line opposite from his starting position, then he wins. Based on Figure 1, red needs to move his pieces to the top sacred line, while green’s goal is bottom sacred line.
Problem Description:
You are to implement the game of Pente Grammai, as described in the section above, for two human players. The game should not permit illegal moves. You must implement three ADTs, one for a player, one for the board, and one for the referee. Additional ADTs are allowed, but you must implement a minimum of three ADTs.
Figure 6
Tasks: ...
WEEK 7 – EXERCISES Enter your answers in the spaces pr.docxwendolynhalbert
WEEK 7 – EXERCISES
Enter your answers in the spaces provided. Save the file using your last name as the beginning of the file name (e.g., ruf_week6_exercises) and submit via “Assignments.” When appropriate,
show your work
. You can do the work by hand, scan/take a digital picture, and attach that file with your work.
A sports researcher gave a standard written test of eating habits to 12 randomly selected professionals, four each from baseball, football, and basketball. The results were as follows:
Eating Habits Scores
Baseball Players
Football Players
Basketball Players
34
27
35
18
28
44
21
67
47
65
42
61
Is there a difference in eating habits among professionals in the three sports? (Use the .05 significance level.)
a.
Use the five steps of hypothesis testing.
b.
Sketch the distribution involved.
c.
Determine effect size.
2.
To study the effectiveness of treatments for insomnia, a sleep researcher conducted a study with 12 participants.
Four participants were instructed to count sheep (Sheep Condition), four were told to concentrate on their breathing (Breathing Condition), and four were not given any special instructions. Over the next few days, measures were taken of how many minutes it took each participant to fall asleep. The average times for the participants in the Sheep Condition were 14, 28, 27, and 31; for those in the Breathing Condition, 25, 22, 17, and 14; and for those in the control condition, 45, 33, 30, and 41.
Do these results suggest that the different techniques have different effects?
(Use the .05 significance level.)
a.
Use the five steps of hypothesis testing.
b.
Sketch the distribution involved.
c.
Figure the effect size of the study.
d.
Explain your findings (including the logic of comparing within-group to between-group population variance estimates, how each of these is figured, and the
F
distribution).
High school juniors planning to attend college were randomly assigned to view one of four videos about a particular college, each differing according to what aspect of college life was emphasized: athletics, social life, scholarship, or artistic/cultural opportunities. After viewing the videos, the students took a test measuring their desire to attend this college. The results were as follows:
Desire to Attend this College
Athletics
Social Life
Scholarship
Art/Cultural
68
89
74
76
56
78
82
71
69
81
79
69
70
77
80
65
Do these results suggest that the type of activity emphasized in a college film affects desire to attend that college? (Use the .01 significance level.)
a.
Use the five steps of hypothesis testing.
b.
Sketch the distribution involved.
c.
Figure the effect size of the study.
d.
Explain the logic of what you have done to a person who is unfamiliar with the analysis of variance.
A team of psychologists designed a study in which 12 psychiatric patients diagnosed as having generalized anxiety disorder were randomly assigned to one of three new types of th.
Strengths-based nursing (SBN) is an approach to care in which eigh.docxcpatriciarpatricia
Strengths-based nursing (SBN) is an approach to care in which eight core values which guide nursing action, thereby promoting empowerment, hope and self-efficacy. In caring for patients and families, the nurse focuses on their inner and outer strengths-that is, on what patients and families do that best helps them deal with problems and minimize deficits. SBN creating environments and experiences that better enable patients and their families to take control over their lives and health care decisions.
SBN respects a person's self-knowledge and values choice and self-determination, even though there are always limits to the choices available and a person's ability to act in her or his own interest is affected by circumstances, knowledge, and predisposition. it is as important to consider patients' deficits as it is to consider their strengths; both are essential aspects of the whole person. The current health care system is changing into a new system that focuses more on community-based and primary care with the hospitals forming the pillar of the health care system although they are not the primary service (Lind and Smith, 2008). This change has brought about a strength based nursing care which is aimed at developing an individual’s strength to encourage and help in healing. From the perspective of SBN, the nurse's role is to help patients achieve their goals in the healthiest possible way.
SBN sees the nurse's role not as deciding for others but rather as listening attentively and deeply in order to clarify, elaborate, explain, provide information, make suggestions, connect people with resources, and advocate for patients and their families so they may hear their own voices and make their voices heard. Strengths-Based Care (SBC) requires that the nurse use a process to uncover the person’s concerns, get to know the patient and members of the family as individuals, and discover their strengths in order to plan and carry out nursing care.
Nurses require strong nursing leadership to enable them practice strength-based nursing care. Strength based nursing care has a prospective of becoming a game changer in nursing and also revolutionize healthcare. In this approach the focus is redirected from shortages and crisis to use of strength of resources to deal with problems and overcome any shortcomings (Gottlieb, 2012). The medical model need not be a deficit model. The two are not mutually exclusive. Physicians can diagnose and treat problems and also have a strengths perspective and practice whole-person care.
HOLMES INSTITUTE
FACULTY OF
HIGHER EDUCATION
HS1031 Introduction to Programming – Assignment I
Assessment Details and Submission Guidelines
Trimester T1 2019
Unit Code HS1031
Unit Title Introduction to Programming
Assessment Type Individual Assignment
Assessment Title Assignment I
Purpose of the
assessment (with ULO
Mapping)
Assess student’s ability to develop algorithmic solutions to programming problems.
This document provides an introduction to a unit on organizing, summarizing, and interpreting data. It outlines the materials and expectations for the online lessons. The first lesson will focus on defining data and different ways of collecting and analyzing it. Students will then learn about classifying data by type and number of variables. The lesson will demonstrate displaying data using graphs like histograms, frequency tables, and box plots. It will also cover describing data distributions and comparing data sets using measures of center, spread, and shape.
This document provides information about getting fully solved assignments for MBA students. It details contact information for an assignment help service via email or phone call, and provides a sample assignment question document. The sample assignment covers topics in statistics, including probability, sampling, hypothesis testing, analysis of variance, index numbers, and includes 6 questions with sub-questions and evaluation criteria. Students are instructed to answer all questions, with approximately 400 word answers for 10 mark questions.
The 7 QC tools are statistical problem solving methods introduced in Japan after World War II. The most important tools are: 1) Pareto diagram, which identifies the major issues contributing to the most problems; 2) Cause and effect diagram, also known as a fishbone diagram, which maps the causes of a problem systematically; and 3) Histogram, which analyzes the distribution of data through bar charts of frequency distributions to identify patterns and draw conclusions about process control. These tools were foundational to Japan's post-war industrial recovery.
This document discusses testing claims about the proportions of different colored M&Ms in multiple bags of M&Ms. It performs z-tests to test hypotheses about the true proportions of blue, orange, yellow, red and brown M&Ms, based on sample proportions calculated from counting M&Ms in bags. It rejects some claims, such as the claim that the true proportion of green M&Ms is 0.16, but fails to reject other claims, such as the claim that the true proportion of blue M&Ms is 0.24. The document also discusses constructing 95% confidence intervals for the proportions of different colors.
UNIT 3
SUCCESS GUIDE
1 | GB 513 Unit 3 Success Guide v.6.13.17
UNIT 3 SUCCESS GUIDE
This unit is the other “most difficult” one. Hypothesis testing has two parts: setting-up
the hypotheses and calculating the critical values to determine results. They both
pose difficulty for a lot of students. The seminar will be on the first and the recorded
lecture will be on the second. You need to make sure you understand both,
otherwise you will not be able to get to the right conclusions.
1. As always, start by reading the chapters and studying the solved examples.
2. Watch the lecture video in document sharing. It focuses on why we do
hypothesis testing, how to do it with Excel and solves two sample problems.
3. Watch this from Khan Academy:
https://www.khanacademy.org/math/statistics-probability/significance-
tests-one-sample/tests-about-population-mean/v/hypothesis-testing-and-p-
values
This one talks more about how to write the null and alternative hypotheses
(which a lot of students get wrong) and also solves the problem using
formulas.
4. Watch the sample problem solutions in Course Resources.
5. If you still want more videos, search YouTube for “hypothesis testing.” Several
introductory level videos are available, such as
https://www.youtube.com/watch?v=HmMjS88eSVE and
https://www.youtube.com/watch?v=0zZYBALbZgg
Email your instructor if you find any of these links to be broken.
Avoid these mistakes!
GENERAL NOTES
RESOURCES
COMMON MISTAKES IN THE ASSIGNMENT
https://www.khanacademy.org/math/statistics-probability/significance-tests-one-sample/tests-about-population-mean/v/hypothesis-testing-and-p-values
http://www.youtube.com/watch?v=HmMjS88eSVE
http://www.youtube.com/watch?v=0zZYBALbZgg
2 | GB 513 Unit 3 Success Guide v.6.13.17
Students commonly get the null and alternative hypotheses reversed, or
get them completely wrong.
Students also commonly do not state the hypothesis fully. This is correct:
“null hypothesis: there is no difference between the average salary for
group 1 and the average salary of group 2.” This is not sufficient: “ho:
x1=x2”
Students sometimes compare the averages of the two groups and base
their determination on which one is greater, rather than properly doing a
hypothesis test.
Students sometimes do the calculations correctly, but do not write out
what the conclusion is. This is correct: “We therefore reject the null
hypothesis, which means we conclude that there i ...
e-Portfolio for Lab-Based Statistics (PSYC 3100) part 1Ella Anwar
This e-portfolio describes Siti Suhaila Binti Khairil-Anwar's lab-based statistics project conducted in semester 1 of 2014/2015. The project involved collecting data using an Agreeableness scale and Attitudes Towards Women scale. The document outlines the steps taken to enter the data into SPSS, transform and recode the variables, name the variables, screen the data for errors, and check the normal distribution of the data. Key steps included recoding agreeableness and attitudes scores into high, medium, and low levels and correcting errors identified during data screening. Distribution of the data was assessed using histograms, P-P plots, and Q-Q plots, with results indicating the data were
Nonparametric Test Chi-Square Test for Independence Th.docxpauline234567
Nonparametric Test
Chi-Square Test for Independence
The test is used to determine whether two categorical variables are independent.
Notation for the Chi-Square Test for Independence (Please note that the notation varies
depending on the text)
O represents the observed frequency of an outcome
E represents the expected frequency of an outcome
r represents the number of rows in the contingency table
c represents the number of columns in the contingency table
n represents the total number of trials
Test Statistic
2
2
1 1
O E
E
df r c
The Chi-Square test is a hypothesis test. There are seven steps for a hypothesis test.
1. State the null hypothesis
2. State the alternative hypothesis
3. State the level of significance
4. State the test statistic
5. Calculate
6. Statistical Conclusion
7. Experimental Conclusion
Example
A university is interested to know if the choice of major has a relationship to gender. A
random sample of 200 incoming freshmen students was taken (100 male and 100
female). There major and gender were recorded. The results are shown in the
contingency table below.
Major Female Male
Math 5 15
Nursing 44 10
English 10 10
Pre-Med 17 20
History 4 5
Education 15 20
Undecided 5 20
To determine if there is a relationship between the gender of a freshmen student and
thei declared major perform the hypothesis test (Use level of significance 0.05 ) .
Step 1: Null Hypothesis
0 : Gender and Major of Freshmen students are independentH
Step 2: Alternative Hypothesis
: Gender and Major of Freshmen students are not independentAH
Step 3: Level of Significance
0.05
Step 4: Test Statistic
2
2
1 1
O E
E
df r c
Step 5: Calculations
There are several calculations for this test. We have to find the expected frequency for
each cell in the contingency table. The expected frequency is the probability under the
null hypothesis times the total frequency for the given row. Here the probability under
the null hypothesis is .5, as the probability of being male and female is equal.
rE pn
Major Female Male
Math 1 .5 20 10E 2 .5 20 10E
Nursing 3 .5 54 27E 4 .5 54 27E
English 5 .5 20 10E 6 .5 20 10E
Pre-Med 7 .5 37 18.5E 8 .5 37 18.5E
History 9 .5 9 4.5E 10 .5 9 4.5E
Education 11 .5 35 17.5E 12 .5 35 17.5E
Undecided 13 .5 25 12.5E 14 .5 25 12.5E
Know calculate the test statistic.
2
2
2 2 2 2
2
2 2 2 2
2 2 2 2
2 2
2
5 10 15 10 44 27 10 27
10 10 27 27
10 10 10 10 17 18.5 20 18.5
10 10 18.5 18.5
4 4.5 5 4.5 15 17.5 20 17.5
4.5 4.5 17.5 17.5
5 12.5 20 12.5
12.5 12.5
2.5 2.5 10.7 10.7 0 0 .1216
obs
ob.
1) The experiment tested whether a "momentum effect" could counteract the endowment effect by measuring changes in subjects' willingness to trade goods between experimental periods.
2) Results showed willingness to trade doubled on average between periods 1 and 2, supporting the momentum effect. Most subjects adjusted in ways consistent with momentum rotation.
3) Graphs and statistical analysis of changes in preferred bundles indicated 60-80% of subjects behaved in a manner supporting the momentum trading theory, with momentum adjustments being over 5 times larger than anti-momentum adjustments on average.
2. week 2 data presentation and organizationrenz50
Here are the answers to the questions:
A.
1. The variables in the graph are age (x-axis) and frequency (y-axis).
2. The variables are quantitative.
3. The variables are discrete.
4. No, a pie chart could not be used to display this data since it involves quantitative variables rather than categorical variables.
B.
1. A line graph would most appropriately represent the number of students enrolled at a local college for each year during the last 5 years. This involves two quantitative variables - years on the x-axis and enrollments on the y-axis.
2. A bar graph would most appropriately represent the frequency of each type of crime committed in
This document provides information on statistics and probability sampling methods. It defines statistics as the science of collecting, organizing, summarizing, analyzing, and interpreting data. It describes the four main components of statistics as data collection, presentation, analysis, and interpretation. It also lists seven key characteristics of statistics. The document then discusses probability concepts like probability, experiments, outcomes, and definitions. It provides an example to calculate probabilities. Finally, it describes various probability sampling methods like simple random sampling, stratified random sampling, systematic sampling, cluster sampling, and multi-stage sampling as well as non-probability sampling methods like judgment sampling, convenience sampling, and quota sampling.
1. The document discusses statistical analysis techniques for describing and comparing data sets, including calculating the mean, standard deviation, and using t-tests.
2. It explains how to calculate the mean and standard deviation of data sets to analyze the central tendency and variability. The standard deviation summarizes how tightly values cluster around the mean.
3. T-tests are used to determine if differences between two data sets are statistically significant by comparing the means relative to the standard deviations and considering the degree of overlap between the sets.
This document provides a summary of key concepts in advanced business mathematics and statistics. It defines measures of central tendency including mean, mode, and median. It also discusses measures of dispersion like range and standard deviation. Additionally, it covers topics like regression, hypothesis testing, probability, and different types of statistical analysis.
This document provides an overview of biostatistics. It defines biostatistics as the application of statistics to biology, medicine, and public health. It discusses different types of data, measures of central tendency including mean, median and mode, and graphical representations such as line graphs, bar diagrams and pie charts. The document emphasizes the important role of biostatistics in medical research and clinical decision making. It acknowledges deficiencies in biostatistical literacy among medical students and professionals.
The document discusses data commentary and provides guidance on its purpose, structure, and key elements. It explains that a data commentary presents results, interprets results, and discusses the significance and implications of results. It also provides tips on highlighting data, writing paragraphs, linking clauses, and qualifying claims.
The document discusses data commentary and provides guidance on its structure and components. It explains that a data commentary presents results, interprets them, and discusses implications. It provides details on highlighting statements, implications, and qualifying claims. Structure includes location elements, highlights, and implications. Guidelines are given for active and passive voice as well as linking and qualifying statements.
This document provides an assignment for a statistics course. It contains 6 questions covering topics like descriptive statistics, probability, sampling, hypothesis testing, analysis of variance, and index numbers. Students are asked to answer the questions in approximately 400 words each. They are provided with the evaluation scheme and instructed to submit their answers via email or phone for review and feedback.
Homework #1SOCY 3115Spring 20Read the Syllabus and FAQ on ho.docxpooleavelina
Homework #1
SOCY 3115
Spring 20
Read the Syllabus and FAQ on how to do your homework before beginning the assignment!
To get consideration for full credit, you must:
· Follow directions;
· Show all work required to arrive at answer (statistical calculations often require multiple steps, so you need to write these down, not just skip to the final answer)
· Use appropriate statistical notation at all times (e.g. if you are calculating a population mean, begin with the equation for population mean)
· Use units in your answer, where appropriate (e.g. a mean time would be “6.5 hours” rather than just “6.5”)
Understanding the Structure of Data
1. For the following rectangular dataset:
Id
Highest degree
Works full-time
Annual income cat
1
Did not grad HS
Yes
Low
2
HS dip
Yes
Low
3
HS dip
No
Med
4
BA
No
Low
5
BA
Yes
Med
6
MA
Yes
High
7
HS dip
Yes
Med
a. What is the unit-of-analysis of the dataset?
b. How many variables are in the dataset?
c. How many observations/cases are in the dataset?
d. For eachvariable that is not named “id”:
i. What is the variable name?
ii. What is the level-of-measurement?
iii. What are the values for the variable?
iv. If you had to make a guess, what do you think the “question” was that was asked of the unit-of-analysis to get these data? (for example, if we had a continuous variable called “num_pets” the question might be “How many pets live in your household?”)
2. For the following rectangular dataset:
Id
num_bdrms
num_bthrms
sqft
Ranch
1
4
3
3200
Yes
2
2
1.5
2800
Yes
3
2
1
1200
Yes
4
3
2
1500
No
5
2
2
1100
No
a. What is the unit-of-analysis of the dataset?
b. How many variables are in the dataset?
c. How many observations/cases are in the dataset?
d. For each variable that is not named “id”:
i. What is the variable name?
ii. What is the level-of-measurement? Before answering, be sure to consult the slide called “Level of measurement – language to use”. Use the formal language!
iii. What are the values for the variable?
iv. If you had to make a guess, what do you think the “question” was that was asked of the unit-of-analysis to get these data? (for example, if we had a continuous variable called “num_pets” the question might be “How many pets live in your household?”)
3. For each of the following questions (1) construct a dataset with one variable and three observations (2) add data that could have theoretically been collected (just make up the actual responses to the question); and (3) indicate the level-of-measurement of the variable. I’ve done two examples for you.
Example#1:
What is your current age? (individual is the unit-of-analysis)
idage
1 25
2 32
3 61
The age variable is continuous/interval ratio.
Example#2:
What is the size of this hospital based on number of beds? (hospital is the unit-of-analysis)? Answers can be small (1-100 beds), medium (101-500 beds), large (501 beds to 1000 beds), extra large (1001+ beds)
idhosp_size
1 med
2 med
3 ext ...
152 pts totalFor Questions 1-2 use the 7 step process to answe.docxsandibabcock
152 pts total
For Questions 1-2 use the 7 step process to answer. Refer to slides if you are unsure of the 7 step process.
PLEASE DON’T OMIT ANY PART OF THE PROCESS!!! (40 pts) THIS IS DONE IN SPSS USING BREAST CANCER AND OBESITY DATASET
Dataset Background – PLEASE READ:
Obesity is very common in American society and is a risk factor for breast cancer for postmenopausal women.
One mechanism explaining why obesity is a risk factor is that it may raise estrogen levels in women.
In particular, one type of estrogen, serum estradiol, is a strong risk factor for breast cancer.
To better assess this relationship, researchers studied a group of 200 postmenopausal women.
The SPSS file is entitled,
Breast Cancer and Obesity
.
Adiposity was measured in two different ways:
(a) by body mass index (BMI) = weight (kg) / height(m
2
) and also (b) by waist-hip ratio (WHR) = waist circumference/hip circumference.
BMI is a measure of overall adiposity, whereas WHR is a measure of abdominal adiposity.
In addition, a complete hormonal profile was obtained, including serum estradiol.
Finally, other breast-cancer risk factors were also assessed among these women, including ethnicity, parity, age at first birth, and age at menarche.
Codebook
Variable
Column
Code
Label
Values (if categorical)
Id
1
Identification number
ES_1
2
Serum Estradiol
ETHNIC
3
Ethnicity
1 = African-American, 0 = Caucasian
NUMCHILD
4
Parity, number of children
AGEFBO
5
Age at 1
st
birth
(missing a response if never had a child)
ANYKIDS
6
Gave birth to any children?
1 = Yes, 0 = No
AGEMENAR
7
Age at menarche
BMI
8
Body Mass Index
WHR
9
Waist-hip ratio
**Missing responses are left blank
ALSO THE FOLLOWING CONTINUOUS VARIABLES HAVE BEEN CATEGORIZED!!
BMI has been categorized, bmi_cat, :
normal BMI (<25) and abnormal BMI (25 or greater).
Menarche has been categorized, menarche_cat, two categories - 9-12 and 13-16
WHR has also been categorized, whr_category, 3 categories - 0-.69, .7-.79, and .8 and greater
1.
Is there a statistically significant difference in mean estradiol between African Americans and Caucasions?
a.
Provide a visual aid depicting the mean differences between the two groups.
2.
Is there a statistically significant difference in mean estradiol between ethnicity status depending on BMI_CAT (using the categorized variable, so normal or abnormal groups)?
3.
Please use the rock climbing performance dataset.
Here is the description:
This is research done by a senior at PSU-Berks.
He was interested in determining the effects of imagery on rock climbing performance.
He chose 20 experienced rock climbers.
With randomization on the order, he had them climb with no imagery on a rock wall and then had them climb with imagery (on a different but same difficulty wall).
Ignoring issues of confounding, can we conclude that imagery decreases rock wall climb time (in seconds)?
(15pts)
a.
What statistical test should be use.
PSCI 2228 Public Interest GroupsThe second written assignment on t.docxkacie8xcheco
PSCI 2228 Public Interest Groups
The second written assignment on the Anthony J. Nownes Book –
INTEREST GROUPS IN AMERICAN SOCIETY.
The topic questions for the written assignment are:
1. Define interest group formation and survival and discuss the barriers to interest group formation and survival.
2. Explain unequal interest group representation.
3. Some lobbying strategies and tactics are more effective than others: Discuss which ones are the most effective.
Five pages.
.
Providing Security Over Data Please respond to the following.docxkacie8xcheco
"Providing Security Over Data" Please respond to the following:
The CIA triad (confidentiality, integrity, and availability) offers three (3) security tenets that allow data owners the framework to secure data. Considering your place of employment or your home computing environment, discuss in detail the primary means in which each of the three (3) tenets are addressed to mitigate risk and enhance security in your chosen environment.
The proliferation of mobile devices to create or access data has had a significant effect on the security concerns surrounding personal and corporate data. From the selected e-Activity article, summarize the attack, and determine the key ways in which you would consider mitigating the threat.
.
Provide two PowerPoint slides thatJustify the use of elements by.docxkacie8xcheco
Provide two PowerPoint slides that
Justify the use of elements by connecting them to various motivations of altruistic behavior as identified in social exchange theory.
*The two elements are provided in the first two slides in the attachment
Provide
pictures and foot notes (200 words each in length).
.
Provide Apples existing mission statement and code of ethics. I.docxkacie8xcheco
Provide Apple's existing mission statement and code of ethics. In what way do they articulate their ethical practices through policies and public outreach and why is this important?
Identify two areas of concern ethically and explain those choices. Make sure to discuss why you feel that are areas of ethical concern. Think critically about where Apple has the potential for ethical dilemmas. For example, an accounting firm would be concerned with fraud.
Rewrite Apple's mission statement. The idea is to provide clarity and set the new strategic direction that you think the company should be moving towards. Include a paragraph explaining the changes that you've made and why.
.
Provide a summary of your research progress thus far, no more th.docxkacie8xcheco
Provide a summary of your research progress thus far,
no more than 1 page single-spaced
. Be sure to describe any of the following that are applicable to what you
have done
: material ordering/acquisition, preliminary trials or methodology validation conducted, experimental trials conducted, results obtained, data analyzed, and conclusions reached.
and answer the attached questions
.
Provide a 250 word answer to the below discussion question in apa fo.docxkacie8xcheco
Provide a 250 word answer to the below discussion question in apa format with in-text citations and references
Research an historic or current servant leader who is a true volunteer in service to others. In what ways does the person inspire leadership while building his or her own character and integrity? How does this leader exemplify the moral obligation to lead through kindness, compassion, and justice?
.
Property. Please respond to the following Evaluating Dolan v. C.docxkacie8xcheco
"Property." Please respond to the following:
Evaluating Dolan v. City of Tigard, as a public administrator, take a position on whether you agree or disagree with the approach that the U.S. Supreme Court developed. Support your position with examples or evidence.
Analyzing Grose v. Sauvegeau, explain with details whether you agree or disagree that Sauvegeau should prevail.
1 Page
.
Properties of LifeChapter 1 of the text highlights the nine pr.docxkacie8xcheco
Properties of Life
Chapter 1 of the text highlights the nine properties of life. Briefly describe each of the nine properties and discuss how things like a virus, prion, and viroid can reproduce, but are not considered to be alive. Address the question: how can things like these that are not considered to be alive “evolve”?
Your assignment should be 250 words in length
DNA and RNA
Compare and contrast DNA and RNA. Discuss why humans did not evolve with one central repository of DNA, but rather it is replicated throughout the body?
Your assignment should be 250 words in length.
Genetic Drift and the Founder Effect
There are two types of genetic drift. Describe and give an example of both the bottle neck effect and the founder effect.
Your assignment should be 250
words in length.
.
More Related Content
Similar to Background Pente Grammai is an ancient Greek board game, pl
UNIT 3
SUCCESS GUIDE
1 | GB 513 Unit 3 Success Guide v.6.13.17
UNIT 3 SUCCESS GUIDE
This unit is the other “most difficult” one. Hypothesis testing has two parts: setting-up
the hypotheses and calculating the critical values to determine results. They both
pose difficulty for a lot of students. The seminar will be on the first and the recorded
lecture will be on the second. You need to make sure you understand both,
otherwise you will not be able to get to the right conclusions.
1. As always, start by reading the chapters and studying the solved examples.
2. Watch the lecture video in document sharing. It focuses on why we do
hypothesis testing, how to do it with Excel and solves two sample problems.
3. Watch this from Khan Academy:
https://www.khanacademy.org/math/statistics-probability/significance-
tests-one-sample/tests-about-population-mean/v/hypothesis-testing-and-p-
values
This one talks more about how to write the null and alternative hypotheses
(which a lot of students get wrong) and also solves the problem using
formulas.
4. Watch the sample problem solutions in Course Resources.
5. If you still want more videos, search YouTube for “hypothesis testing.” Several
introductory level videos are available, such as
https://www.youtube.com/watch?v=HmMjS88eSVE and
https://www.youtube.com/watch?v=0zZYBALbZgg
Email your instructor if you find any of these links to be broken.
Avoid these mistakes!
GENERAL NOTES
RESOURCES
COMMON MISTAKES IN THE ASSIGNMENT
https://www.khanacademy.org/math/statistics-probability/significance-tests-one-sample/tests-about-population-mean/v/hypothesis-testing-and-p-values
http://www.youtube.com/watch?v=HmMjS88eSVE
http://www.youtube.com/watch?v=0zZYBALbZgg
2 | GB 513 Unit 3 Success Guide v.6.13.17
Students commonly get the null and alternative hypotheses reversed, or
get them completely wrong.
Students also commonly do not state the hypothesis fully. This is correct:
“null hypothesis: there is no difference between the average salary for
group 1 and the average salary of group 2.” This is not sufficient: “ho:
x1=x2”
Students sometimes compare the averages of the two groups and base
their determination on which one is greater, rather than properly doing a
hypothesis test.
Students sometimes do the calculations correctly, but do not write out
what the conclusion is. This is correct: “We therefore reject the null
hypothesis, which means we conclude that there i ...
e-Portfolio for Lab-Based Statistics (PSYC 3100) part 1Ella Anwar
This e-portfolio describes Siti Suhaila Binti Khairil-Anwar's lab-based statistics project conducted in semester 1 of 2014/2015. The project involved collecting data using an Agreeableness scale and Attitudes Towards Women scale. The document outlines the steps taken to enter the data into SPSS, transform and recode the variables, name the variables, screen the data for errors, and check the normal distribution of the data. Key steps included recoding agreeableness and attitudes scores into high, medium, and low levels and correcting errors identified during data screening. Distribution of the data was assessed using histograms, P-P plots, and Q-Q plots, with results indicating the data were
Nonparametric Test Chi-Square Test for Independence Th.docxpauline234567
Nonparametric Test
Chi-Square Test for Independence
The test is used to determine whether two categorical variables are independent.
Notation for the Chi-Square Test for Independence (Please note that the notation varies
depending on the text)
O represents the observed frequency of an outcome
E represents the expected frequency of an outcome
r represents the number of rows in the contingency table
c represents the number of columns in the contingency table
n represents the total number of trials
Test Statistic
2
2
1 1
O E
E
df r c
The Chi-Square test is a hypothesis test. There are seven steps for a hypothesis test.
1. State the null hypothesis
2. State the alternative hypothesis
3. State the level of significance
4. State the test statistic
5. Calculate
6. Statistical Conclusion
7. Experimental Conclusion
Example
A university is interested to know if the choice of major has a relationship to gender. A
random sample of 200 incoming freshmen students was taken (100 male and 100
female). There major and gender were recorded. The results are shown in the
contingency table below.
Major Female Male
Math 5 15
Nursing 44 10
English 10 10
Pre-Med 17 20
History 4 5
Education 15 20
Undecided 5 20
To determine if there is a relationship between the gender of a freshmen student and
thei declared major perform the hypothesis test (Use level of significance 0.05 ) .
Step 1: Null Hypothesis
0 : Gender and Major of Freshmen students are independentH
Step 2: Alternative Hypothesis
: Gender and Major of Freshmen students are not independentAH
Step 3: Level of Significance
0.05
Step 4: Test Statistic
2
2
1 1
O E
E
df r c
Step 5: Calculations
There are several calculations for this test. We have to find the expected frequency for
each cell in the contingency table. The expected frequency is the probability under the
null hypothesis times the total frequency for the given row. Here the probability under
the null hypothesis is .5, as the probability of being male and female is equal.
rE pn
Major Female Male
Math 1 .5 20 10E 2 .5 20 10E
Nursing 3 .5 54 27E 4 .5 54 27E
English 5 .5 20 10E 6 .5 20 10E
Pre-Med 7 .5 37 18.5E 8 .5 37 18.5E
History 9 .5 9 4.5E 10 .5 9 4.5E
Education 11 .5 35 17.5E 12 .5 35 17.5E
Undecided 13 .5 25 12.5E 14 .5 25 12.5E
Know calculate the test statistic.
2
2
2 2 2 2
2
2 2 2 2
2 2 2 2
2 2
2
5 10 15 10 44 27 10 27
10 10 27 27
10 10 10 10 17 18.5 20 18.5
10 10 18.5 18.5
4 4.5 5 4.5 15 17.5 20 17.5
4.5 4.5 17.5 17.5
5 12.5 20 12.5
12.5 12.5
2.5 2.5 10.7 10.7 0 0 .1216
obs
ob.
1) The experiment tested whether a "momentum effect" could counteract the endowment effect by measuring changes in subjects' willingness to trade goods between experimental periods.
2) Results showed willingness to trade doubled on average between periods 1 and 2, supporting the momentum effect. Most subjects adjusted in ways consistent with momentum rotation.
3) Graphs and statistical analysis of changes in preferred bundles indicated 60-80% of subjects behaved in a manner supporting the momentum trading theory, with momentum adjustments being over 5 times larger than anti-momentum adjustments on average.
2. week 2 data presentation and organizationrenz50
Here are the answers to the questions:
A.
1. The variables in the graph are age (x-axis) and frequency (y-axis).
2. The variables are quantitative.
3. The variables are discrete.
4. No, a pie chart could not be used to display this data since it involves quantitative variables rather than categorical variables.
B.
1. A line graph would most appropriately represent the number of students enrolled at a local college for each year during the last 5 years. This involves two quantitative variables - years on the x-axis and enrollments on the y-axis.
2. A bar graph would most appropriately represent the frequency of each type of crime committed in
This document provides information on statistics and probability sampling methods. It defines statistics as the science of collecting, organizing, summarizing, analyzing, and interpreting data. It describes the four main components of statistics as data collection, presentation, analysis, and interpretation. It also lists seven key characteristics of statistics. The document then discusses probability concepts like probability, experiments, outcomes, and definitions. It provides an example to calculate probabilities. Finally, it describes various probability sampling methods like simple random sampling, stratified random sampling, systematic sampling, cluster sampling, and multi-stage sampling as well as non-probability sampling methods like judgment sampling, convenience sampling, and quota sampling.
1. The document discusses statistical analysis techniques for describing and comparing data sets, including calculating the mean, standard deviation, and using t-tests.
2. It explains how to calculate the mean and standard deviation of data sets to analyze the central tendency and variability. The standard deviation summarizes how tightly values cluster around the mean.
3. T-tests are used to determine if differences between two data sets are statistically significant by comparing the means relative to the standard deviations and considering the degree of overlap between the sets.
This document provides a summary of key concepts in advanced business mathematics and statistics. It defines measures of central tendency including mean, mode, and median. It also discusses measures of dispersion like range and standard deviation. Additionally, it covers topics like regression, hypothesis testing, probability, and different types of statistical analysis.
This document provides an overview of biostatistics. It defines biostatistics as the application of statistics to biology, medicine, and public health. It discusses different types of data, measures of central tendency including mean, median and mode, and graphical representations such as line graphs, bar diagrams and pie charts. The document emphasizes the important role of biostatistics in medical research and clinical decision making. It acknowledges deficiencies in biostatistical literacy among medical students and professionals.
The document discusses data commentary and provides guidance on its purpose, structure, and key elements. It explains that a data commentary presents results, interprets results, and discusses the significance and implications of results. It also provides tips on highlighting data, writing paragraphs, linking clauses, and qualifying claims.
The document discusses data commentary and provides guidance on its structure and components. It explains that a data commentary presents results, interprets them, and discusses implications. It provides details on highlighting statements, implications, and qualifying claims. Structure includes location elements, highlights, and implications. Guidelines are given for active and passive voice as well as linking and qualifying statements.
This document provides an assignment for a statistics course. It contains 6 questions covering topics like descriptive statistics, probability, sampling, hypothesis testing, analysis of variance, and index numbers. Students are asked to answer the questions in approximately 400 words each. They are provided with the evaluation scheme and instructed to submit their answers via email or phone for review and feedback.
Homework #1SOCY 3115Spring 20Read the Syllabus and FAQ on ho.docxpooleavelina
Homework #1
SOCY 3115
Spring 20
Read the Syllabus and FAQ on how to do your homework before beginning the assignment!
To get consideration for full credit, you must:
· Follow directions;
· Show all work required to arrive at answer (statistical calculations often require multiple steps, so you need to write these down, not just skip to the final answer)
· Use appropriate statistical notation at all times (e.g. if you are calculating a population mean, begin with the equation for population mean)
· Use units in your answer, where appropriate (e.g. a mean time would be “6.5 hours” rather than just “6.5”)
Understanding the Structure of Data
1. For the following rectangular dataset:
Id
Highest degree
Works full-time
Annual income cat
1
Did not grad HS
Yes
Low
2
HS dip
Yes
Low
3
HS dip
No
Med
4
BA
No
Low
5
BA
Yes
Med
6
MA
Yes
High
7
HS dip
Yes
Med
a. What is the unit-of-analysis of the dataset?
b. How many variables are in the dataset?
c. How many observations/cases are in the dataset?
d. For eachvariable that is not named “id”:
i. What is the variable name?
ii. What is the level-of-measurement?
iii. What are the values for the variable?
iv. If you had to make a guess, what do you think the “question” was that was asked of the unit-of-analysis to get these data? (for example, if we had a continuous variable called “num_pets” the question might be “How many pets live in your household?”)
2. For the following rectangular dataset:
Id
num_bdrms
num_bthrms
sqft
Ranch
1
4
3
3200
Yes
2
2
1.5
2800
Yes
3
2
1
1200
Yes
4
3
2
1500
No
5
2
2
1100
No
a. What is the unit-of-analysis of the dataset?
b. How many variables are in the dataset?
c. How many observations/cases are in the dataset?
d. For each variable that is not named “id”:
i. What is the variable name?
ii. What is the level-of-measurement? Before answering, be sure to consult the slide called “Level of measurement – language to use”. Use the formal language!
iii. What are the values for the variable?
iv. If you had to make a guess, what do you think the “question” was that was asked of the unit-of-analysis to get these data? (for example, if we had a continuous variable called “num_pets” the question might be “How many pets live in your household?”)
3. For each of the following questions (1) construct a dataset with one variable and three observations (2) add data that could have theoretically been collected (just make up the actual responses to the question); and (3) indicate the level-of-measurement of the variable. I’ve done two examples for you.
Example#1:
What is your current age? (individual is the unit-of-analysis)
idage
1 25
2 32
3 61
The age variable is continuous/interval ratio.
Example#2:
What is the size of this hospital based on number of beds? (hospital is the unit-of-analysis)? Answers can be small (1-100 beds), medium (101-500 beds), large (501 beds to 1000 beds), extra large (1001+ beds)
idhosp_size
1 med
2 med
3 ext ...
152 pts totalFor Questions 1-2 use the 7 step process to answe.docxsandibabcock
152 pts total
For Questions 1-2 use the 7 step process to answer. Refer to slides if you are unsure of the 7 step process.
PLEASE DON’T OMIT ANY PART OF THE PROCESS!!! (40 pts) THIS IS DONE IN SPSS USING BREAST CANCER AND OBESITY DATASET
Dataset Background – PLEASE READ:
Obesity is very common in American society and is a risk factor for breast cancer for postmenopausal women.
One mechanism explaining why obesity is a risk factor is that it may raise estrogen levels in women.
In particular, one type of estrogen, serum estradiol, is a strong risk factor for breast cancer.
To better assess this relationship, researchers studied a group of 200 postmenopausal women.
The SPSS file is entitled,
Breast Cancer and Obesity
.
Adiposity was measured in two different ways:
(a) by body mass index (BMI) = weight (kg) / height(m
2
) and also (b) by waist-hip ratio (WHR) = waist circumference/hip circumference.
BMI is a measure of overall adiposity, whereas WHR is a measure of abdominal adiposity.
In addition, a complete hormonal profile was obtained, including serum estradiol.
Finally, other breast-cancer risk factors were also assessed among these women, including ethnicity, parity, age at first birth, and age at menarche.
Codebook
Variable
Column
Code
Label
Values (if categorical)
Id
1
Identification number
ES_1
2
Serum Estradiol
ETHNIC
3
Ethnicity
1 = African-American, 0 = Caucasian
NUMCHILD
4
Parity, number of children
AGEFBO
5
Age at 1
st
birth
(missing a response if never had a child)
ANYKIDS
6
Gave birth to any children?
1 = Yes, 0 = No
AGEMENAR
7
Age at menarche
BMI
8
Body Mass Index
WHR
9
Waist-hip ratio
**Missing responses are left blank
ALSO THE FOLLOWING CONTINUOUS VARIABLES HAVE BEEN CATEGORIZED!!
BMI has been categorized, bmi_cat, :
normal BMI (<25) and abnormal BMI (25 or greater).
Menarche has been categorized, menarche_cat, two categories - 9-12 and 13-16
WHR has also been categorized, whr_category, 3 categories - 0-.69, .7-.79, and .8 and greater
1.
Is there a statistically significant difference in mean estradiol between African Americans and Caucasions?
a.
Provide a visual aid depicting the mean differences between the two groups.
2.
Is there a statistically significant difference in mean estradiol between ethnicity status depending on BMI_CAT (using the categorized variable, so normal or abnormal groups)?
3.
Please use the rock climbing performance dataset.
Here is the description:
This is research done by a senior at PSU-Berks.
He was interested in determining the effects of imagery on rock climbing performance.
He chose 20 experienced rock climbers.
With randomization on the order, he had them climb with no imagery on a rock wall and then had them climb with imagery (on a different but same difficulty wall).
Ignoring issues of confounding, can we conclude that imagery decreases rock wall climb time (in seconds)?
(15pts)
a.
What statistical test should be use.
Similar to Background Pente Grammai is an ancient Greek board game, pl (14)
PSCI 2228 Public Interest GroupsThe second written assignment on t.docxkacie8xcheco
PSCI 2228 Public Interest Groups
The second written assignment on the Anthony J. Nownes Book –
INTEREST GROUPS IN AMERICAN SOCIETY.
The topic questions for the written assignment are:
1. Define interest group formation and survival and discuss the barriers to interest group formation and survival.
2. Explain unequal interest group representation.
3. Some lobbying strategies and tactics are more effective than others: Discuss which ones are the most effective.
Five pages.
.
Providing Security Over Data Please respond to the following.docxkacie8xcheco
"Providing Security Over Data" Please respond to the following:
The CIA triad (confidentiality, integrity, and availability) offers three (3) security tenets that allow data owners the framework to secure data. Considering your place of employment or your home computing environment, discuss in detail the primary means in which each of the three (3) tenets are addressed to mitigate risk and enhance security in your chosen environment.
The proliferation of mobile devices to create or access data has had a significant effect on the security concerns surrounding personal and corporate data. From the selected e-Activity article, summarize the attack, and determine the key ways in which you would consider mitigating the threat.
.
Provide two PowerPoint slides thatJustify the use of elements by.docxkacie8xcheco
Provide two PowerPoint slides that
Justify the use of elements by connecting them to various motivations of altruistic behavior as identified in social exchange theory.
*The two elements are provided in the first two slides in the attachment
Provide
pictures and foot notes (200 words each in length).
.
Provide Apples existing mission statement and code of ethics. I.docxkacie8xcheco
Provide Apple's existing mission statement and code of ethics. In what way do they articulate their ethical practices through policies and public outreach and why is this important?
Identify two areas of concern ethically and explain those choices. Make sure to discuss why you feel that are areas of ethical concern. Think critically about where Apple has the potential for ethical dilemmas. For example, an accounting firm would be concerned with fraud.
Rewrite Apple's mission statement. The idea is to provide clarity and set the new strategic direction that you think the company should be moving towards. Include a paragraph explaining the changes that you've made and why.
.
Provide a summary of your research progress thus far, no more th.docxkacie8xcheco
Provide a summary of your research progress thus far,
no more than 1 page single-spaced
. Be sure to describe any of the following that are applicable to what you
have done
: material ordering/acquisition, preliminary trials or methodology validation conducted, experimental trials conducted, results obtained, data analyzed, and conclusions reached.
and answer the attached questions
.
Provide a 250 word answer to the below discussion question in apa fo.docxkacie8xcheco
Provide a 250 word answer to the below discussion question in apa format with in-text citations and references
Research an historic or current servant leader who is a true volunteer in service to others. In what ways does the person inspire leadership while building his or her own character and integrity? How does this leader exemplify the moral obligation to lead through kindness, compassion, and justice?
.
Property. Please respond to the following Evaluating Dolan v. C.docxkacie8xcheco
"Property." Please respond to the following:
Evaluating Dolan v. City of Tigard, as a public administrator, take a position on whether you agree or disagree with the approach that the U.S. Supreme Court developed. Support your position with examples or evidence.
Analyzing Grose v. Sauvegeau, explain with details whether you agree or disagree that Sauvegeau should prevail.
1 Page
.
Properties of LifeChapter 1 of the text highlights the nine pr.docxkacie8xcheco
Properties of Life
Chapter 1 of the text highlights the nine properties of life. Briefly describe each of the nine properties and discuss how things like a virus, prion, and viroid can reproduce, but are not considered to be alive. Address the question: how can things like these that are not considered to be alive “evolve”?
Your assignment should be 250 words in length
DNA and RNA
Compare and contrast DNA and RNA. Discuss why humans did not evolve with one central repository of DNA, but rather it is replicated throughout the body?
Your assignment should be 250 words in length.
Genetic Drift and the Founder Effect
There are two types of genetic drift. Describe and give an example of both the bottle neck effect and the founder effect.
Your assignment should be 250
words in length.
.
PronombresFill in the blanks with the correct words.Raúl y Val.docxkacie8xcheco
Pronombres
Fill in the blanks with the correct words.
Raúl y Valeria se divorciaron. No hay nada entre
[removed]
(blank)
. (
them
)
Daniela es la quinceañera. Necesitas comprar un regalo para
[removed]
(blank)
. (
her
)
Voy a casarme. Todos hablan de
[removed]
(blank)
. (
me
)
Eres muy simpático. Vamos a pasarlo muy bien
[removed]
(blank)
. (
with you
)
La recién casada se sentó entre
[removed]
(blank)
. (
you
,
El invitado
[removed]
(blank)
(venir) conmigo.
Ana y yo no
[removed]
(blank)
(decir) nada malo.
Ustedes
[removed]
(blank)
(estar) en la boda, ¿verdad?
Eduardo
[removed]
(blank)
(tener) una buena niñez.
¿Tú
[removed]
(blank)
(hacer) el postre anoche?
.
Propose at least three techniques in which the color blind perspecti.docxkacie8xcheco
Propose at least three techniques in which the color blind perspective can be applied to classrooms so that the front-stage / back-stage difference in racial interactions may be eliminated.
Analyze whether or not the color-blind perspective can also be applied to gender relations, sexual orientation, social class, special needs, or religion in the classroom.
.
Provide a 150 word response to the below discussion question answer .docxkacie8xcheco
Listening and empathy are the most important principles for servant leaders to promote respect for diversity, as they allow leaders to understand different perspectives and build trust. The document discusses a leadership training where participants struggled to accept each other's cultural identities but were eventually able to work well together by listening to individuals. Employing servant leadership principles like listening can help respect for multiculturalism within organizations.
Prompt Submit a draft of your implementation section. You will gi.docxkacie8xcheco
Prompt:
Submit a draft of your implementation section. You will give a detailed description of the activities leading to achieving the objectives, including your rationale behind their selection, their sequence, and your reasoning behind why these methods may work.
Specifically, the following
critical elements
must be addressed:
V.
Implementation
Provide a detailed description of the
activities
leading to achieving the objectives identified, including your rationale behind their selection, their
sequence
, and your reasoning behind why these methods may work.
Guidelines for Submission:
The draft of your implementation section should be submitted as a 3- to 4-page Microsoft Word document with double spacing, 12- point Times New Roman font, and one-inch margins. Any references should be cited in APA format.
Proposal Topic : Patient Safety and Quality
.
PROMPT Think about how 5 of the population of the South managed to.docxkacie8xcheco
PROMPT: Think about how 5% of the population of the South managed to keep a system in place that was detrimental to the overwhelming majority of southerners, both black and white. What specific factor/tool/policy do you think was the key to their maintaining control and imposing their will? Why didn’t the rest of the population use their numbers to impose a system more beneficial the majority? Is there any comparison you can make to the power brokers in the north at the time? Time frame 1776 to 1790.
1 page, APA, references
Submit in 2-3 hours
.
Properties of LifeChapter 1 of the text highlights the nine proper.docxkacie8xcheco
Properties of Life
Chapter 1 of the text highlights the nine properties of life. Briefly describe each of the nine properties and discuss how things like a virus, prion, and viroid can reproduce, but are not considered to be alive. Address the question: how can things like these that are not considered to be alive “evolve”?
Your assignment should be 250-500 words in length.
.
Prompt Write a short paper that describes a public health issue a.docxkacie8xcheco
Prompt:
Write a short paper that describes a public health issue and the public health programs that have been implemented to address this specific issue. Specifically, the following critical elements must be addressed:
Would like the public health issue to be something affecting the Northeasten USA
- Describe the public health issue, including the affected population, and the social and behavioral risk factors that are associated with the issue
- Delineate between social and behavioral risk factors that contribute to disease, and diseases that contribute to social and behavioral risk factors
- Describe the public health programs implemented to address this issue, and determine how these programs addressed the social and behavioral risk factors associated with the disease
- Determine the successes and failures of these programs, and clearly explain why you have determined them successes and failures
- Select a program that you will examine for your final project, and provide the rationale for your choice
- Substantiate your work with data and references from peer-reviewed academic journals
Guidelines for Submission:
Your paper should be 4 pages in length. It should be double-spaced and formatted with 12-point Times New Roman font and one-inch margins. At least three sources from peer-reviewed academic journals must be cited in APA format.
.
PromptHow was St. Franciss message of empathy conveyed in the fr.docxkacie8xcheco
Prompt:
How was St. Francis's message of empathy conveyed in the frescos of the church of St. Francis of Assisi? Find a second artwork (fresco, sculpture, etc.) – not from the textbook – that decorates a cathedral and memorializes the message of a saint. Compare the representation of St. Francis's message in this artwork to how your selection communicates a saint's message. Describe the method and provide similarities and differences. Cite your source(s).
.
PromptOur readings from this unit engage with the topic of economi.docxkacie8xcheco
Prompt
Our readings from this unit engage with the topic of economic well-being, either directly or indirectly. This leads us to reconsider what we mean when we say something is “valuable.” Choose one primary text – either Sherman Alexie’s “This Is What It Means To Say Phoenix, Arizona,” or John Updike’s “A&P.” You will then select two secondary sources from your choices listed below (or you can use one below and locate another on your own). Your argument must clearly respond to the following question:How does the author of the primary text critique our society’s view of what is valuable, and do secondary sources support, refute, or complicate that critique? You must couch your
4-page response
in terms of the
methods
(both Fictional and Rhetorical) used. Support your argument with textual evidence and analysis. Every quote must by analyzed in terms of Fictional Methods or Rhetorical Strategies. Please follow MLA format.
Secondary Sources
Two secondary sources will be incorporated into your response. Choose
one or two
from the following list: Gary Shteyngart’s “Sixty-Nine Cents,” George Orwell’s “Shooting An Elephant,” or David Foster Wallace’s “Kenyon College Commencement Speech.” If you would like to find
one secondary source of your own
using the Dana Library – either a book or a scholarly article – you may do so, as long as it is relevant, current, authentic, and credible. However,
at least one
secondary source must be chosen from our course packet (see list above).
They must be typed in Times New Roman, 12 point, double-spaced, and single-sided, with your last name and page number in the upper right hand corner. Please follow MLA format at all times. A Works Cited page and your rough draft must also be attached.
Primary text- "A&P by John Updike
Secondary sources: "Shooting an elephant" by, George Orwell and "Sixty nine cents" by, Gary Snteygart
In our society today when something is valuable it mean that it is important and signicant.
Thesis claim: John Updike uses Irony to critique our society's view of what it values.
Paragraph 1: Primary source -fictional method
paragraph 2: primary source & secondary source 1
paragraph 3: primary source & secondary source 2
2 sentence thesis
#1- primary text & fictional method
#2- synthesis of all 3 sources
quotes and citation must be included.
no plagiarism
.
PROMPT 1Reflecting on the CBS eye logo within the context of co.docxkacie8xcheco
PROMPT 1:
Reflecting on the CBS eye logo within the context of corporate design, Dennis Doordan quotes
designer Paul Rand: “Symbols are a duality. They take on meanings from causes—good and
bad. And they give meaning to causes—good and bad.” (Doordan 4)
Use the two logos below to help you answer the following question:
How does each of these logos build upon (and/or subvert) existing cultural forms to communicate a particular agenda? Consider the logos in relation to one another to build your argument, reflecting on the ways in which they aesthetically, conceptually, and ideologically converge and diverge. To craft your response, draw substantively from at least TWO of the course readings from Weeks 2-6.
To build your argument, you may discuss how the works...
...imagine and/or construct their audience.
...respond to a particular political or economic situation.
...speak to particular social conditions.
...represent different people and practices.
...reference other media and/or other graphic design artifacts.
...take on meanings in different geographic locations or communities.
...adopt different meanings over time.
.
Project should include your revisions based on faculty feedback, pee.docxkacie8xcheco
Project should include your revisions based on faculty feedback, peer DB considerations, and your own personal editing and continued research. The final version should include the following sections.
Note:
Part 5 requires new additional content.
Part I:
Transportation Regulations and Policies
Define the goal
Explain the relevance
National security
Public safety
Environment
Unrestrained competition
Part II:
Transportation Methodologies
Economic viability
Practical use
Applications in domestic and global markets
Part III:
Warehousing and Distribution
Principles
Design
Storage and handling
Information systems and information technology
Third-party logistics providers (3PL)
Part IV:
Inventory Management
Inventory functions for intermediate and final products
Packaging techniques
Part V:
Future Opportunities
Write a final summary about the future opportunities of your company and your recommendations.
How can it measure its success in the future?
How will it help in gaining new customers?
What are the next steps?
.
Prompt 1Ethical ConsiderationsWhen using technology responsibly .docxkacie8xcheco
Prompt 1
Ethical Considerations
When using technology responsibly whether in the workplace or at home, you will need to consider the privacy and security of electronic data as well as the ethical concerns surrounding technology. Describe some of the moral, ethical, and legal issues surrounding responsible use of technology (and the information obtained through the technology) in the workplace. Do you have any personal experience with information being compromised?
Prompt 2
Protecting Patient Information
Many of you are already working in various roles in various healthcare environments. Describe some of the guidelines and protocols that you are required to follow when it comes to protecting patient information
Pick 1 prompt 100 words+ APA format
.
How to Manage Your Lost Opportunities in Odoo 17 CRMCeline George
Odoo 17 CRM allows us to track why we lose sales opportunities with "Lost Reasons." This helps analyze our sales process and identify areas for improvement. Here's how to configure lost reasons in Odoo 17 CRM
Main Java[All of the Base Concepts}.docxadhitya5119
This is part 1 of my Java Learning Journey. This Contains Custom methods, classes, constructors, packages, multithreading , try- catch block, finally block and more.
Strategies for Effective Upskilling is a presentation by Chinwendu Peace in a Your Skill Boost Masterclass organisation by the Excellence Foundation for South Sudan on 08th and 09th June 2024 from 1 PM to 3 PM on each day.
it describes the bony anatomy including the femoral head , acetabulum, labrum . also discusses the capsule , ligaments . muscle that act on the hip joint and the range of motion are outlined. factors affecting hip joint stability and weight transmission through the joint are summarized.
How to Make a Field Mandatory in Odoo 17Celine George
In Odoo, making a field required can be done through both Python code and XML views. When you set the required attribute to True in Python code, it makes the field required across all views where it's used. Conversely, when you set the required attribute in XML views, it makes the field required only in the context of that particular view.
How to Add Chatter in the odoo 17 ERP ModuleCeline George
In Odoo, the chatter is like a chat tool that helps you work together on records. You can leave notes and track things, making it easier to talk with your team and partners. Inside chatter, all communication history, activity, and changes will be displayed.
How to Build a Module in Odoo 17 Using the Scaffold MethodCeline George
Odoo provides an option for creating a module by using a single line command. By using this command the user can make a whole structure of a module. It is very easy for a beginner to make a module. There is no need to make each file manually. This slide will show how to create a module using the scaffold method.
LAND USE LAND COVER AND NDVI OF MIRZAPUR DISTRICT, UPRAHUL
This Dissertation explores the particular circumstances of Mirzapur, a region located in the
core of India. Mirzapur, with its varied terrains and abundant biodiversity, offers an optimal
environment for investigating the changes in vegetation cover dynamics. Our study utilizes
advanced technologies such as GIS (Geographic Information Systems) and Remote sensing to
analyze the transformations that have taken place over the course of a decade.
The complex relationship between human activities and the environment has been the focus
of extensive research and worry. As the global community grapples with swift urbanization,
population expansion, and economic progress, the effects on natural ecosystems are becoming
more evident. A crucial element of this impact is the alteration of vegetation cover, which plays a
significant role in maintaining the ecological equilibrium of our planet.Land serves as the foundation for all human activities and provides the necessary materials for
these activities. As the most crucial natural resource, its utilization by humans results in different
'Land uses,' which are determined by both human activities and the physical characteristics of the
land.
The utilization of land is impacted by human needs and environmental factors. In countries
like India, rapid population growth and the emphasis on extensive resource exploitation can lead
to significant land degradation, adversely affecting the region's land cover.
Therefore, human intervention has significantly influenced land use patterns over many
centuries, evolving its structure over time and space. In the present era, these changes have
accelerated due to factors such as agriculture and urbanization. Information regarding land use and
cover is essential for various planning and management tasks related to the Earth's surface,
providing crucial environmental data for scientific, resource management, policy purposes, and
diverse human activities.
Accurate understanding of land use and cover is imperative for the development planning
of any area. Consequently, a wide range of professionals, including earth system scientists, land
and water managers, and urban planners, are interested in obtaining data on land use and cover
changes, conversion trends, and other related patterns. The spatial dimensions of land use and
cover support policymakers and scientists in making well-informed decisions, as alterations in
these patterns indicate shifts in economic and social conditions. Monitoring such changes with the
help of Advanced technologies like Remote Sensing and Geographic Information Systems is
crucial for coordinated efforts across different administrative levels. Advanced technologies like
Remote Sensing and Geographic Information Systems
9
Changes in vegetation cover refer to variations in the distribution, composition, and overall
structure of plant communities across different temporal and spatial scales. These changes can
occur natural.
हिंदी वर्णमाला पीपीटी, hindi alphabet PPT presentation, hindi varnamala PPT, Hindi Varnamala pdf, हिंदी स्वर, हिंदी व्यंजन, sikhiye hindi varnmala, dr. mulla adam ali, hindi language and literature, hindi alphabet with drawing, hindi alphabet pdf, hindi varnamala for childrens, hindi language, hindi varnamala practice for kids, https://www.drmullaadamali.com
Background Pente Grammai is an ancient Greek board game, pl
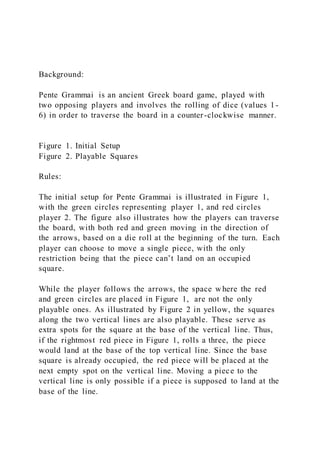
1. Background:
Pente Grammai is an ancient Greek board game, played with
two opposing players and involves the rolling of dice (values 1-
6) in order to traverse the board in a counter-clockwise manner.
Figure 1. Initial Setup
Figure 2. Playable Squares
Rules:
The initial setup for Pente Grammai is illustrated in Figure 1,
with the green circles representing player 1, and red circles
player 2. The figure also illustrates how the players can traverse
the board, with both red and green moving in the direction of
the arrows, based on a die roll at the beginning of the turn. Each
player can choose to move a single piece, with the only
restriction being that the piece can’t land on an occupied
square.
While the player follows the arrows, the space where the red
and green circles are placed in Figure 1, are not the only
playable ones. As illustrated by Figure 2 in yellow, the squares
along the two vertical lines are also playable. These serve as
extra spots for the square at the base of the vertical line. Thus,
if the rightmost red piece in Figure 1, rolls a three, the piece
would land at the base of the top vertical line. Since the base
square is already occupied, the red piece will be placed at the
next empty spot on the vertical line. Moving a piece to the
vertical line is only possible if a piece is supposed to land at the
base of the line.
2. The line filled with yellow circles in Figure 2, is called the
sacred line. If a piece lands there, the player earns an extra turn
with a new die roll. It is possible to play several turns in a row
if a player keeps landing on the sacred line.
A player is obligated to play on his turn, if a legal move is
possible. An illegal move constitutes moving to an occupied
spot. If no legal moves are available, then the player can forfeit
his turn.
Example Turn:
Figure 4
Figure 5
Figure 3
In Figure 3, it is the red player’s turn and a 2 has been rolled.
With most regular squares occupied, red only has two options
which involve moving to either the top or bottom sacred line.
The two moves are illustrated in Figures 4 and 5.
For Figure 4, the base is empty so the red piece can safely move
there. For Figure 5, the base spot is occupied by a green square,
but since the sacred line is effectively a collection of extra
spaces for the base, red can move to the next empty spot on the
top sacred line.
Victory Conditions:
If a player places all of his pieces on the sacred line opposite
from his starting position, then he wins. Based on Figure 1, red
3. needs to move his pieces to the top sacred line, while green’s
goal is bottom sacred line.
Problem Description:
You are to implement the game of Pente Grammai, as described
in the section above, for two human players. The game should
not permit illegal moves. You must implement three ADTs, one
for a player, one for the board, and one for the referee.
Additional ADTs are allowed, but you must implement a
minimum of three ADTs.
Figure 6
Tasks:
1. 3 ADTs (Player, Board, Referee)
2. Piece Movement
3. Player Turn Coordination
4. Score Display at each Turn
5. Illegal Move Check
6. Allow turn forfeiting, only when no legal moves available
7. Player Wins with score of 5
The game starts with all pieces on the board. Figure 6 illustrates
the initial piece positions. At each turn, your program should
prompt the appropriate player, to select a piece, and display the
score. Each piece in the target sacred line counts as one point,
for a maximum of five points which indicates a win. You should
4. also display the score. The program should accept both upper
and lower-case input.
Originally, a player’s pieces are identical. While you can
implement a coordinate-based input scheme, the non-square
shape of the board would make this non-intuitive, and it is
recommended that you assign numbers for player 1’s pieces
(1,2,3,4,5) and letters for player 2’s pieces (A, B, C, D, E).
If an incorrect move is inputted (selecting an opponent’s piece,
illegal move) the program should recognize the error and
continue to request correct input until the user provides it.
When a player wins, the game should stop and a message
indicating which player is victorious must be printed on the
screen.
Note: Accompanying tutorial and project description videos
have been provided on blackboard
Tip: When designing the structure of your ADTs, it is useful to
think in terms of designing a player’s A.I., in order to see how
the ADTs should interact. Your Referee should act as an
interface between player and board, and not allow the player to
cheat (player setting his own score, making illegal moves, etc.)
Example Output:
5. M1 55 Guidelines
Specifically, the following critical elements must be addressed:
Briefly summarize, in about two to three sentences, at least five
resources that you will use in your final project.
Explain how you anticipate each resource will contribute to
your final project.
Tips: The following list includes some great resources to start
your search for resources.
The World Health Organization (WHO) website is an
authoritative resource for gathering health statistics and other
relevant information.
The International Labor Organization (ILO) database has a
wealth of information on factory conditions. For example,
browse their Statistics and Databases website or search for
specific terms such as “Bangladesh” and “garment factory” in
the search box. Remember, you are looking at the many
determinants of health, and these include things such as the
environment and working conditions
M1 54 Guidelines
Specifically, the following critical elements must be addressed:
Introduction: Choose an environmental health topic with your
instructor’s approval to use as the basis for your analysis and
recommendations paper.
A. Briefly introduce your chosen topic. Be sure to explain why
it is considered an environmental hazard or threat to
environmental health, and provide evidence to support your
response.
B. Cite current literature on this environmental hazard by
summarizing the articles that you selected to research your
topic.
C. Assess the scientific value of each of the sources you cited.
In other words, how credible do you feel each of the sources
6. you have selected is for your research on this topic? Be sure to
justify your reasoning.
D. What are the key points you drew from each of these sources,
and from which section(s) of the article or paper did you cull
them?
M1 55
Ahmed, F.W. (2018). A Critical Analysis of Bangladesh
National Tuberculosis Control Program.
Retrieved from http://www.alliedacademies.org/articles/a-
critical-analysis-of-bangladesh-national-tuberculosis-control-
program.pdf
This article describes several weaknesses and major challenges
of the NTP (The National Tuberculosis Control Program). The
program is believed to be an overall success given its many
strengths with possible opportunities. Though this program has
made progress providing diagnosis, treatment, and controlling
of the disease is still a major impediment. This article is useful
to my final paper because it broadens my horizon to different
programs that are fighting to combat TB.
Nathavitharana, R., Daru, P., Barrera, A.E. (2017). FAST
Implementation in Bangladesh: High Frequency of Unsuspected
Tuberculosis Justifies Challenges of Scale Up.
Retrieved from
https://www.ncbi.nlm.nih.gov/pmc/articles/PMC5757242/
The focus of this article is to present operational data and
discuss the challenges of implementing FAST (Find cases
Actively, separate safely and Treat effectively) as a TB
transmission control strategy. FAST was implemented
sequentially at three hospitals. Knowing the challenges that
certain programs face is helpful to understand just how hard it
is to reach a group of people suffering from this epidemic.
WHO (World Health Organization). (2019). The Philippines
Department of Health and WHO call for 'all-out-war' against TB
The main aim of this report is to provide a comprehensive and
updated assessment of the TB epidemic, progress in prevention,
7. diagnosis and treatment of the disease at global, and regional
levels. WHO is always a great resource to turn to because it
covers a wide range of public health issues throughout the
nation.
Vassall, A. (2015). Bangladesh Perspectives: Tuberculosis.
This presentation alerts us on how tuberculosis is plaguing the
working people of Bangladesh. It gives us an insight on how
many people are affected and the rates of death coming from
this frequent disease. There are treatments for TB, but it is hard
to diagnose because many people are not aware of the symptoms
they experience. It tells us how tricky this situation is, being
that TB is treatable, but it can take so long for the treatments to
work and people the treated are exposed to may have the disease
without knowing; counteracting the treatments.
Islam, Q. S., Islam, M. A., Islam, S., Ahmed, S.M.. Prevention
and control of tuberculosis in workplaces: how knowledgeable
are the workers in Bangladesh?
This study aimed to fill-in this knowledge gap. A cross-
sectional survey was done in multiple workplaces like garment
factories, jute mills, bidi/tobacco factories, flour mills, and
steel mills using a multi-stage sampling procedure. Data was
collected from 4800 workers in face-to-face interview helping
to give an insight on how the workers deal with having or being
exposed to this disease.
DBQ 55
After considerable deliberation of the information presented, I
stand in agreement with Evelyn Bonabone’s decision to seek the
assistance of Nahayo, the neighboring village healer. Important
to reaching this conclusion, it proved necessary to view this
case through the lens of Bonabone, which is vastly different
from that of a Westerns lens. Considerations include cultural
conditioning, tradition, rituals, practices, myths, and a distrust
of Western medicine. Two additional elements that factor into
my support is the history of ‘false teeth’ and the fact that “in
some African countries 80 percent of people consider traditional
8. healers their primary caregivers” (Borrell, 2014, para, 11).
Although new to Uganda (1979), the procedure to treat ‘false
teeth’ (aka teething) has roots dating back as early as 1839
(Borrell, 2013). Thus, it is often difficult to erase historical
medical misconceptions; especially, in developing countries.
As Westerns, it’s tradition to seek the medical attention of a
physician when warranted; thus, as children, we are conditioned
to maintain this practice as individuals and parents. The same is
true of African population except their cultural conditioning
directs them to seek the services of a traditional healer.
Essentially, their faith in traditional healer’s parallels Westerns
faith in doctors to treat, heal or cure our ills. When framing
Uganda’s distrust of Western medicine, it’s important to
highlight the fact that the Tuskegee Syphilis Study that began in
1932 and ran through 1972 (40 years). Notably, this study
resulted in the mistrust “between African Americans and the
biomedical professions; it is argued that the Study is a
significant factor in the low participation of African Americans
in clinical trials, organ donation efforts, and routine preventive
care (Tuskegee Syphilis Study Legacy Committee, 1996, para.
2). Thus, when Western medicine creates lingering mistrust
among a specific U.S. population, it makes it easier to
understand how distrust can spill over borders. Admittedly, the
distrust of the Uganda people does not correlate with this study,
it’s provided to showcase the challenges of changing views and
gaining trust in matters of medicine. In closing, I would argue
that with time, conditioning, and education, further
development in African countries will resulting in their
evolvement. Thus, resulting in the transition and adoption of
modern medicine and a move away from traditional healers.
References
9. Borrell, B. (2013). Magic or Medicine. Retrieved from
https://aeon.co/essays/how-medicine-and-ritual-got-hopelessly-
entangled-in-uganda
Tuskegee Syphilis Study Legacy Committee. (1996). Bad blood:
The Tuskegee Syphilis Study. Retrieved from
http://exhibits.hsl.virginia.edu/badblood/report/
M1 54
Exposure to mercury is widespread in our environment, Centers
for Disease Control (CDC) data shows that most people have
blood mercury levels below levels associated with possible
health effects (EPA.gov 2017). Mercury is a neurotoxin that can
affect a person’s health however that depends on several
factors. These factors include the age of the person exposed,
how the exposure occurs, length of exposure, co-morbidities of
the person exposed, the amount of exposure and the form of
mercury exposed. There are various forms of mercury and they
differ in the effects that it has on the human body as well as the
degree of toxicity. The elemental form of mercury naturally
occurs in the earth’s crust, occupational exposure to mercury
occurs during industrial processes and this happens in its
inorganic form. Methylmercury also known as organic mercury
is the most common form of mercury exposure in the United
States because the fish and shellfish that is consumed contains
higher levels of methylmercury. Ethyl mercury is used as a
vaccine preservative and it is also said to not pose any health
risks however some may argue that the high levels of ethyl
mercury found in vaccines may be linked to the 237 percent
increase in Autism cases from 1987-1998 in
California(Watanabe,C., & Satoh, H. 1996). The World Health
Organization (WHO) considers mercury to be one of the top ten
chemicals or group of chemicals that pose a major public health
concern.
The first article that I selected to further explore the
environmental effects of mercury looked at the evolution of our
10. understanding of methylmercury as a health threat. This article
examined earlier literature on Minamata Disease that occurred
along the Minamata Bay in Kyush, Japan in the 1956 as a result
of contaminated methylmercury discharged in waste water from
a chemical plant. It also looked at in utero exposure to
methylmercury and the effects it may have on the nervous
systems of developing fetuses and lastly the article compared
human and animal data and the effects methylmercury have on
their nervous systems in utero.
The second article that I selected examined all of the literature
from 2012-present that addressed mercury and methylmercury
as it relates to human health. The results of the literature search
resulted in 514 relevant published papers that looked at ten
different areas of mercury exposure which is considered to be a
more current and comprehensive literature review that looks at
multiple factors of mercury exposure. The key points drawn
from the first article are the long-term effects of the outbreak of
Minamata disease in the Moms and their unborn children, the
effects of a pregnant woman eating fish more than three times a
week as it relates to the higher instance of abnormal results
from the Denver Developmental Screening Test on their babies.
Discussed in section five of the second article addressed the
fact that based on the results of their literature review,
healthcare professionals and researchers need to work more
closely together to help fill the gaps in knowledge as it relates
to mercury exposure.
11. References:
Health Effects of exposure to Mercury, Environmental
Protection Agency, 2017 retrieved from:
https://www.epa.gov/mercury/health-effects-exposures-mercury
Ha, E., Basu, N., Bose-O’Reilly, S., Dórea, J. G., McSorley, E.,
Sakamoto, M., & Chan, H. M. (2017). Current progress on
understanding the impact of mercury on human
health. Environmental Research, 152419-433.
doi:10.1016/j.envres.2016.06.042
Watanabe,C., & Satoh, H. (1996). Evolution of our
understanding of methylmercury as a health threat.
Environmental Health Perspective, 104 Suppl 367-379
Journal 55
When it comes to sex selective abortion the thought of it is
abhorrent and it is absurd to abort a child because of an
uncontrollable element. In countries such as China, having male
children are preferred because they have a higher wage-earning
capacity (especially in agrarian economies), they continue the
family line and they usually take responsibility for care of
parents in illness and old age (CMAJ, 2011).
There may be some positive aspects of this easy access to sex
selection. Access to prenatal sex determination probably results
in an increase in the proportion of wanted births, leading to less
discrimination against girls and lower female mortality (CMAJ,
2011). Also, it has been argued that an imbalance in the sex
ratio could be a means to help to reduce growth in the
population (CMAJ, 2011). It’s said to be thought that as
numbers of women in society fall, they become more highly
valued and their social status increases. Not only will this
benefit the women’s self-esteem and mental health, but also
their well-being overall.
Sex selective abortion can be extremely empowering for women
attempting to have a son and experiencing pressure to fulfil
their “womanly duty” by having a male child. Through choosing
12. to terminate a pregnancy when the fetus is female or to carry on
with it if the fetus is male, women in many Asian societies can
gain legitimacy, earn recognition and acquire status in their
family and community (Taylor and Francis, 2002). By using sex
selective abortion, women may avoid having more children than
they want and thus limit the size of their family (Taylor and
Francis, 2002).
This practice isn’t something that every one may agree with, but
it has proven to be useful in countries that are firmly dependent
on their male counterparts to maintain their households and
daily life.