Download to read offline


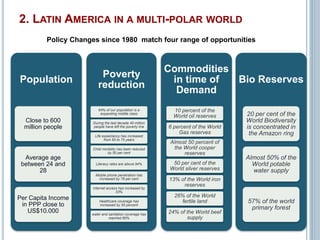

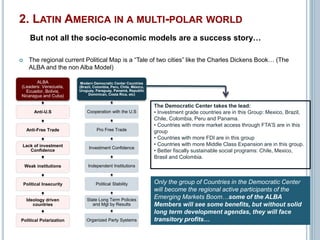


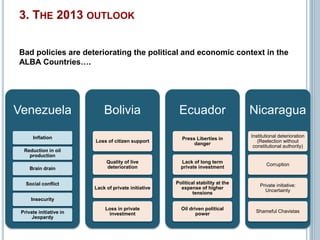
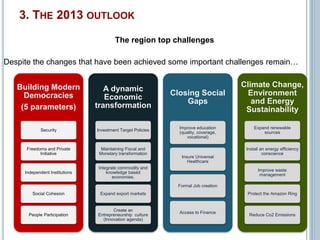

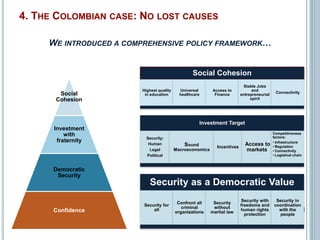

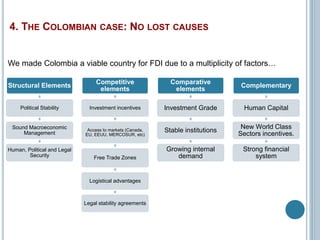


The document outlines key trends shaping the future of Colombia and Latin America, including the expansion of the global middle class, the rise of emerging powers particularly in Asia, and increasing demand for natural resources. It discusses socio-economic advancements in Latin America over the last decade, while highlighting the contrasting political landscapes of the region, particularly the successes of liberal democracies versus populist regimes. Furthermore, it provides an economic outlook for 2013, emphasizing varied growth rates across countries, and details the significant improvements in Colombia's security and economy under a comprehensive policy framework.