Download to read offline


![Capital Structure andCorporate Governance practices. Evidence from Listed Non-Financial Firms on
www.iosrjournals.org 12 | Page
Multi-collinearitycan be measured using variance inflation factor (VIF) or tolerance test.(In this study
VIF was used) . from tables 4a &4b regression analysis all VIF values are below 10 which is the critical value
rule of thumb when VIF values are less than 10 then there is no multi-collinearity problem (Besley 1980) as
sighted in (Jingyu Li 2003)
XVI. Durbin Watson test
Durbin Watson a test used to detect auto correlation from the tables 4a & b all Durbin Watson values are
less than 3 indicating that there is no autocorrelation the rule of thumb.
Adjusted R squared for short term to asset ratio show that 15.6% of the variance in dependent variables can be
explained by independent variables of cooperate governance. WhileAdjusted R squared for total debt to asset
ratio is 16.9 %.whichshow that 15.6% of the variance in dependent variables can be explained by independent
variables of cooperate governance For long term debt to asset ratio and debt equity to asset ratio is insignificant
(very small)
Insert Correlation table 6 with size as a moderating variable
From table 5 the use size as a moderating variable has had great impact on the relation between capital structure
and corporate governance.STDA has now shown to be negatively correlated to CEO duality (-.416) which is
significant. This implies when the CEO doubles up as a director as the firm size increase the firm will become
less levered and is insignificant.
For TD shows a positive correlation with CEO duality and ONC which is significant at 99%
confidence level, though average .total debt shows positive relationship with all corporate governance proxies
for firms listed on the NSE.Debt equity has a negative relationship with CEO duality which is significant at 95%
confidence level. Size as amoderating variable has a great effect on the relationship between capital structure
and corporate governance. Results of CEO duality and capital structure (STD and DE) the increase in the size of
the firms tend to use pecking order hypothesis where they use internal generated funds and avoid use of debt.
The relationship between ONC ,ISR and TD becomes significant and are positively correlated. Increase the size
of the firm large block shareholdings and institutions will allow the firm to be more levered to reduce the impact
of tax as debt interest is allowable compared to dividend which is not tax allowable
Insert Regression table 7a with size as a moderating variable
Insert Regression table 7bwith size as a moderating variable
From table 7a & b with size as a moderating variable VIF values are less than 10 hence no Multi- collinearity
problem. Durbin Watson for both tables are less than 3 hence no autocorrelation problem. Adjusted R square for
TD and STDA is 0.275 for both meaning 27.5 % of variance in TD/STDA can be explained by independent
variables, while 72.5% by other factors. For DE it shows that 12.1% of variance in dependent variables can be
explained by independent variables. For LTDA R squared shows that 1.8% of variance in dependent variable
can be explained by independent variables.
XVII. Conclusion
Corporate governance has been an important area in research in Kenya. Corporate failures such as
Uchumi-super market with a chain of related outlets,Blue Shield insuranceand MugoyaConstruction Company.
This alarmed the CMA to strengthen its roles on firms on the NSE to institute corporate governance. In this
research the researcher has 5 variables of corporate governance and 4 for capital structure.
Most firms (93%) on the NSE has the CEO as the director this concentrate decision making authority
on an individual leading to high debt policy for firms on NSE. Though most firms on the NSE have a large
board size minimum of 7 directors but the proportion of non-executive directors is 1:4 thus they can influence
greatly on the decision making, this may compromise corporate governance principles. ONC and ISR holds
about 66% and 59% of stake on firms on NSE this may influence managerial decisions.
Firms on the NSE tends to prefer STD to LTD. 33% of asset are represented by STD, LTD market in Kenya is
not fully developed and restrictive covenants and lack of collateral pushes firms to use STD. firms on NSE use
more debt than equity as 52% of the asset are represented by total debt this could be due to debt interest is tax
allowable while dividend is not. Firms hedge themselves from high tax by using debt.
References
[1]. The Capital Markets Act Cap. 485a Gazette Notice No. 3362 (2002) Kenya.Capital Markets (Securities ,Public Offers, Listing and
Disclosures) Regulations, (2002) .Kenya
[2]. www.kenyacentral.com
[3]. https://www.nse.co.ke/about-nse/history-of-organisation.html
[4]. Abor J. (2007) Corporate governance and financing decisions of Ghanaian listed firms, Emerald Group Publishing Limited, Vol. 7 Iss:
1, pp.83 – 92](https://image.slidesharecdn.com/b01020816-150430042834-conversion-gate02/85/Capital-Structure-andCorporate-Governance-practices-Evidence-from-Listed-Non-Financial-Firms-on-Nairobi-Securities-Exchange-Kenya-5-320.jpg)
![Capital Structure andCorporate Governance practices. Evidence from Listed Non-Financial Firms on
www.iosrjournals.org 13 | Page
[5]. Akram B. & Ahmad A.(2010)The Effect of Corporate Governance and Ownership Structure on Capital Structure of Iranian Listed
Companies7th International Conference on Enterprise Systems, Accounting and Logistics, Rhodes Island, Greece
[6]. Noriza M (2010)Corporate Governance Compliance and the Effects to Capital Structure in Malaysia. International journal of
economics and finance. vol 2 no 1.
[7]. Rehman, M. A. U., Rehman, R. U., &Raoof, A. (2010). Does corporate governance lead to a change in the capital struture? American
Journal of Social and Management Sciences
[8]. Saad, N.M. (2010).Corporate Governance Compliance and the Effects to Capital Structure in Malaysia International Journal of
Economics and Finance, 2(1).
[9]. Rajendran K (2012).Effect Of Corporate Governance On Capital Structure: Case Of The Srilankan Listed Manufacturing Companies.
Journal of Arts, Science & Commerce
[10]. Amarjit G., Nahum B., Harvinder S. &Charul S. (2012)Corporate Governance and Capital Structure of Small Business Service Firms
in India.International Journal of Economics and Finance; Vol. 4, No. 8
[11]. Jingyu L. (2003) dividend clienteles’ financial leverage clienteles and determinant of dividends policy under Newzaeland imputation
tax regime. A PHD thesis Massey university
Appendices
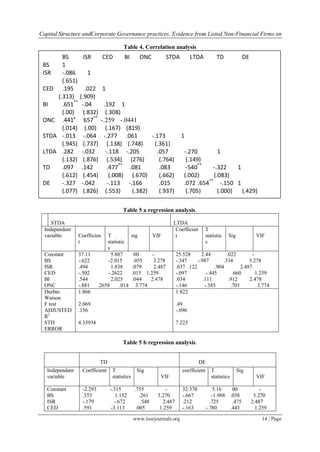
Table 1 Percentage of Sample Selected.
Total no of companies Percentage Sample
Agricultural Sector 7 71 5
Automobiles and Accessories 4 75 3
Commercial and Services, 9 56 5
Construction and Allied
Sector,
5 60 3
Energy and Petroleum 4 75 3
Insurance 6 33 2
Investment 4 50 2
Manufacturing and Allied 9 67 6
Telecommunication and
Technology
2 50 1
TOTAL 50 60 30
Table 2 variables used
Variable Formulae Symbol
Long Term
Debt to Asset
Ratio
Long Term Debt
Total Assets
LTDA
Short Term
Debt to Asset
Ratio
Short Term Debt
Total Assets
STDA
Debt Equity
ratio
Total Debt
Equity
DE
Total Debt Long Term Debt + Short Term Debt
Total Assets
TD
Board Size Total number of board members BS
Ownership
Concentration
Stock owned by large investors more than 3 % of total share
capital
OC
Institutional
Ownership
Stock owned by institutions
Total number of shares
IO
CEO duality If CEO is the chairman 1 if not 0 CE
Board
Independence
Number of non- executive directors
Total number of directors
BI
Table 3 Descriptive analysis
Variable Minimum maximum mean Std deviation skewness Kurtosis
DE 00 101.5 9.64 18.08 3.44 13.25
TD .01 3.87 .52 .38 1.67 7.77
LTDA 00 2.64 .23 .22 1.23 4.10
STDA 00 2.76 .33 .28 1.49 5.05
ONC .20 .94 .66 .16 -.92 1.66
BI 00 .83 .25 .29 .66 -1.63
BS 5.0 21.0 7.27 3.48 2.43 7.48
ISR .03 .91 .59 .19 -.86 1.05
CED 00 1.0 .93 .25 -3.66 12.21](https://image.slidesharecdn.com/b01020816-150430042834-conversion-gate02/85/Capital-Structure-andCorporate-Governance-practices-Evidence-from-Listed-Non-Financial-Firms-on-Nairobi-Securities-Exchange-Kenya-6-320.jpg)


This paper investigates the impact of corporate governance on capital structure in non-financial firms listed on the Nairobi Securities Exchange, using a sample of 30 companies from 2007 to 2011. The results indicate a positive correlation between total debt to asset ratio and CEO duality, while larger boards and higher ownership concentrations correlate with lower debt levels. The study emphasizes the importance of good corporate governance practices for enhancing firm value and mitigating risks associated with financial management.


![11.[1 10]earnings management and corporate governance in nigeria](https://cdn.slidesharecdn.com/ss_thumbnails/11-1-10earningsmanagementandcorporategovernanceinnigeria-120512235341-phpapp01-thumbnail.jpg?width=640&height=640&fit=bounds)


