Download to read offline
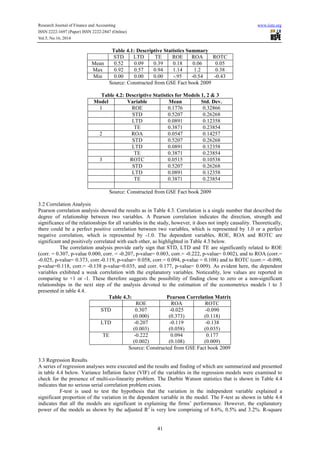
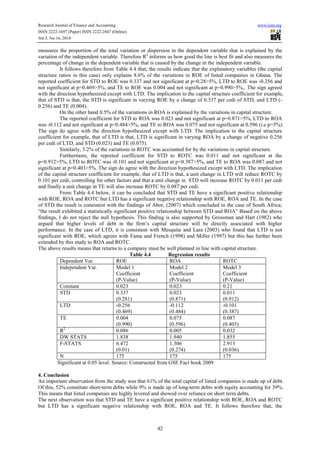

This study examined the relationship between capital structure and firm performance of listed companies in Ghana from 2004 to 2008. Capital structure was represented by short term debt, long term debt, and total equity. Firm performance was measured using return on equity, return on assets, and return on total capital. Regression analysis was conducted using these variables. The analysis found that short term debt, long term debt, and total equity accounted for a small percentage of the variations in return on equity, return on assets, and return on total capital. Specifically, short term debt and total equity had a positive relationship with performance measures, while long term debt had a negative relationship. The study observed that listed Ghanaian companies rely heavily on short term debt


