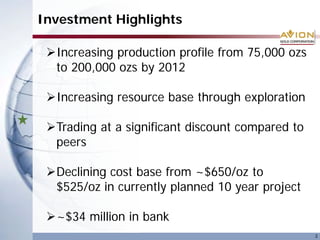
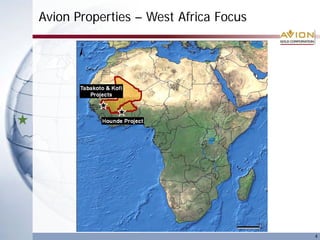
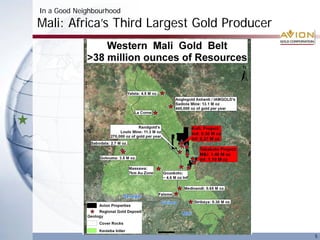
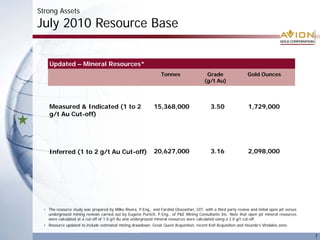
Company
                                  December 2010
                  Presentation         AVR: TSX-V
                                       AVGCF: OTCQX


New Gold Producer In Elephant Country
Forward-Looking Statement

This press release contains forward-looking statements under Canadian securities legislation. Forward-looking statements include, but are
not limited to, statements with respect to the development potential and timetable of the Mali projects; the Company’s ability to raise
additional funds as necessary; the future price of gold; the estimation of mineral resources; conclusions of economic evaluation (including
scoping studies); the realization of mineral resource estimates; the timing and amount of estimated future production, development and
exploration; costs of future activities; capital and operating expenditures; success of exploration activities; mining or processing issues;
currency exchange rates; government regulation of mining operations; and environmental risks. Generally, forward-looking statements can
be identified by the use of forward-looking terminology such as “plans”, “expects” or “does not expect”, “is expected”, “budget”, “scheduled”,
“estimates”, “forecasts”, “intends”, “anticipates” or “does not anticipate”, or “believes”, or variations of such words and phrases or
statements that certain actions, events or results “may”, “could”, “would”, “might” or “will be taken”, “occur” or “be achieved”. Forward-
looking statements are based on the opinions and estimates of management as of the date such statements are made. Estimates
regarding the anticipated timing, amount and cost of mining at the Mali projects are based on assumptions underlying mineral resource
estimates and the realization of such estimates; results of previous mining activities at the projects, and detailed research and analysis
completed by independent of the Company; research and estimates regarding the timing of delivery for long-lead items; knowledge
regarding the factors consultants and management involved in building a mine and other factors that will be described in the technical
report summarizing the scoping study that will be filed under the profile of the Company on SEDAR. Capital and operating cost estimates
are based on results of previous mining activities, research of the Company and independent consultants, recent estimates of construction
and mining costs and other factors that are set out in the scoping study. Production estimates are based on mine plans and production
schedules, which have been developed by the Company’s personnel and independent consultants. Forward-looking statements are subject
to known and unknown risks, uncertainties and other factors that may cause the actual results, level of activity, performance or
achievements of the Company to be materially different from those expressed or implied by such forward-looking statements, including but
not limited to risks related to: timing and availability of external financing on acceptable terms; unexpected events and delays during
construction, expansion and start-up; variations in ore grade and recovery rates; receipt and revocation of government approvals; actual
results of exploration and mining activities; changes in project parameters as plans continue to be refined; future prices of gold; failure of
plant, equipment or processes to operate as anticipated; accidents, labour disputes and other risks of the mining industry. Although
management of the Company has attempted to identify important factors that could cause actual results to differ materially from those
contained in forward-looking statements, there may be other factors that cause results not to be as anticipated, estimated or intended.
There can be no assurance that such statements will prove to be accurate, as actual results and future events could differ materially from
those anticipated in such statements. Accordingly, readers should not place undue reliance on forward-looking statements. The Company
does not undertake to update any forward-looking statements except in accordance with applicable securities laws.
Investors are advised that National Instrument NI 43-101 of the Canadian Securities Administrators requires that each category of mineral
reserves and mineral resources be reported separately. Mineral resources that are not mineral reserves do not have demonstrated
economic viability.
Cautionary Note to U.S. Investors Concerning Estimates of Measured, Indicated or Inferred Resources
The information presented uses the terms “measured”, “indicated” and “inferred” mineral resources. United States investors are advised
that while such terms are recognized and required by Canadian regulations, the United States Securities and Exchange Commission does
not recognize these terms. “Inferred mineral resources” have a great amount of uncertainty as to their existence, and as to their economic
and legal feasibility. It cannot be assumed that all or any part of an inferred mineral resource will ever be upgraded to a higher category.
Under Canadian rules, estimates of inferred mineral resources may not form the basis of feasibility or other economic studies. United States
investors are cautioned not to assume that all or any part of measured or indicated mineral resources will ever be converted into mineral
reserves. United States investors are also cautioned not to assume that all or any part of an inferred mineral resource exists, or is
economically or legally mineable.
                                                                                                                                                 2
Investment Highlights

 Increasing production profile from 75,000 ozs
  to 200,000 ozs by 2012

 Increasing resource base through exploration

 Trading at a significant discount compared to
  peers

 Declining cost base from ~$650/oz to
  $525/oz in currently planned 10 year project

 ~$34 million in bank
                                                  3
Avion Properties – West Africa Focus


                                       4
In a Good Neighbourhood
Mali: Africa’s Third Largest Gold Producer


                                             5
Bringing Value Sooner
Delivering Production Expansion into Gold’s Bull Market

51,000   ounces in 2009
75,000-85,000 ounces in 2010
 Plan to ramp up to a 200,000 ounce run-rate in 2012
Three major exploration packages
                                                                       October 2010
                                                                       -Avion closes acquisition of Hounde
                                                                        Group Concession from Avocet
                                                                       -Vindaloo Resource Announced
                                               March 2010
                                               Avion announces purchase of Axmin’s
                                               interest in Kofi Group Concession
                                  January 2010
                                  Avion completes acquisition of Great Quest interest in
                                  Kenieba Concession
                     May 2009
                     -Commercial Production Declared
                     -Avion acquires Dynamite Resources
                     -Avion Produces Second Technical Report (2.35 Moz)
       February 2009
       Avion restarts Mill at Tabakoto
December 2008
-Tabakoto Property purchased from Nevsun
-Avion produces First Technical Report (940,000 oz)
                                                                                                             6
Strong Assets
July 2010 Resource Base


     Updated – Mineral Resources*
                                                                   Tonnes                   Grade                  Gold Ounces
                                                                                           (g/t Au)


     Measured & Indicated (1 to 2                              15,368,000                      3.50                 1,729,000
     g/t Au Cut-off)


     Inferred (1 to 2 g/t Au Cut-off)                          20,627,000                      3.16                 2,098,000


  • The resource study was prepared by Milko Rivera, P.Eng., and Farshid Ghazanfari, GIT, with a third party review and initial open pit versus
    underground mining reviews carried out by Eugene Puritch, P.Eng., of P&E Mining Consultants Inc. Note that open pit mineral resources
    were calculated at a cut-off of 1.0 g/t Au and underground mineral resources were calculated using a 2.0 g/t cut-off.
  • Resource updated to include estimated mining drawdown, Great Quest Acquisition, recent Kofi Acquisition and Hounde’s Vindaloo zone.

                                                                                                                                                  7
Increasing Resource Base
                       Production
                          Start
                 4.5                                           +Vindaloo
                  4
                                                 +Kofi
                 3.5
                  3
Million ounces


                                                         +Dioulafoundou
                 2.5
                                                 +GQ
                  2                                                       M&I
                                     +Tabakoto                            Inferred
                 1.5                                                      Total Res


                  1
                         Segala
                 0.5
                  0


                  2008              2009               2010
                                                                                      8
2009 – A Great Start Up – 51,000 oz. Produced
2010 – Steady Growth in Production
25000                               1000
                                    900
20000                               800
                                    700
15000                               600
                                    500
10000                               400
                                    300    Oz. Produced
 5000                               200
                                           Cost/Oz.
                                    100
   0                                0


        Estimated 2010 Production
        of 75,000 – 85,000 oz. Au
                                                          9
Avion Production To Date

 2009
                                        2009 Total (1)(2)(3)(4)

 Ore Milled (000 t)                              562.8
 Head Grade (g/t Au)                              2.95
 Recovery (%)                                     95.4
 Gold Production (oz)                            51,291
  (1) Mill was restarted on February 17, 2009. Gold production includes 747 oz recovered
      from plant clean-up work in 2009 prior to the mill restart.
  (2) Commercial production was declared May 1, 2009.
  (3) Includes 2 weeks downtime due to heavy rainfall and road transportation issues.
  (4) 2009 Total adjusted by -483 oz to reconcile to refined ounces.


 2010
                                           Q1             Q2         Q3            Q4       2010 YTD
                                                                                (October)
 Ore Milled (000 t)                      156.1           183.1      178.8           64.5     518.1
 Head Grade (g/t Au)                      3.26           3.95        4.28           4.53      3.86
 Recovery (%)                             96.5           95.8        96.2           97.3      96.1
 Gold Production (oz)(1)                15,710       22,222        23,609         9,123      70,664
 (1) Ounces adjusted to final refined product
                                                                                                       10
Production Growth

  Au Production and Cash Costs
 Production (000 Au oz)                                                                                                Cash Cost (US$)
     250                                                                                                                        $650

                                                                                                                                $600
     200                                                         Cash Costs
                                                                                                                                $550
     150                                                                                                                        $500

     100                                                                                                                        $450

                                                                                                                                $400
       50
                                                         Au Production                                                          $350

         0                                                                                                                      $300
                     2009                   2010                  2011                  2012             2013 - 2022
                             Segala (OP)             Segala/Taba            Tabakoto etc.
                                                      (UG)                  (OP)
 Mine plan presented in the scoping study prepared by M. Rivera, P. Eng, (independent) with the support of T, Mann, P.Eng. (independent) and
 Andrew Bradfield, P.Eng. (COO). Resource estimate prepared by Eugene Puritch and Antoine Yassa of P&E Mining Consultants. Using Canaccord
 Adams Research’s gold price forecast of US$900/oz in 2009, US$850/oz in 2010, US$800/oz in 2011 and US$750/oz in 2012, open pit and
 underground recoveries of 90% and 85%, respectively, UG equipment will be leased, UG mining by mechanized long hole retreat

                                                                                                                                               11
200,000 oz/year Run-Rate in 2012

                                             2010                2011          2012
Anticipated project milestones
                                       Q1   Q2   Q3   Q4   Q1   Q2   Q3   Q4    Q1
60,000 metre exploration program       •    •    •    •

Future exploration programs                                •    •    •    •     •

Update plant expansion study           •

Gravity gold vs leach study            •

Order plant long lead time equipment             •

Tabakoto underground development                 •    •    •    •    •    •

Update mineral resource statement                     •

Issue NI43-101 report with mine plan                  •

Mine other open pits                                  •    •    •    •    •     •

Segala underground development                             •    •    •    •     •

Plant expansion construction                               •    •    •    •     •

200,000 oz/year gold production                                                 ◊


                                                                                     12
Strong Assets
Large, Target-Rich Property with Central Milling Complex
                                                         Approx. 132 km2

                        8.51 g/t Au/10.5m

                            2.28 g/t Au/45.0m
                                                        Segala Deposit

                            2.72 g/t Au/73.5m

    Mill – 2100 tpd
    Roads                                    15.27 g/t Au/3.7m
                                            13.56 g/t Au/22.5m


    Tailings pond
                                                   Dar Salam
                                                                      67.08 g/t Au/4.0m

                                            7.41 g/t Au/11.5m         15.56 g/t Au/24.0m
                                            11.6 g/t Au/13.8m

    Power                                                           Tabakoto Mine


    Water
                                                                 Dioulafoundou
                                         10.96 g/t Au/6.0m       21.77 g/t Au/21.0m

                                Fougala
                              7.53 g/t Au/20.0 m

                      Kenieba Property                                                     3 km
                                                                                                  13
Strong Assets
$US100M Assets Acquired for <$0.20 on the Dollar (2008)


                                         Camp – now houses 150 staff


          Milling Facility – 2,100 tpd


                                                Power Supply


          Fuel Supply – Contracted            Current Segala Pit

                                                                       14
Current Segala Main Pit Mining
Avion is Mali’s 4th Largest Gold Company


                            Segala Mine Plan

                                               15
Resource Expansion Potential

 Four Target Concepts

  1   Segala at depth – underground potential

  2   Tabakoto at depth, and around pit
                                                  4   Approx. 132 km2
  3   Remainder of property
      – numerous targets                      4
  4   New Properties                              1
                                                          3


                                                         2
                                              3
                                                                    3 km


                                          4
                                                                           16
Target-Rich Exploration Package (~500 km2)


                                                  10 km


                              75% of drill holes have
                               intersected gold!
                              $12 Million Exploration
                               Budget for 2010
                              Total Project (Avion +
                               Great Quest+Kofi)
                               Resource 3.9 M ozs*
                             * At 1.0 and 2.0 g/t cut-offs


                                                             17
Hounde – Burkina Faso


                        18
Low Cost Ounces in the Ground = LEVERAGE


 What Does the Market Pay?

 US $209 Per Total Resource Ounce*
 * Wellington West research November 30th, 2010

 What is Market Paying Avion?

 US $121 Per Resource Ounce

 More Ounces to Come!
                 Organic Growth – recent drilling
                 Great Quest (324,000 oz)
                 Hounde Acquisition (610,000 oz)
                 Kofi Acquisition (670,000 oz)

                                                     19
Comparable Trading Multiples

 Avion is significantly undervalued relative to its peer group based on cash
 flow and P/NAV multiples

                              P / CFPS                                                                              P / NAV1
                                                                                                                                       1.2x
                          9.5x
                                                                 8.9x
                                                                                                                 1.0x


           4.2x


                                                  2.7x


                  2011                                   2012                                                              P/NAV

                             Avion    Producer Peers                                                               Avion    Producer Peers


1.        NAVPS uses 5% discount rate and long-term metal prices of US$950/oz Au and US$17.25/oz Ag
Note:     Producer Peers include Alamos Gold, Aura Minerals, B2Gold, Centamin Egypt, Endeavour Mining, Gammon Gold, Gold Wheaton, Golden Star Resources, Minefinders,
          New Gold, Northgate Minerals and Primero Mining
Source:   Canaccord Genuity Research and public market research (updated November 12, 2010)

                                                                                                                                                                        20
Low Valuation Compared to Peers

                                                                                                              AVERAGE
                                3,250
                                                                                        SMF
                                3,000                                                                   NGD
                                                                     EGU
                                2,750
Market Capitalization (US$mm)


                                2,500
                                                         ANV
                                2,250
                                             AGI                                 Avion Gold
                                2,000                                            (Future)
                                1,750
                                1,500                                                                         GSS

                                1,250                                ARZ
                                                  SGR
                                1,000                                      GAM
                                                                                                 NXG
                                            KGI                BTO
                                 750                    MFL

                                 500
                                 250                Avion Gold

                                   0
                                        0                100                     200           300              400     500
                                                                           2010E Production (000's oz Au)


                                                                                                                              21
Avion Gold Corporation’s Capital Structure


                    Exchange       TSX Venture

                        Ticker     AVR
                                                       Debt
Shares Outstanding – basic         371 million
              Fully diluted        431 million


         52-Week High/Low          $1.59 - $0.39   • Strong Balance Sheet
                                                   • $18 Million in the money
Recent Price (Dec 1, 2010)         $1.51             warrants (May 2011)

       Market Capitalization       ~$560 million


*Current Cash position of ~$34 Million

                                                                                22
Avion Gold Corporation


       MAJOR SHAREHOLDERS
  Sprott Asset Management ~19%
  Sentry Select ~10%
  Pinetree Capital ~5%
  Maple Leaf Partners ~5%
  Front Street ~3%
  Aberdeen International ~3%
  Management/Insiders ~2%

                                  23
Independent Research & Media Coverage

 Independent Research – Full Coverage
 Firm                          Analyst
 Canaccord Genuity             Eric Zaunscherb
 Wellington West               Paolo Lostritto

 Independent Research – Research Notes
 Firm                          Analyst
 BMO Capital Markets           Andrew Breichmanas
 Byron Capital                 Drew Clark
 Desjardins Securities         Brian Christie
 NB Financial                  Tara Hassan


 Media Coverage
 Firm
 OB Research

                                                    24
Experienced Management Team & Board


 MANAGEMENT

 John Begeman, President, CEO and Director
 Don Dudek, Senior VP Exploration and Director
 Greg Duras, CFO
 Andrew Bradfield, Chief Operating Officer


 BOARD OF DIRECTORS

 Stan Bharti – Executive Chairman
 John Begeman
 Bruce Humphrey
 Lewis Mackenzie, Major General (Ret.)
 Don Dudek
 Honorable Pierre Pettigrew
 George Faught


                                                 25
Avion Gold Corporation


  Contacts:                     Address:
  John Begeman                  65 Queen Street West #800
  President & CEO               PO Box 67
  Tel: (416) 861-5884           Toronto, ON M5H 2M5
  jbegeman@aviongoldcorp.com
                                www.aviongoldcorp.com
  Michael McAllister
  Manager, Investor Relations
  Tel: (416) 309-2134
  info@aviongoldcorp.com

                                                            26

Avion Corporate Presentation

  • 1.
    Company December 2010 Presentation  AVR: TSX-V  AVGCF: OTCQX New Gold Producer In Elephant Country
  • 2.
    Forward-Looking Statement This pressrelease contains forward-looking statements under Canadian securities legislation. Forward-looking statements include, but are not limited to, statements with respect to the development potential and timetable of the Mali projects; the Company’s ability to raise additional funds as necessary; the future price of gold; the estimation of mineral resources; conclusions of economic evaluation (including scoping studies); the realization of mineral resource estimates; the timing and amount of estimated future production, development and exploration; costs of future activities; capital and operating expenditures; success of exploration activities; mining or processing issues; currency exchange rates; government regulation of mining operations; and environmental risks. Generally, forward-looking statements can be identified by the use of forward-looking terminology such as “plans”, “expects” or “does not expect”, “is expected”, “budget”, “scheduled”, “estimates”, “forecasts”, “intends”, “anticipates” or “does not anticipate”, or “believes”, or variations of such words and phrases or statements that certain actions, events or results “may”, “could”, “would”, “might” or “will be taken”, “occur” or “be achieved”. Forward- looking statements are based on the opinions and estimates of management as of the date such statements are made. Estimates regarding the anticipated timing, amount and cost of mining at the Mali projects are based on assumptions underlying mineral resource estimates and the realization of such estimates; results of previous mining activities at the projects, and detailed research and analysis completed by independent of the Company; research and estimates regarding the timing of delivery for long-lead items; knowledge regarding the factors consultants and management involved in building a mine and other factors that will be described in the technical report summarizing the scoping study that will be filed under the profile of the Company on SEDAR. Capital and operating cost estimates are based on results of previous mining activities, research of the Company and independent consultants, recent estimates of construction and mining costs and other factors that are set out in the scoping study. Production estimates are based on mine plans and production schedules, which have been developed by the Company’s personnel and independent consultants. Forward-looking statements are subject to known and unknown risks, uncertainties and other factors that may cause the actual results, level of activity, performance or achievements of the Company to be materially different from those expressed or implied by such forward-looking statements, including but not limited to risks related to: timing and availability of external financing on acceptable terms; unexpected events and delays during construction, expansion and start-up; variations in ore grade and recovery rates; receipt and revocation of government approvals; actual results of exploration and mining activities; changes in project parameters as plans continue to be refined; future prices of gold; failure of plant, equipment or processes to operate as anticipated; accidents, labour disputes and other risks of the mining industry. Although management of the Company has attempted to identify important factors that could cause actual results to differ materially from those contained in forward-looking statements, there may be other factors that cause results not to be as anticipated, estimated or intended. There can be no assurance that such statements will prove to be accurate, as actual results and future events could differ materially from those anticipated in such statements. Accordingly, readers should not place undue reliance on forward-looking statements. The Company does not undertake to update any forward-looking statements except in accordance with applicable securities laws. Investors are advised that National Instrument NI 43-101 of the Canadian Securities Administrators requires that each category of mineral reserves and mineral resources be reported separately. Mineral resources that are not mineral reserves do not have demonstrated economic viability. Cautionary Note to U.S. Investors Concerning Estimates of Measured, Indicated or Inferred Resources The information presented uses the terms “measured”, “indicated” and “inferred” mineral resources. United States investors are advised that while such terms are recognized and required by Canadian regulations, the United States Securities and Exchange Commission does not recognize these terms. “Inferred mineral resources” have a great amount of uncertainty as to their existence, and as to their economic and legal feasibility. It cannot be assumed that all or any part of an inferred mineral resource will ever be upgraded to a higher category. Under Canadian rules, estimates of inferred mineral resources may not form the basis of feasibility or other economic studies. United States investors are cautioned not to assume that all or any part of measured or indicated mineral resources will ever be converted into mineral reserves. United States investors are also cautioned not to assume that all or any part of an inferred mineral resource exists, or is economically or legally mineable. 2
  • 3.
    Investment Highlights Increasingproduction profile from 75,000 ozs to 200,000 ozs by 2012 Increasing resource base through exploration Trading at a significant discount compared to peers Declining cost base from ~$650/oz to $525/oz in currently planned 10 year project ~$34 million in bank 3
  • 4.
    Avion Properties –West Africa Focus 4
  • 5.
    In a GoodNeighbourhood Mali: Africa’s Third Largest Gold Producer 5
  • 6.
    Bringing Value Sooner DeliveringProduction Expansion into Gold’s Bull Market 51,000 ounces in 2009 75,000-85,000 ounces in 2010  Plan to ramp up to a 200,000 ounce run-rate in 2012 Three major exploration packages October 2010 -Avion closes acquisition of Hounde Group Concession from Avocet -Vindaloo Resource Announced March 2010 Avion announces purchase of Axmin’s interest in Kofi Group Concession January 2010 Avion completes acquisition of Great Quest interest in Kenieba Concession May 2009 -Commercial Production Declared -Avion acquires Dynamite Resources -Avion Produces Second Technical Report (2.35 Moz) February 2009 Avion restarts Mill at Tabakoto December 2008 -Tabakoto Property purchased from Nevsun -Avion produces First Technical Report (940,000 oz) 6
  • 7.
    Strong Assets July 2010Resource Base Updated – Mineral Resources* Tonnes Grade Gold Ounces (g/t Au) Measured & Indicated (1 to 2 15,368,000 3.50 1,729,000 g/t Au Cut-off) Inferred (1 to 2 g/t Au Cut-off) 20,627,000 3.16 2,098,000 • The resource study was prepared by Milko Rivera, P.Eng., and Farshid Ghazanfari, GIT, with a third party review and initial open pit versus underground mining reviews carried out by Eugene Puritch, P.Eng., of P&E Mining Consultants Inc. Note that open pit mineral resources were calculated at a cut-off of 1.0 g/t Au and underground mineral resources were calculated using a 2.0 g/t cut-off. • Resource updated to include estimated mining drawdown, Great Quest Acquisition, recent Kofi Acquisition and Hounde’s Vindaloo zone. 7
  • 8.
    Increasing Resource Base Production Start 4.5 +Vindaloo 4 +Kofi 3.5 3 Million ounces +Dioulafoundou 2.5 +GQ 2 M&I +Tabakoto Inferred 1.5 Total Res 1 Segala 0.5 0 2008 2009 2010 8
  • 9.
    2009 – AGreat Start Up – 51,000 oz. Produced 2010 – Steady Growth in Production 25000 1000 900 20000 800 700 15000 600 500 10000 400 300 Oz. Produced 5000 200 Cost/Oz. 100 0 0 Estimated 2010 Production of 75,000 – 85,000 oz. Au 9
  • 10.
    Avion Production ToDate 2009 2009 Total (1)(2)(3)(4) Ore Milled (000 t) 562.8 Head Grade (g/t Au) 2.95 Recovery (%) 95.4 Gold Production (oz) 51,291 (1) Mill was restarted on February 17, 2009. Gold production includes 747 oz recovered from plant clean-up work in 2009 prior to the mill restart. (2) Commercial production was declared May 1, 2009. (3) Includes 2 weeks downtime due to heavy rainfall and road transportation issues. (4) 2009 Total adjusted by -483 oz to reconcile to refined ounces. 2010 Q1 Q2 Q3 Q4 2010 YTD (October) Ore Milled (000 t) 156.1 183.1 178.8 64.5 518.1 Head Grade (g/t Au) 3.26 3.95 4.28 4.53 3.86 Recovery (%) 96.5 95.8 96.2 97.3 96.1 Gold Production (oz)(1) 15,710 22,222 23,609 9,123 70,664 (1) Ounces adjusted to final refined product 10
  • 11.
    Production Growth Au Production and Cash Costs Production (000 Au oz) Cash Cost (US$) 250 $650 $600 200 Cash Costs $550 150 $500 100 $450 $400 50 Au Production $350 0 $300 2009 2010 2011 2012 2013 - 2022 Segala (OP) Segala/Taba Tabakoto etc. (UG) (OP) Mine plan presented in the scoping study prepared by M. Rivera, P. Eng, (independent) with the support of T, Mann, P.Eng. (independent) and Andrew Bradfield, P.Eng. (COO). Resource estimate prepared by Eugene Puritch and Antoine Yassa of P&E Mining Consultants. Using Canaccord Adams Research’s gold price forecast of US$900/oz in 2009, US$850/oz in 2010, US$800/oz in 2011 and US$750/oz in 2012, open pit and underground recoveries of 90% and 85%, respectively, UG equipment will be leased, UG mining by mechanized long hole retreat 11
  • 12.
    200,000 oz/year Run-Ratein 2012 2010 2011 2012 Anticipated project milestones Q1 Q2 Q3 Q4 Q1 Q2 Q3 Q4 Q1 60,000 metre exploration program • • • • Future exploration programs • • • • • Update plant expansion study • Gravity gold vs leach study • Order plant long lead time equipment • Tabakoto underground development • • • • • • Update mineral resource statement • Issue NI43-101 report with mine plan • Mine other open pits • • • • • • Segala underground development • • • • • Plant expansion construction • • • • • 200,000 oz/year gold production ◊ 12
  • 13.
    Strong Assets Large, Target-RichProperty with Central Milling Complex Approx. 132 km2 8.51 g/t Au/10.5m 2.28 g/t Au/45.0m Segala Deposit 2.72 g/t Au/73.5m Mill – 2100 tpd Roads 15.27 g/t Au/3.7m 13.56 g/t Au/22.5m Tailings pond Dar Salam 67.08 g/t Au/4.0m 7.41 g/t Au/11.5m 15.56 g/t Au/24.0m 11.6 g/t Au/13.8m Power Tabakoto Mine Water Dioulafoundou 10.96 g/t Au/6.0m 21.77 g/t Au/21.0m Fougala 7.53 g/t Au/20.0 m Kenieba Property 3 km 13
  • 14.
    Strong Assets $US100M AssetsAcquired for <$0.20 on the Dollar (2008) Camp – now houses 150 staff Milling Facility – 2,100 tpd Power Supply Fuel Supply – Contracted Current Segala Pit 14
  • 15.
    Current Segala MainPit Mining Avion is Mali’s 4th Largest Gold Company Segala Mine Plan 15
  • 16.
    Resource Expansion Potential Four Target Concepts 1 Segala at depth – underground potential 2 Tabakoto at depth, and around pit 4 Approx. 132 km2 3 Remainder of property – numerous targets 4 4 New Properties 1 3 2 3 3 km 4 16
  • 17.
    Target-Rich Exploration Package(~500 km2) 10 km  75% of drill holes have intersected gold!  $12 Million Exploration Budget for 2010  Total Project (Avion + Great Quest+Kofi) Resource 3.9 M ozs* * At 1.0 and 2.0 g/t cut-offs 17
  • 18.
  • 19.
    Low Cost Ouncesin the Ground = LEVERAGE What Does the Market Pay? US $209 Per Total Resource Ounce* * Wellington West research November 30th, 2010 What is Market Paying Avion? US $121 Per Resource Ounce More Ounces to Come! Organic Growth – recent drilling Great Quest (324,000 oz) Hounde Acquisition (610,000 oz) Kofi Acquisition (670,000 oz) 19
  • 20.
    Comparable Trading Multiples Avion is significantly undervalued relative to its peer group based on cash flow and P/NAV multiples P / CFPS P / NAV1 1.2x 9.5x 8.9x 1.0x 4.2x 2.7x 2011 2012 P/NAV Avion Producer Peers Avion Producer Peers 1. NAVPS uses 5% discount rate and long-term metal prices of US$950/oz Au and US$17.25/oz Ag Note: Producer Peers include Alamos Gold, Aura Minerals, B2Gold, Centamin Egypt, Endeavour Mining, Gammon Gold, Gold Wheaton, Golden Star Resources, Minefinders, New Gold, Northgate Minerals and Primero Mining Source: Canaccord Genuity Research and public market research (updated November 12, 2010) 20
  • 21.
    Low Valuation Comparedto Peers AVERAGE 3,250 SMF 3,000 NGD EGU 2,750 Market Capitalization (US$mm) 2,500 ANV 2,250 AGI Avion Gold 2,000 (Future) 1,750 1,500 GSS 1,250 ARZ SGR 1,000 GAM NXG KGI BTO 750 MFL 500 250 Avion Gold 0 0 100 200 300 400 500 2010E Production (000's oz Au) 21
  • 22.
    Avion Gold Corporation’sCapital Structure Exchange TSX Venture Ticker AVR Debt Shares Outstanding – basic 371 million Fully diluted 431 million 52-Week High/Low $1.59 - $0.39 • Strong Balance Sheet • $18 Million in the money Recent Price (Dec 1, 2010) $1.51 warrants (May 2011) Market Capitalization ~$560 million *Current Cash position of ~$34 Million 22
  • 23.
    Avion Gold Corporation MAJOR SHAREHOLDERS  Sprott Asset Management ~19%  Sentry Select ~10%  Pinetree Capital ~5%  Maple Leaf Partners ~5%  Front Street ~3%  Aberdeen International ~3%  Management/Insiders ~2% 23
  • 24.
    Independent Research &Media Coverage Independent Research – Full Coverage Firm Analyst Canaccord Genuity Eric Zaunscherb Wellington West Paolo Lostritto Independent Research – Research Notes Firm Analyst BMO Capital Markets Andrew Breichmanas Byron Capital Drew Clark Desjardins Securities Brian Christie NB Financial Tara Hassan Media Coverage Firm OB Research 24
  • 25.
    Experienced Management Team& Board MANAGEMENT John Begeman, President, CEO and Director Don Dudek, Senior VP Exploration and Director Greg Duras, CFO Andrew Bradfield, Chief Operating Officer BOARD OF DIRECTORS Stan Bharti – Executive Chairman John Begeman Bruce Humphrey Lewis Mackenzie, Major General (Ret.) Don Dudek Honorable Pierre Pettigrew George Faught 25
  • 26.
    Avion Gold Corporation Contacts: Address: John Begeman 65 Queen Street West #800 President & CEO PO Box 67 Tel: (416) 861-5884 Toronto, ON M5H 2M5 jbegeman@aviongoldcorp.com www.aviongoldcorp.com Michael McAllister Manager, Investor Relations Tel: (416) 309-2134 info@aviongoldcorp.com 26