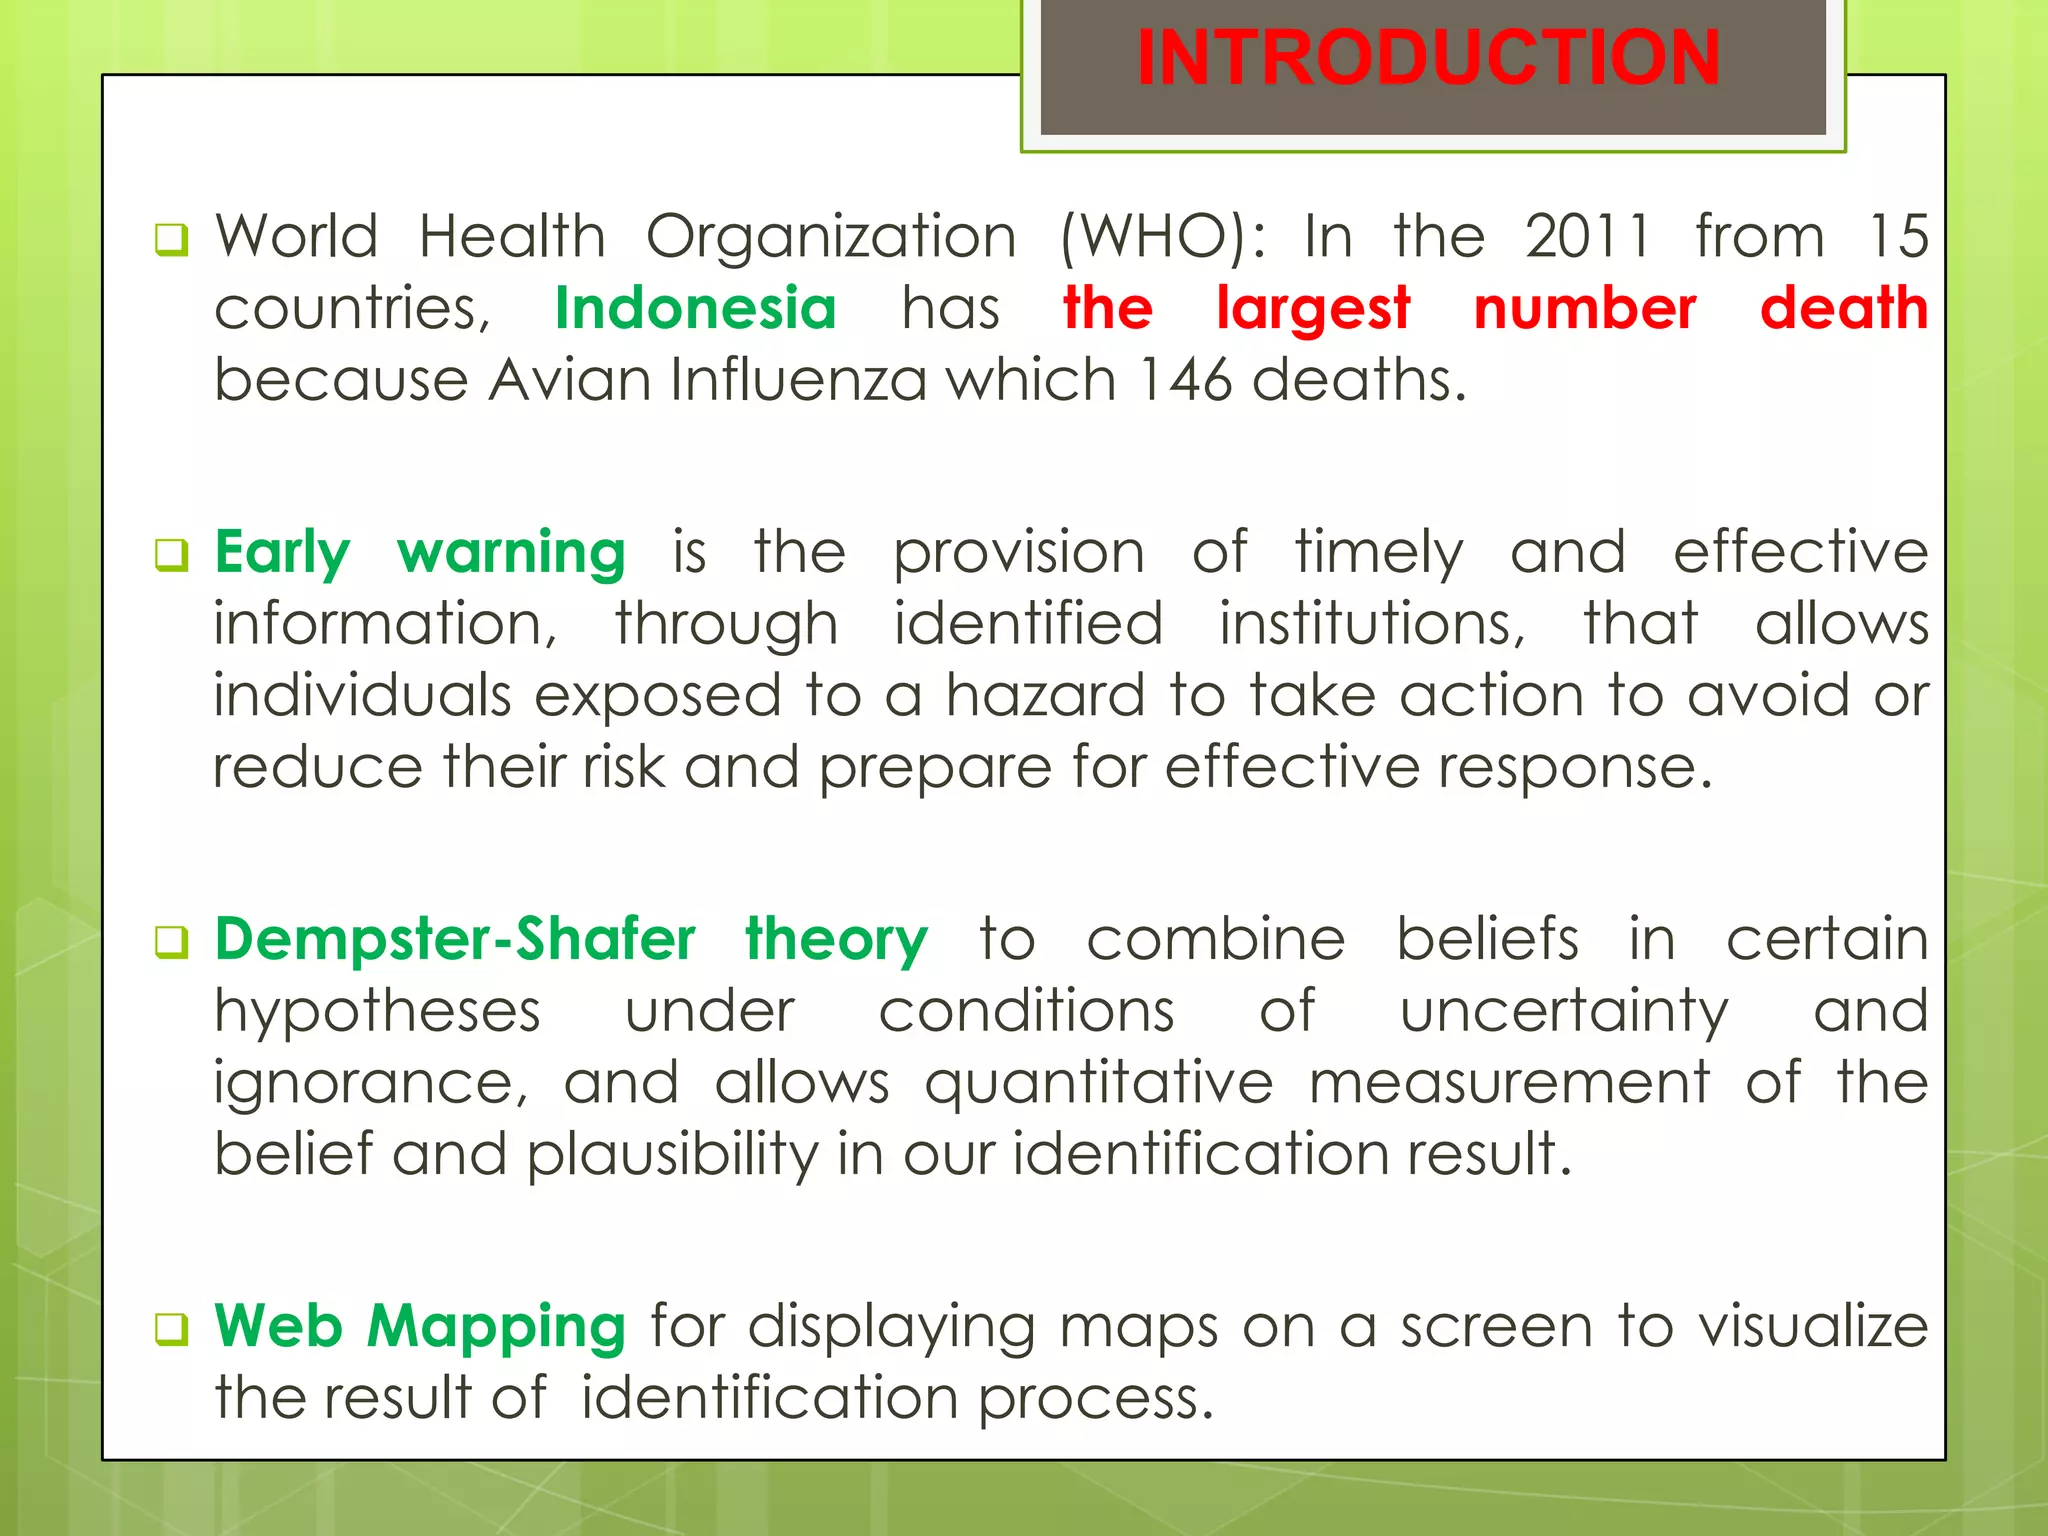
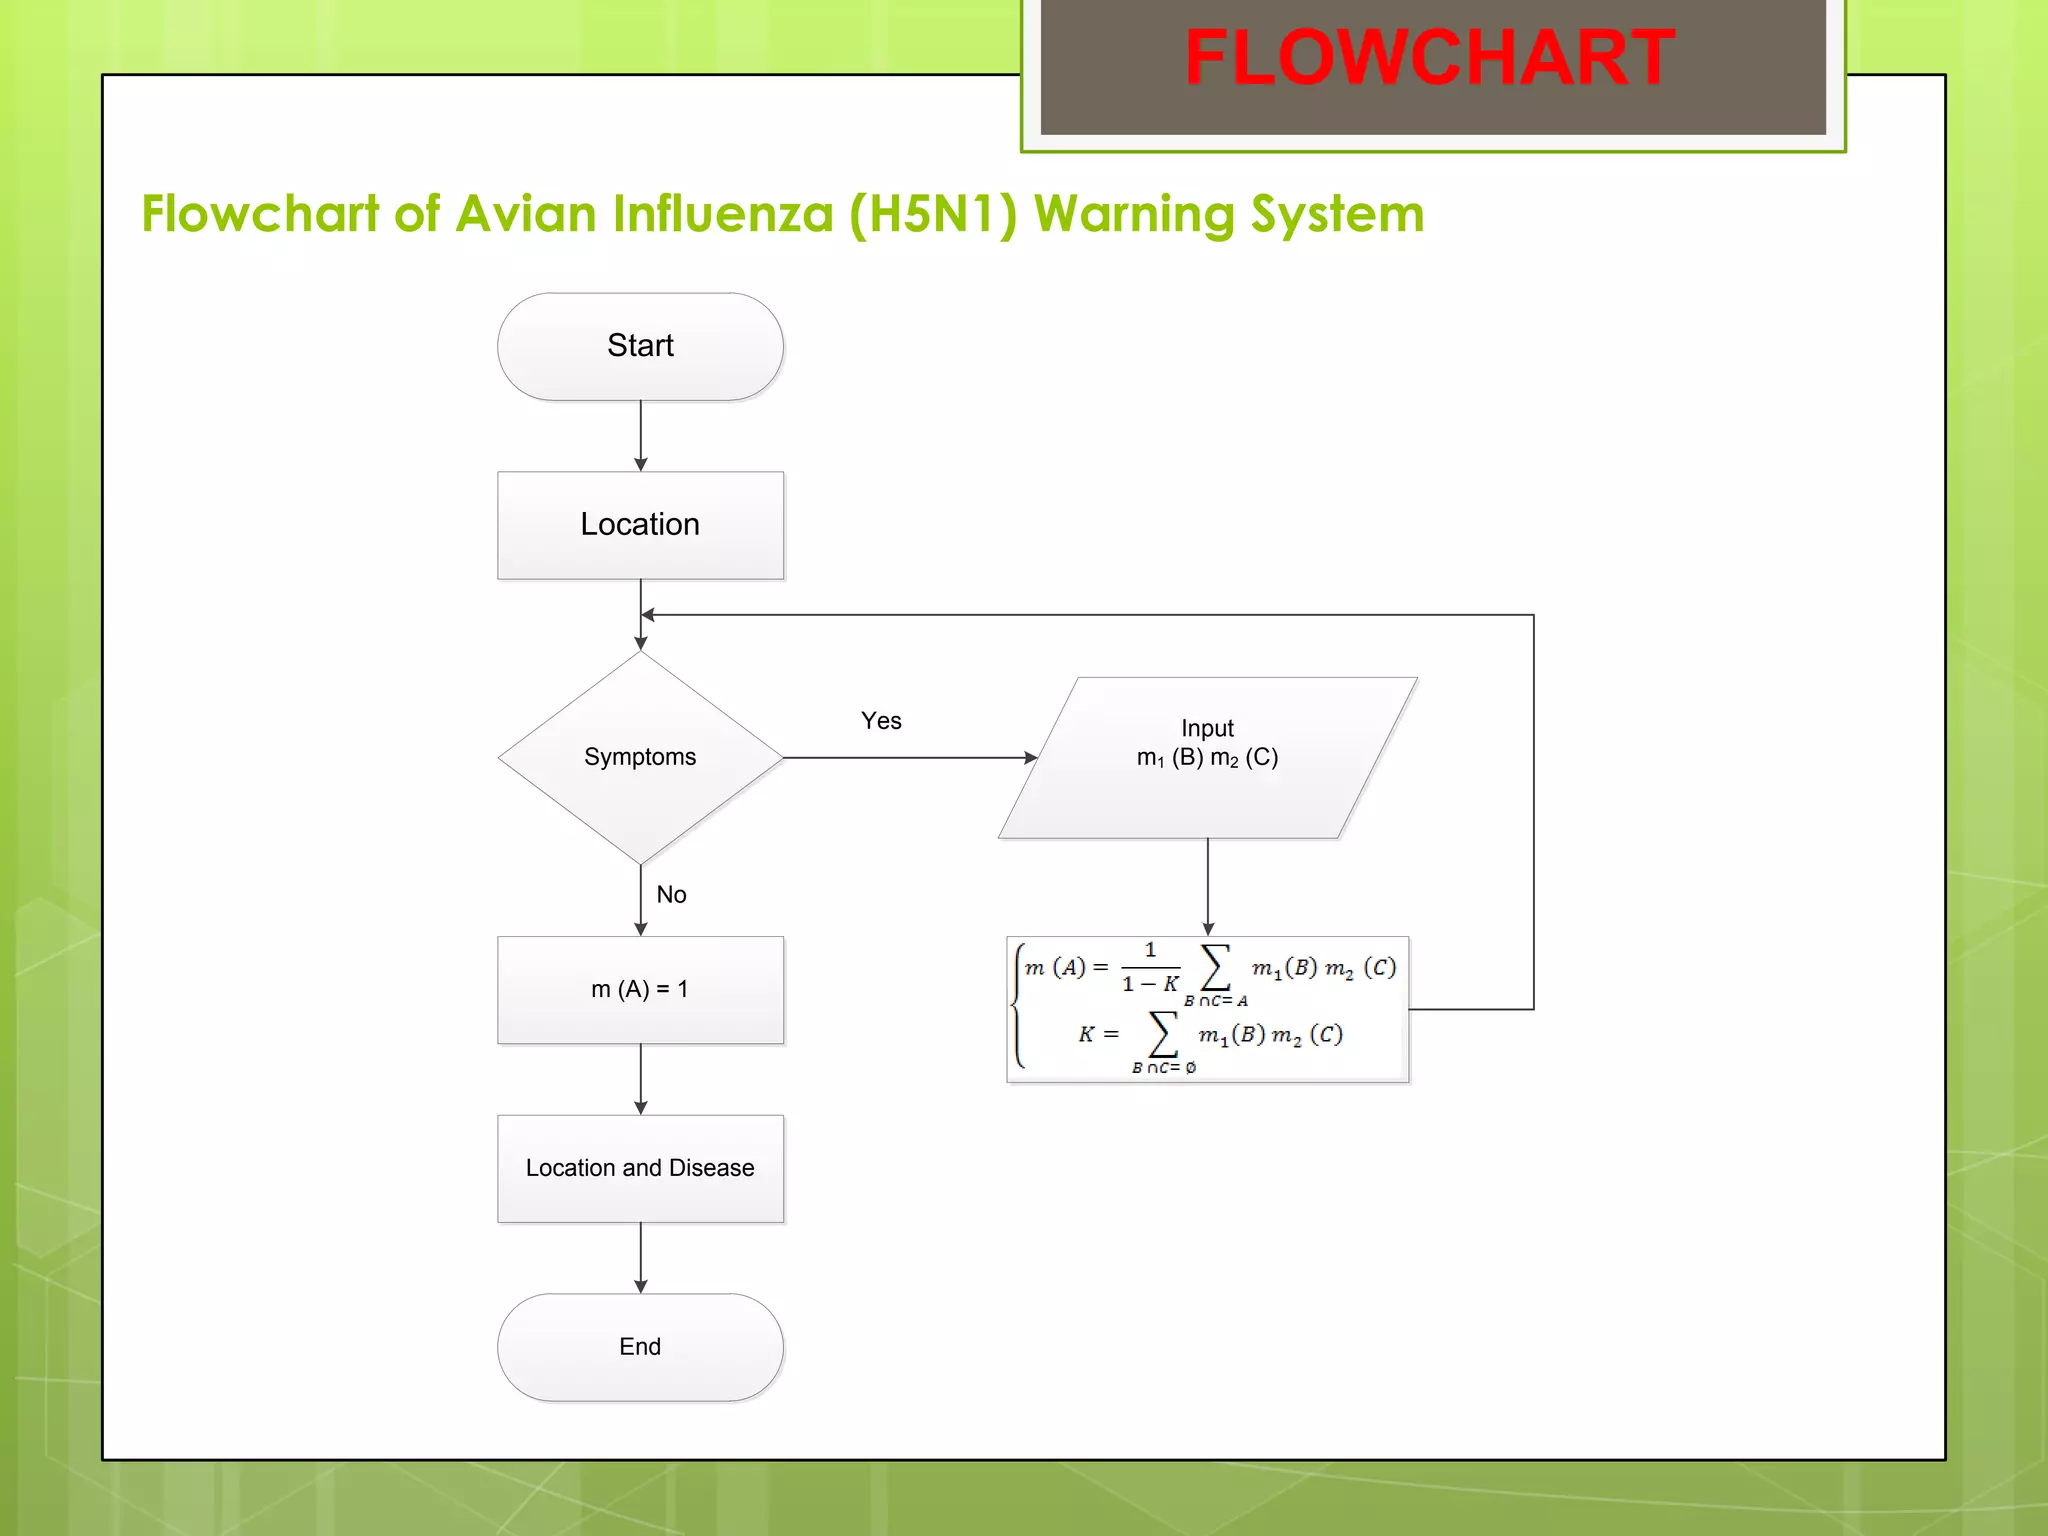
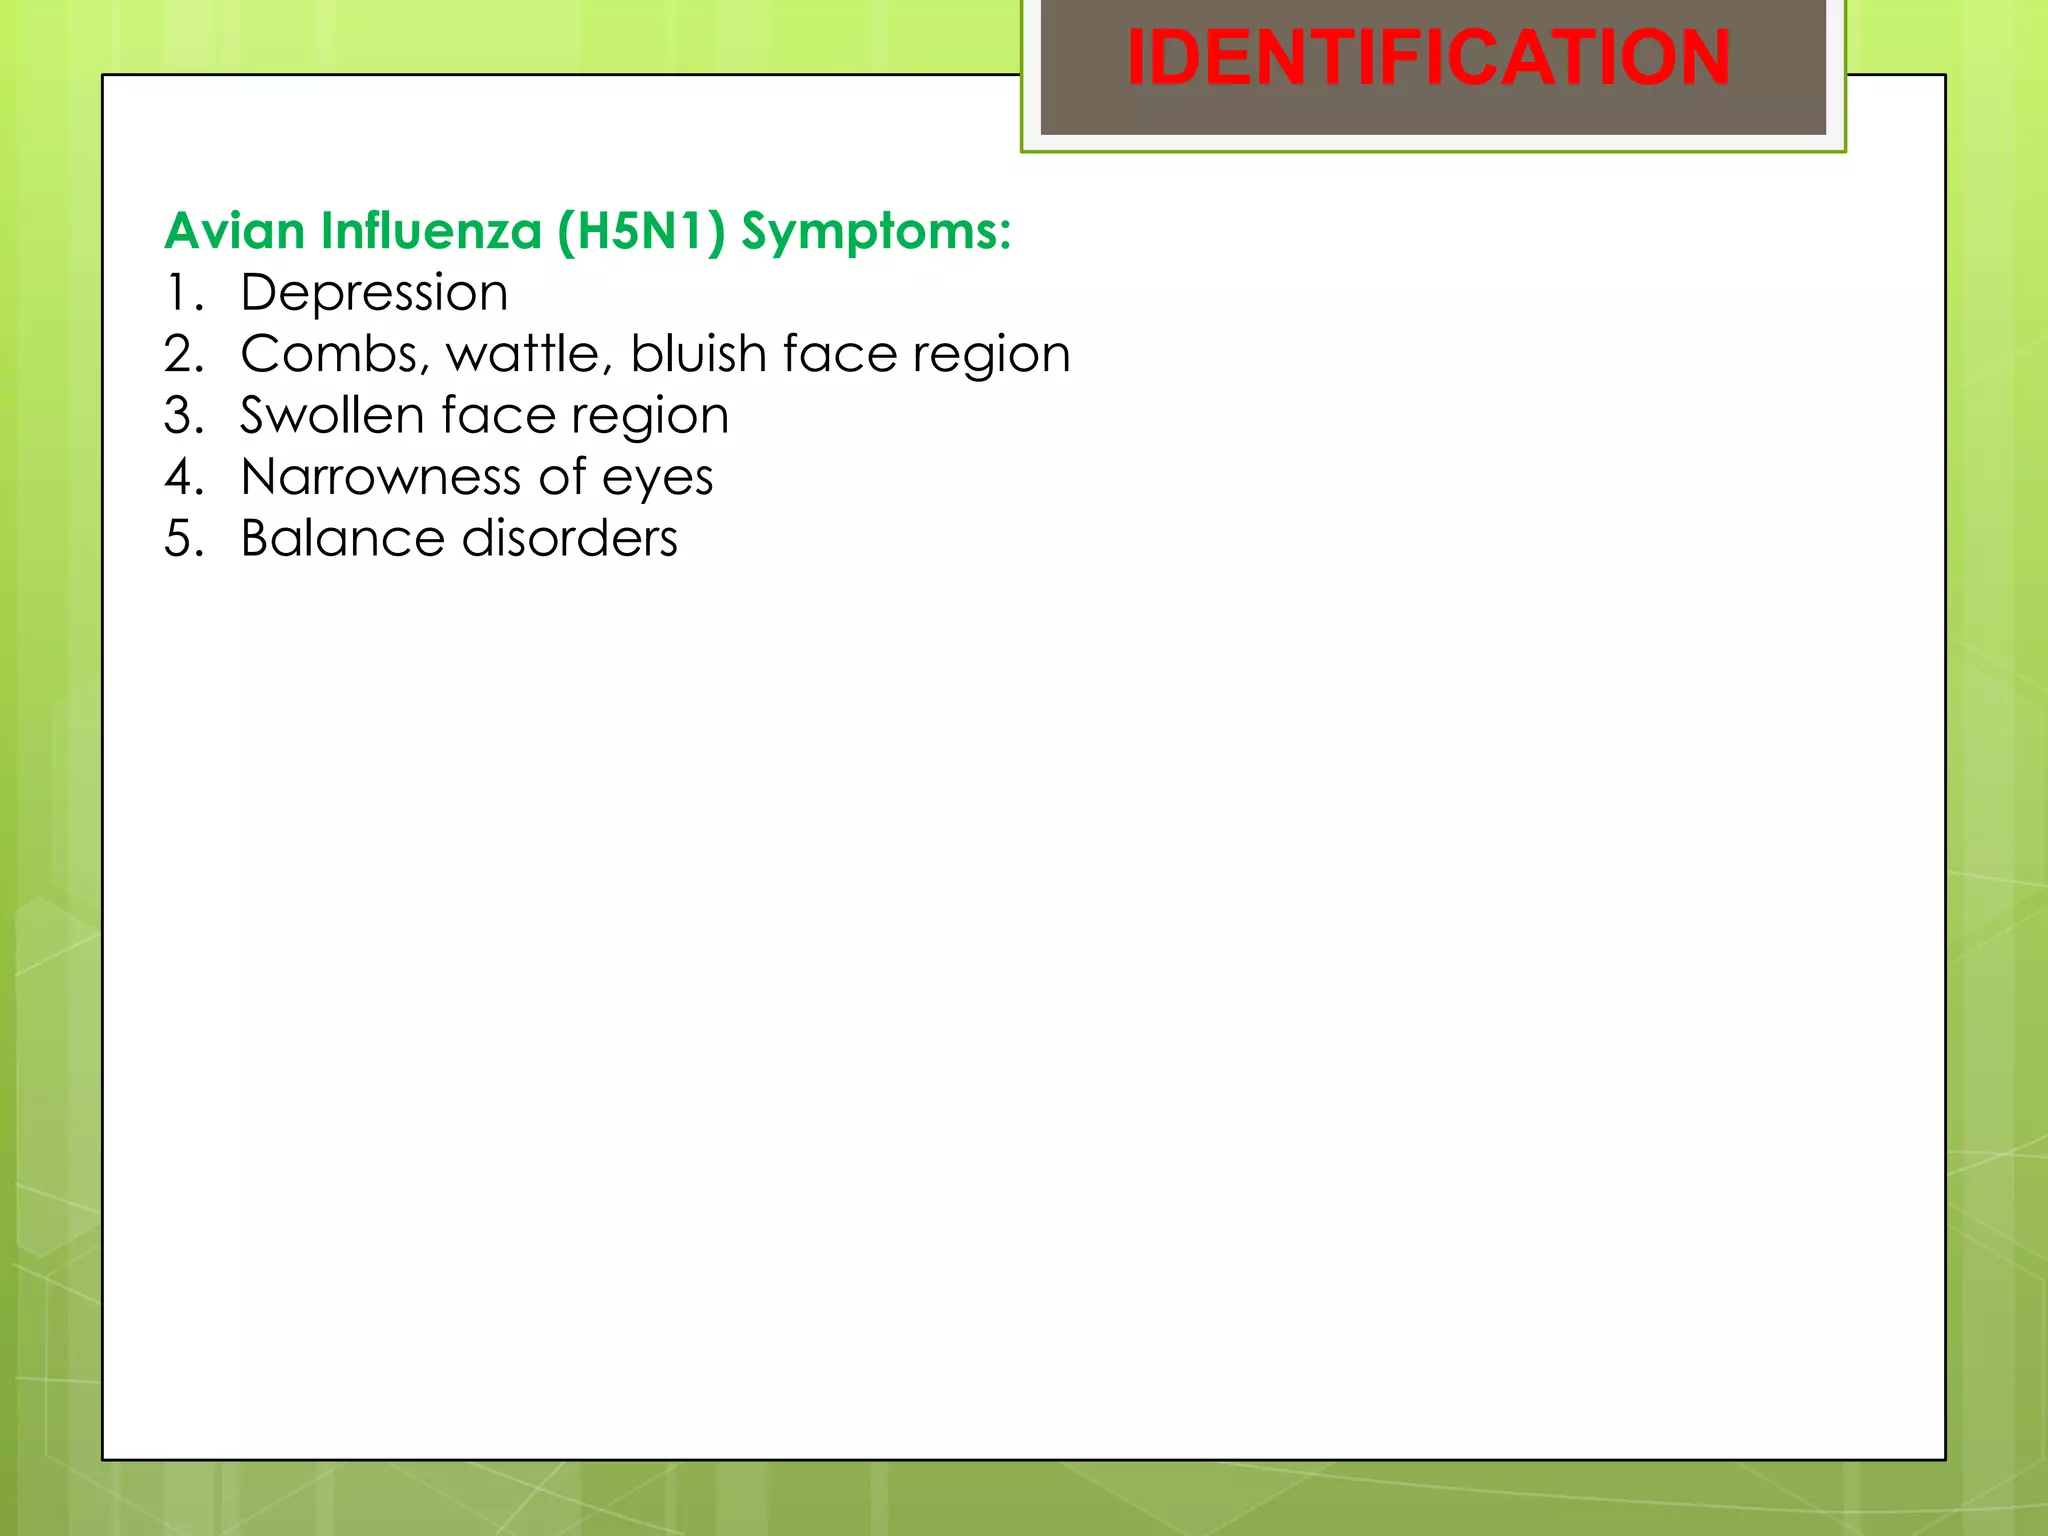
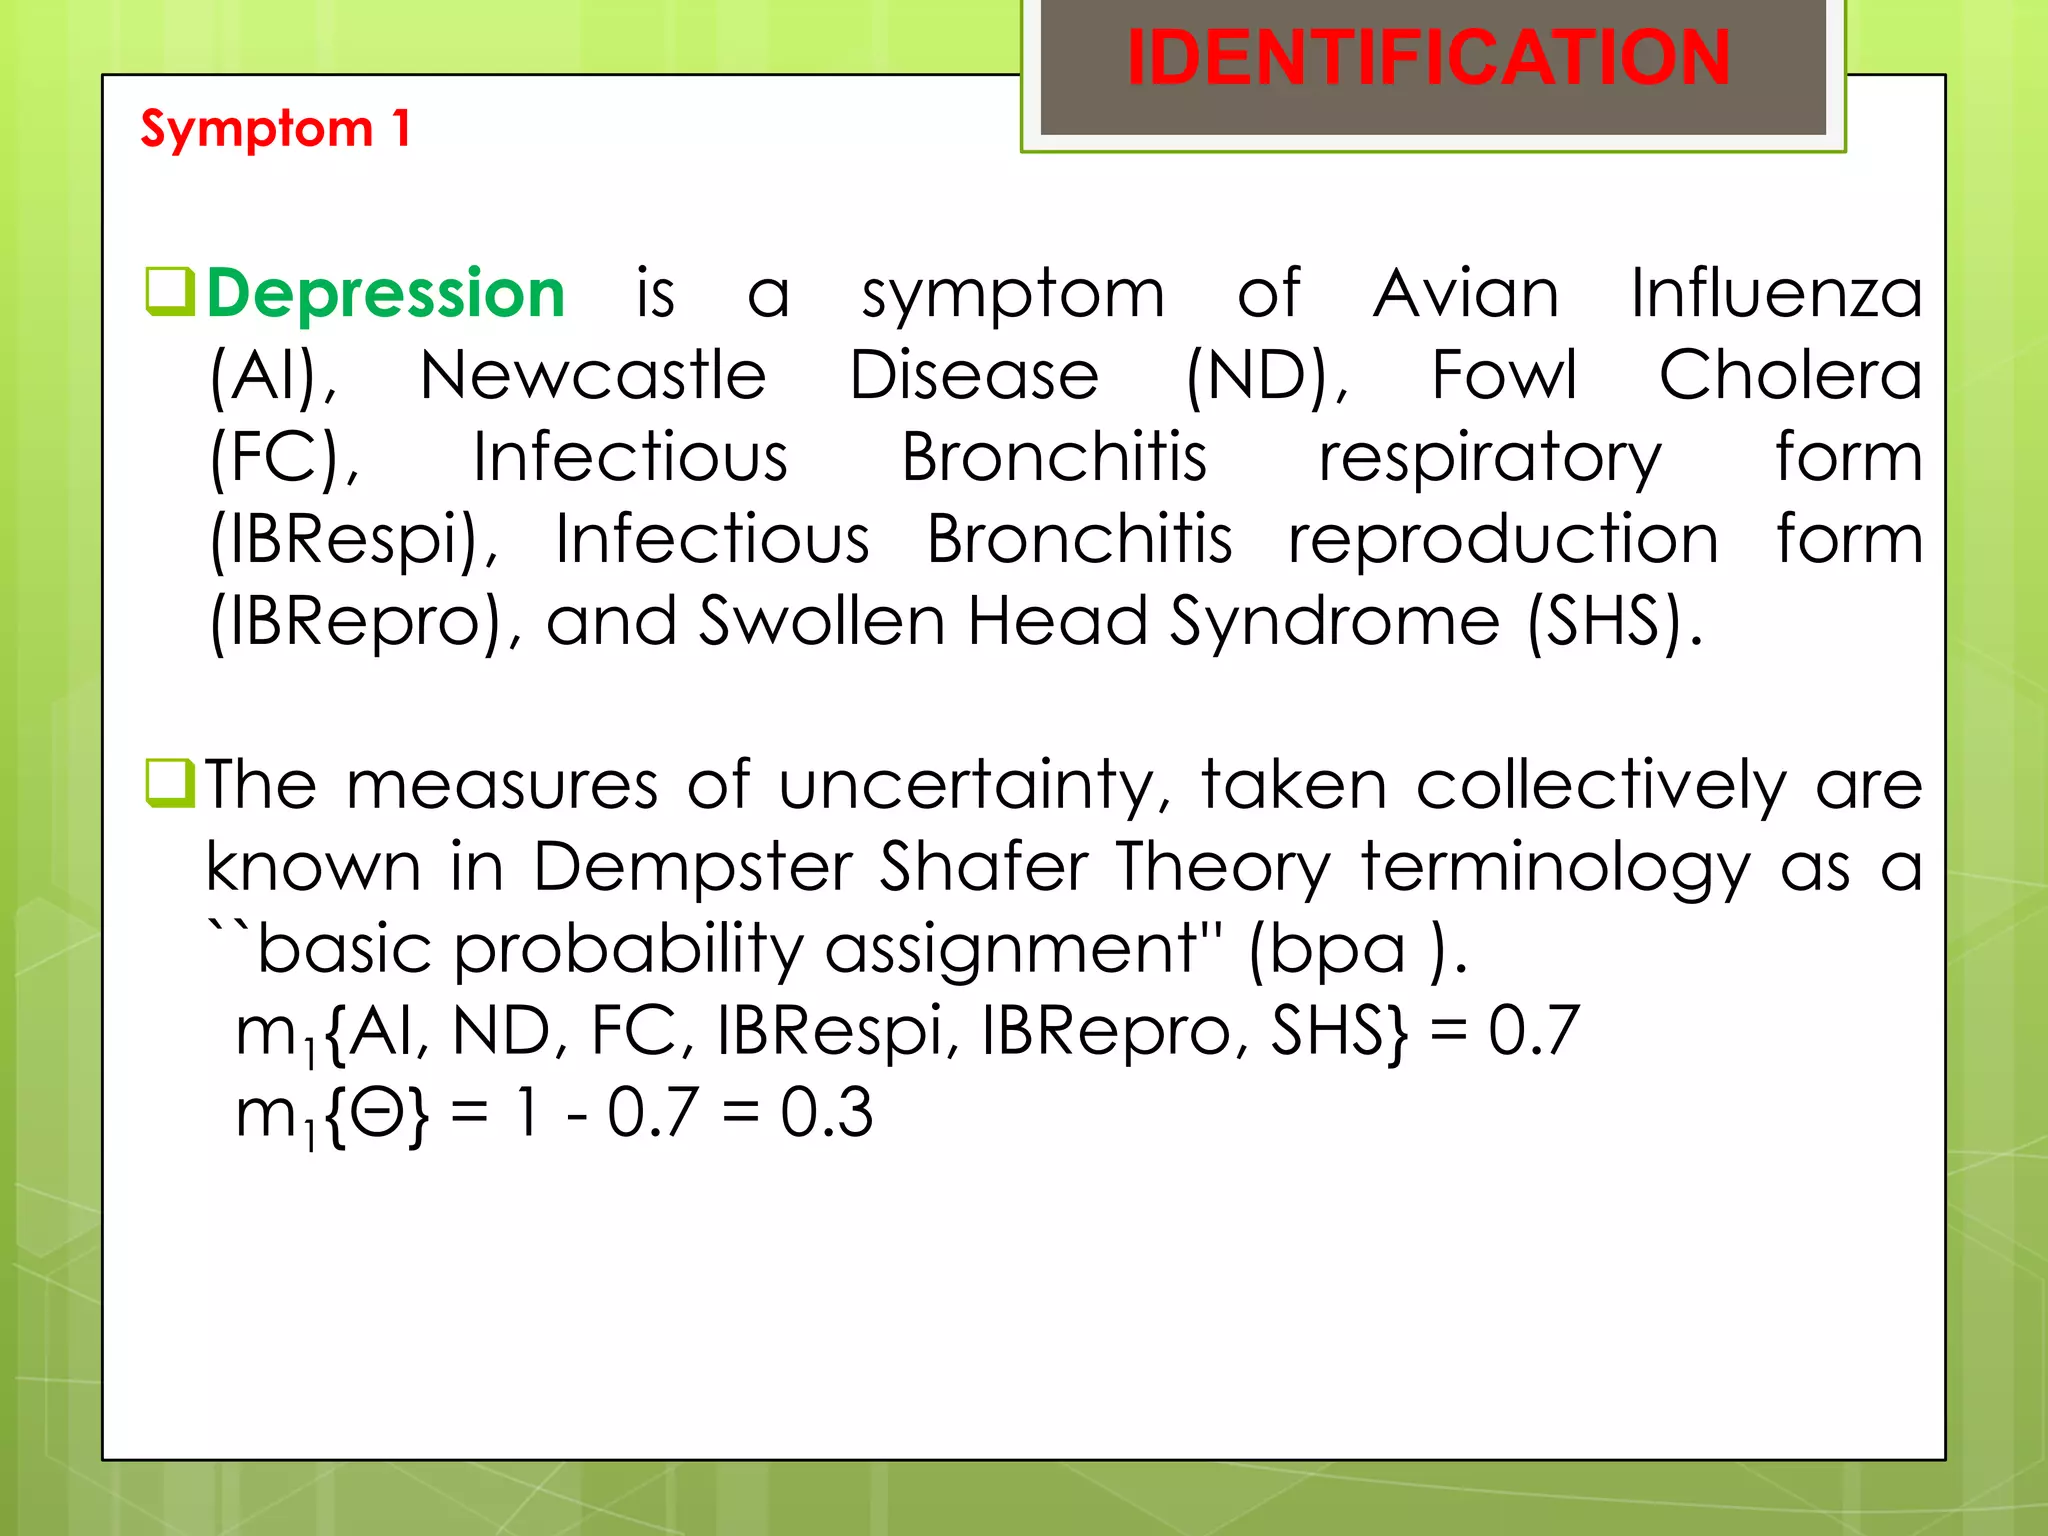
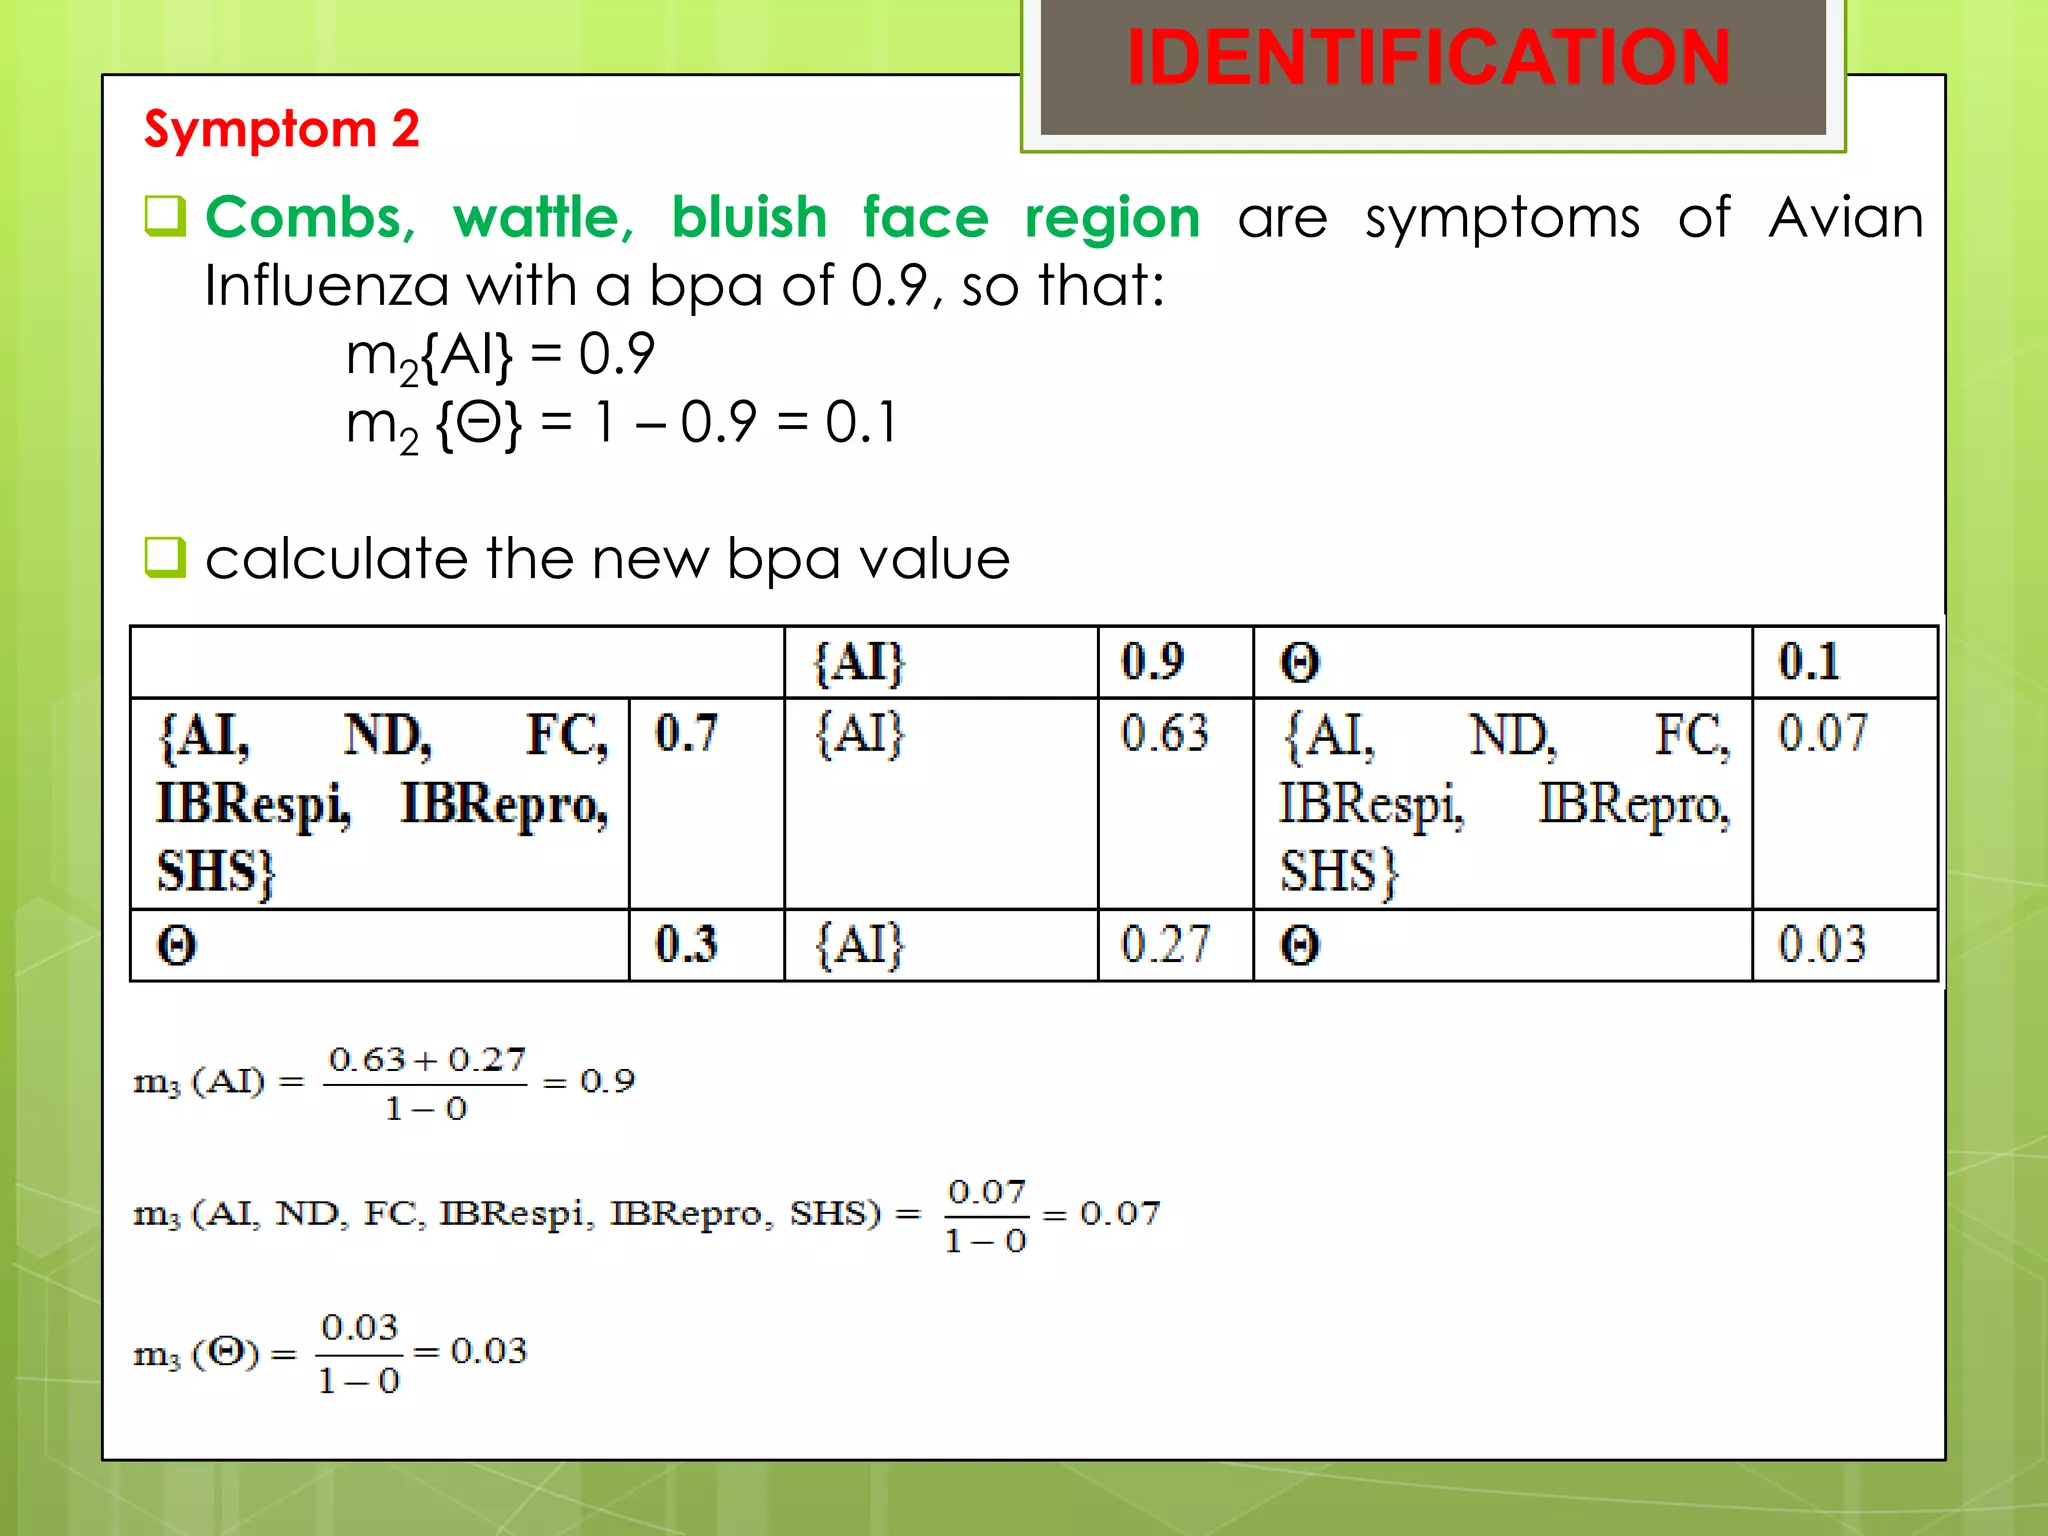
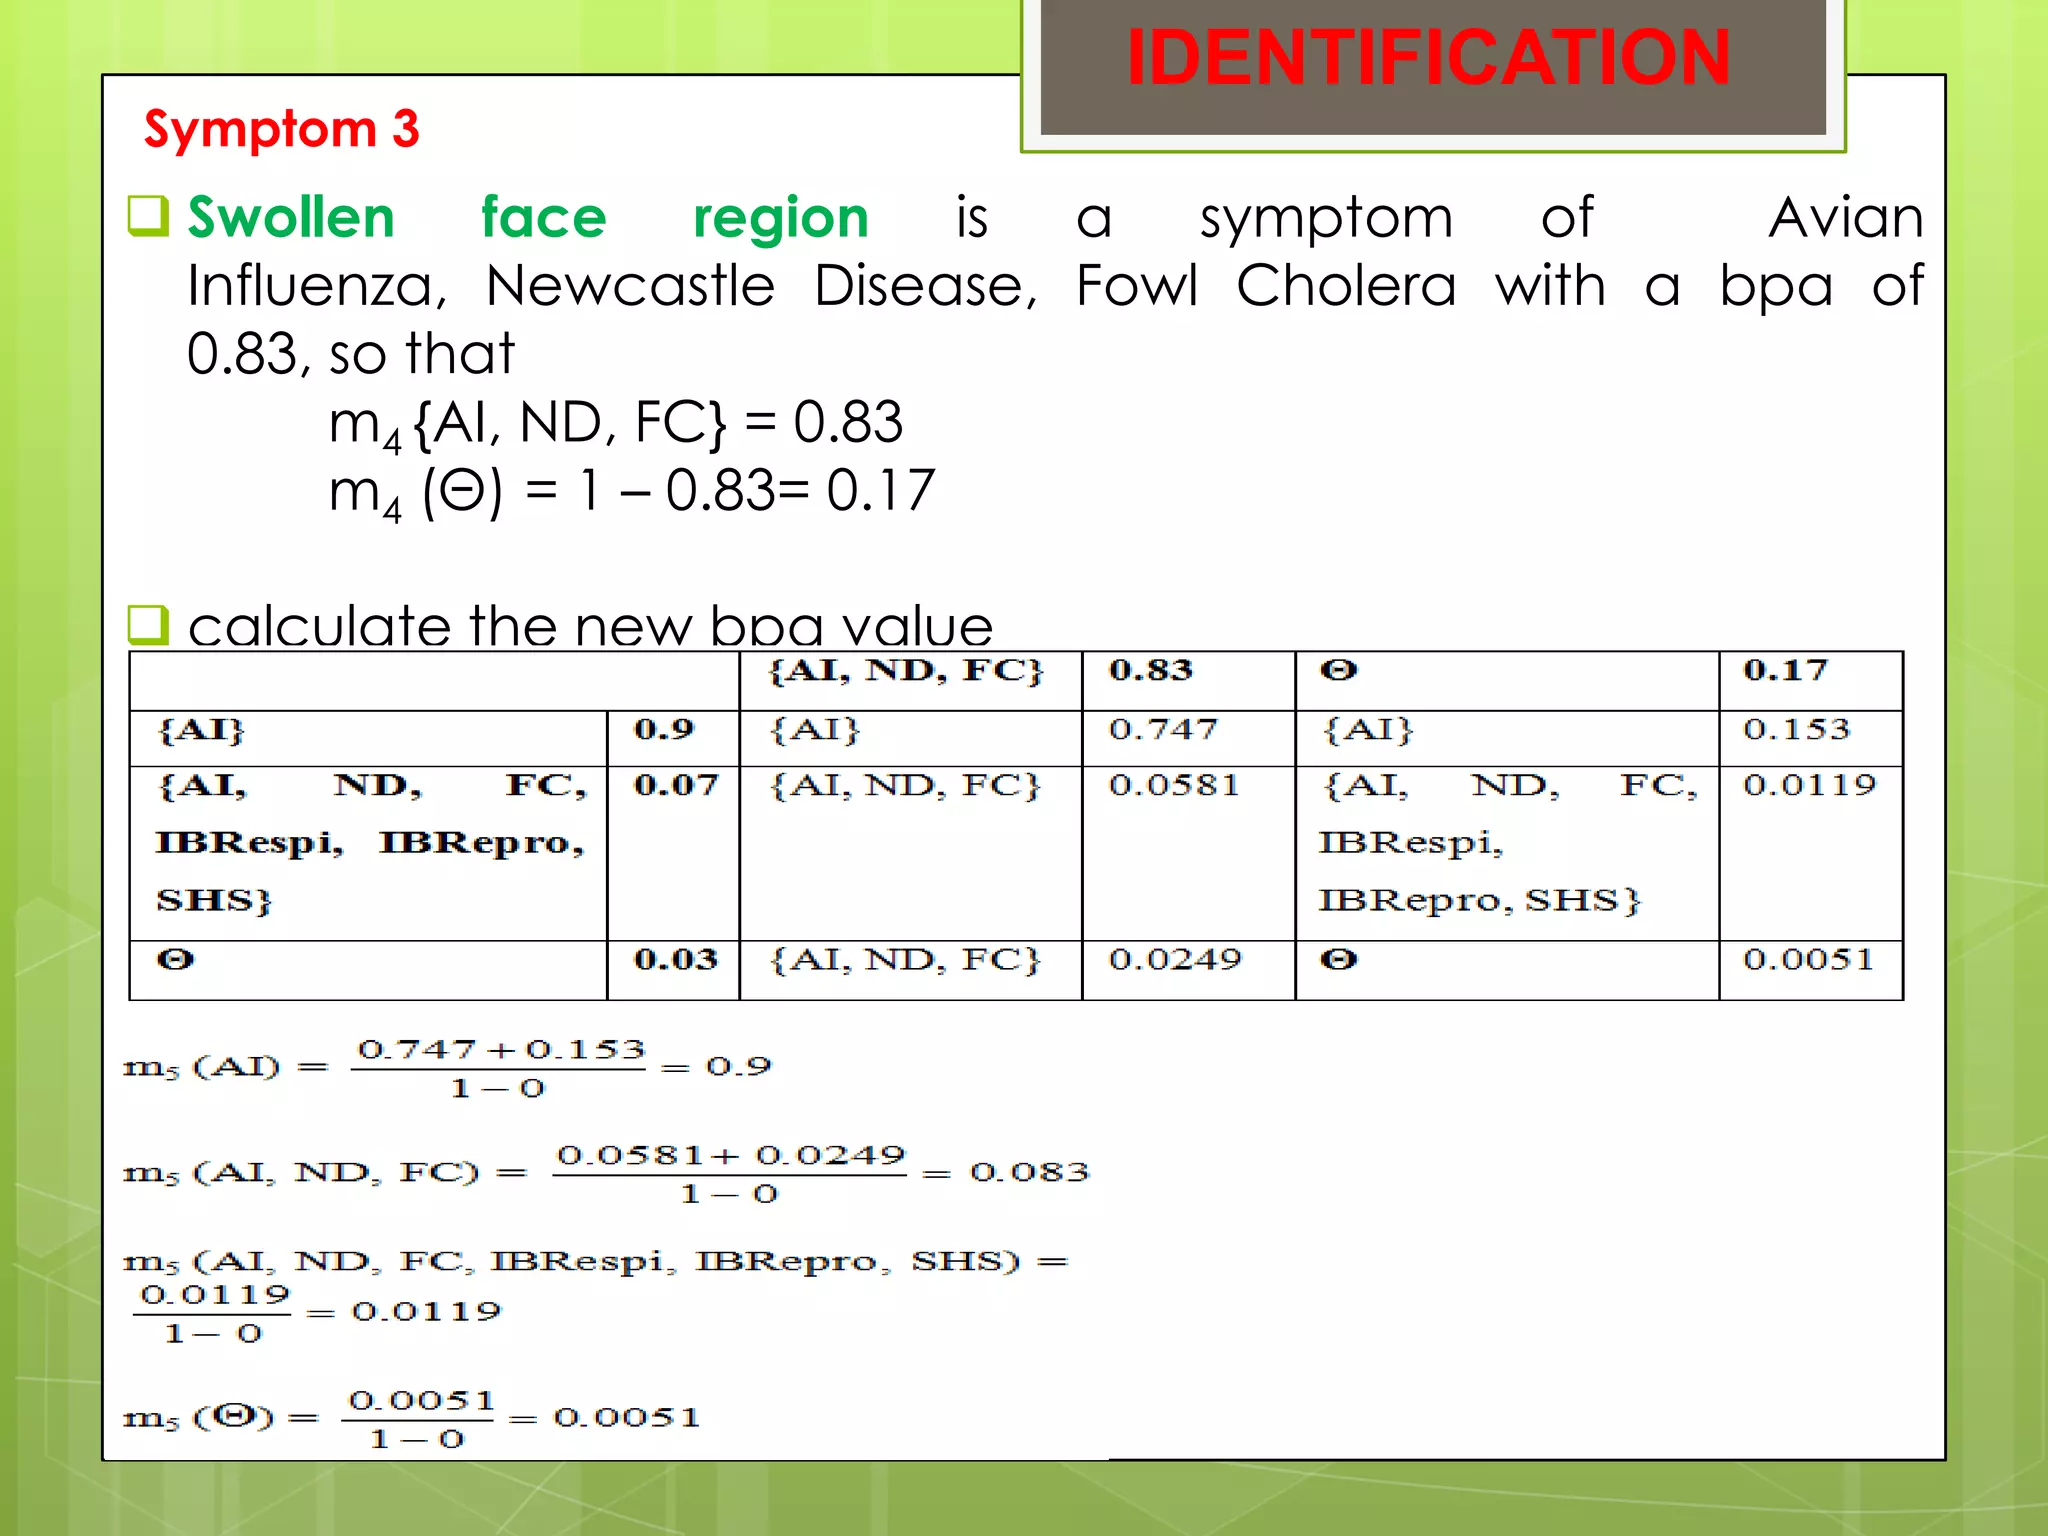
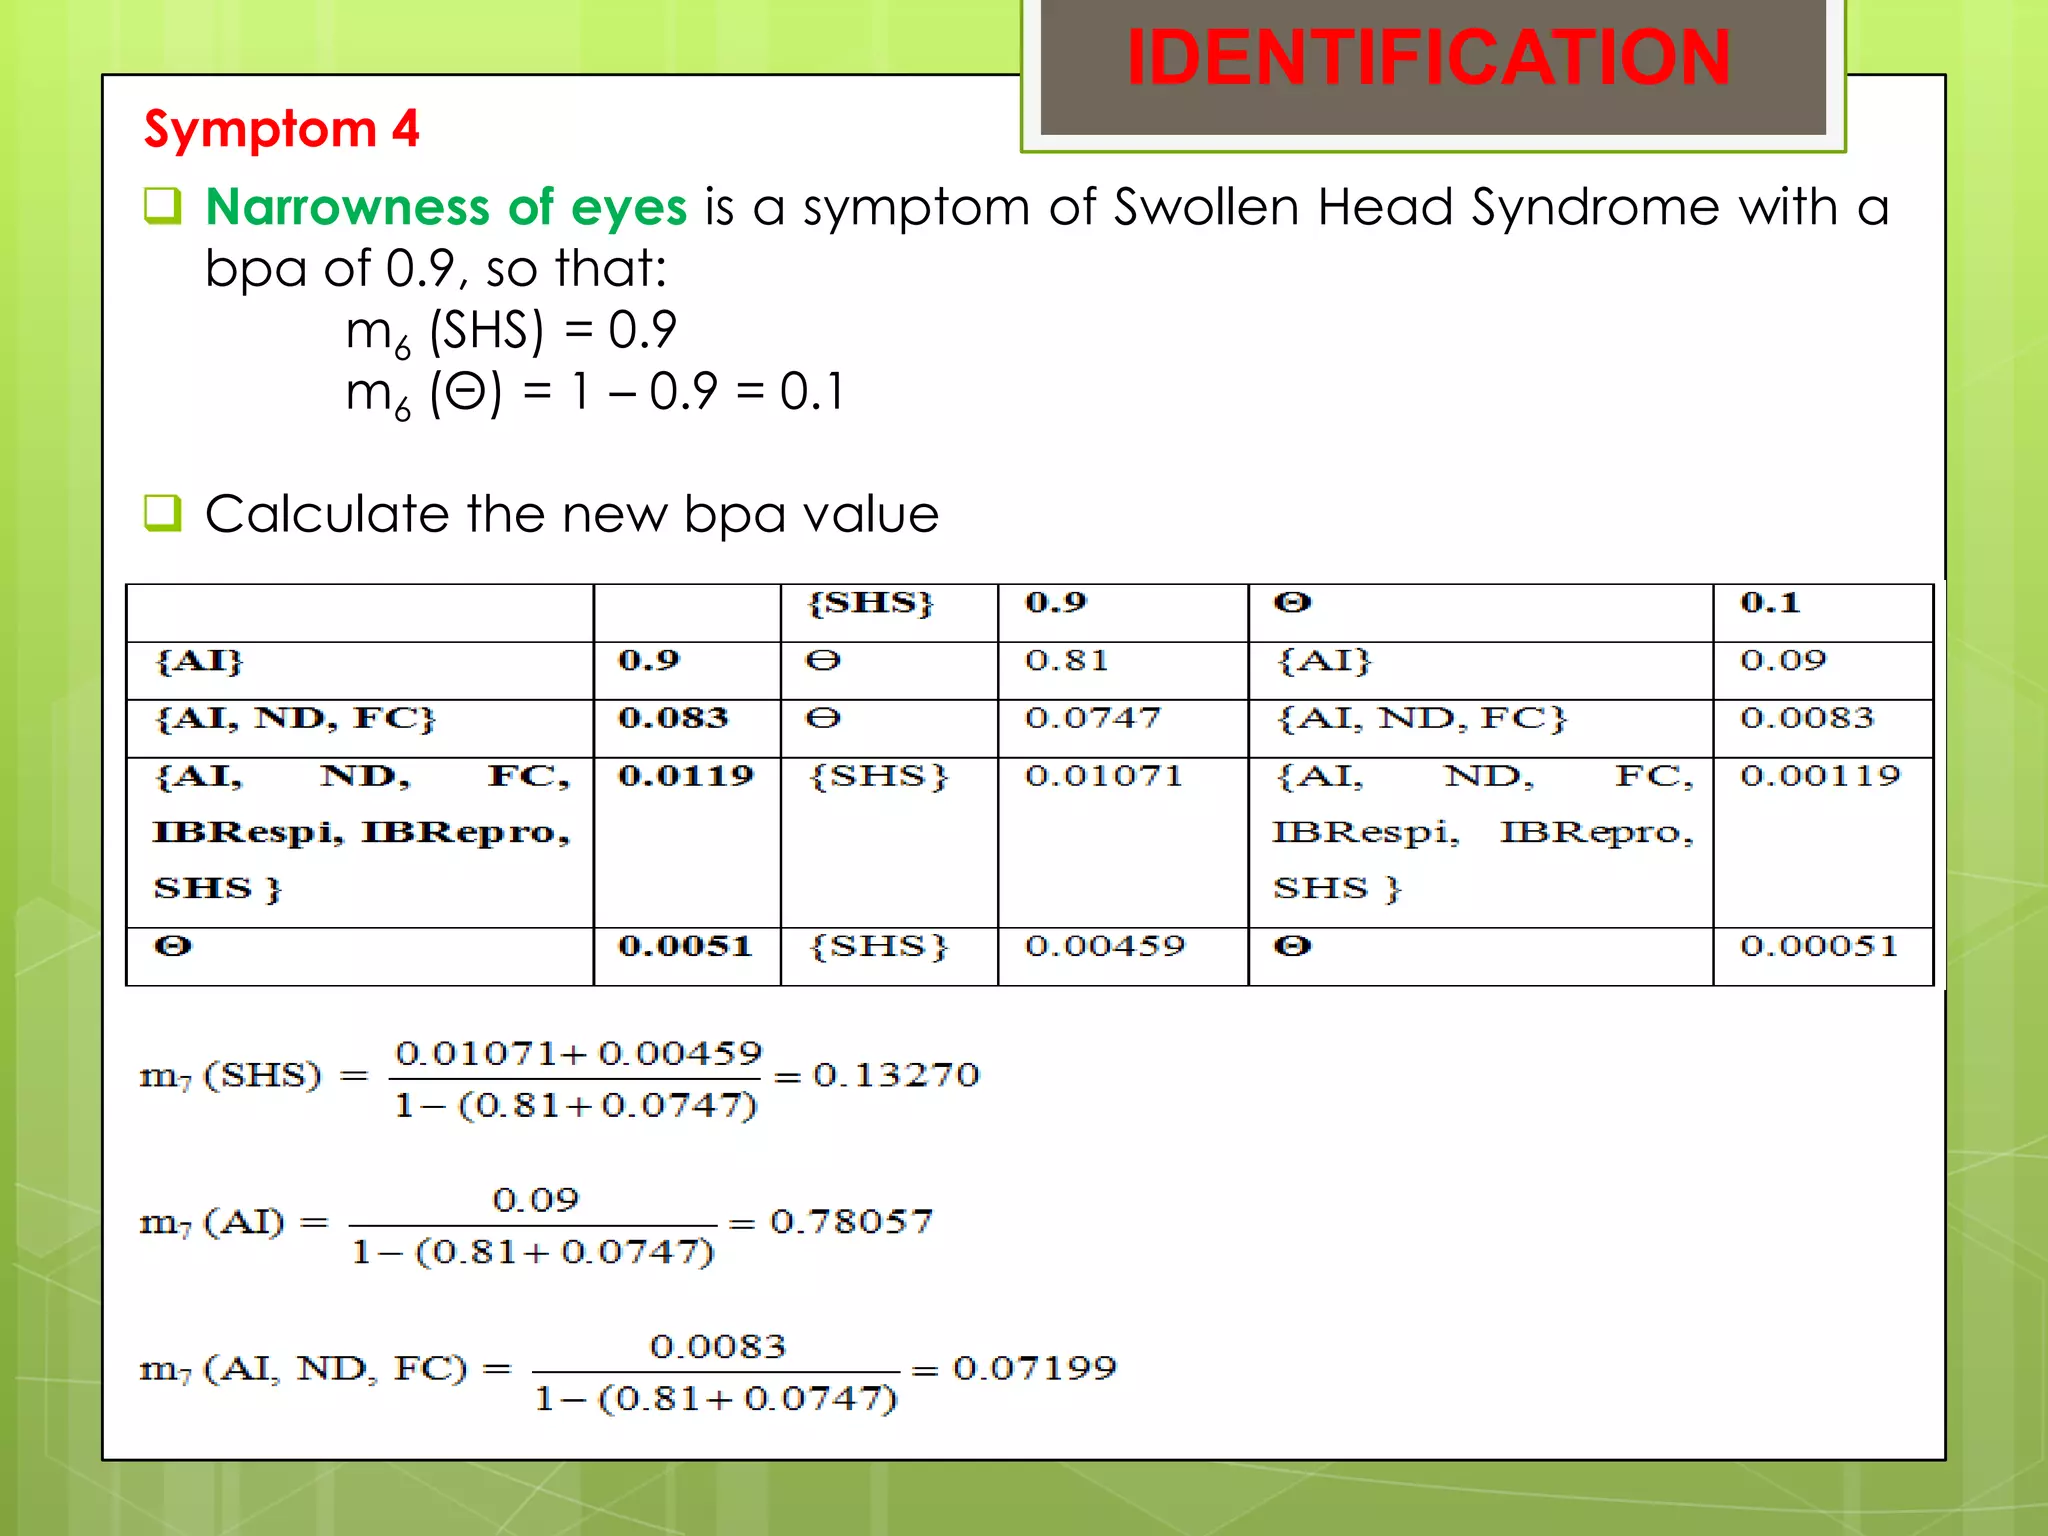
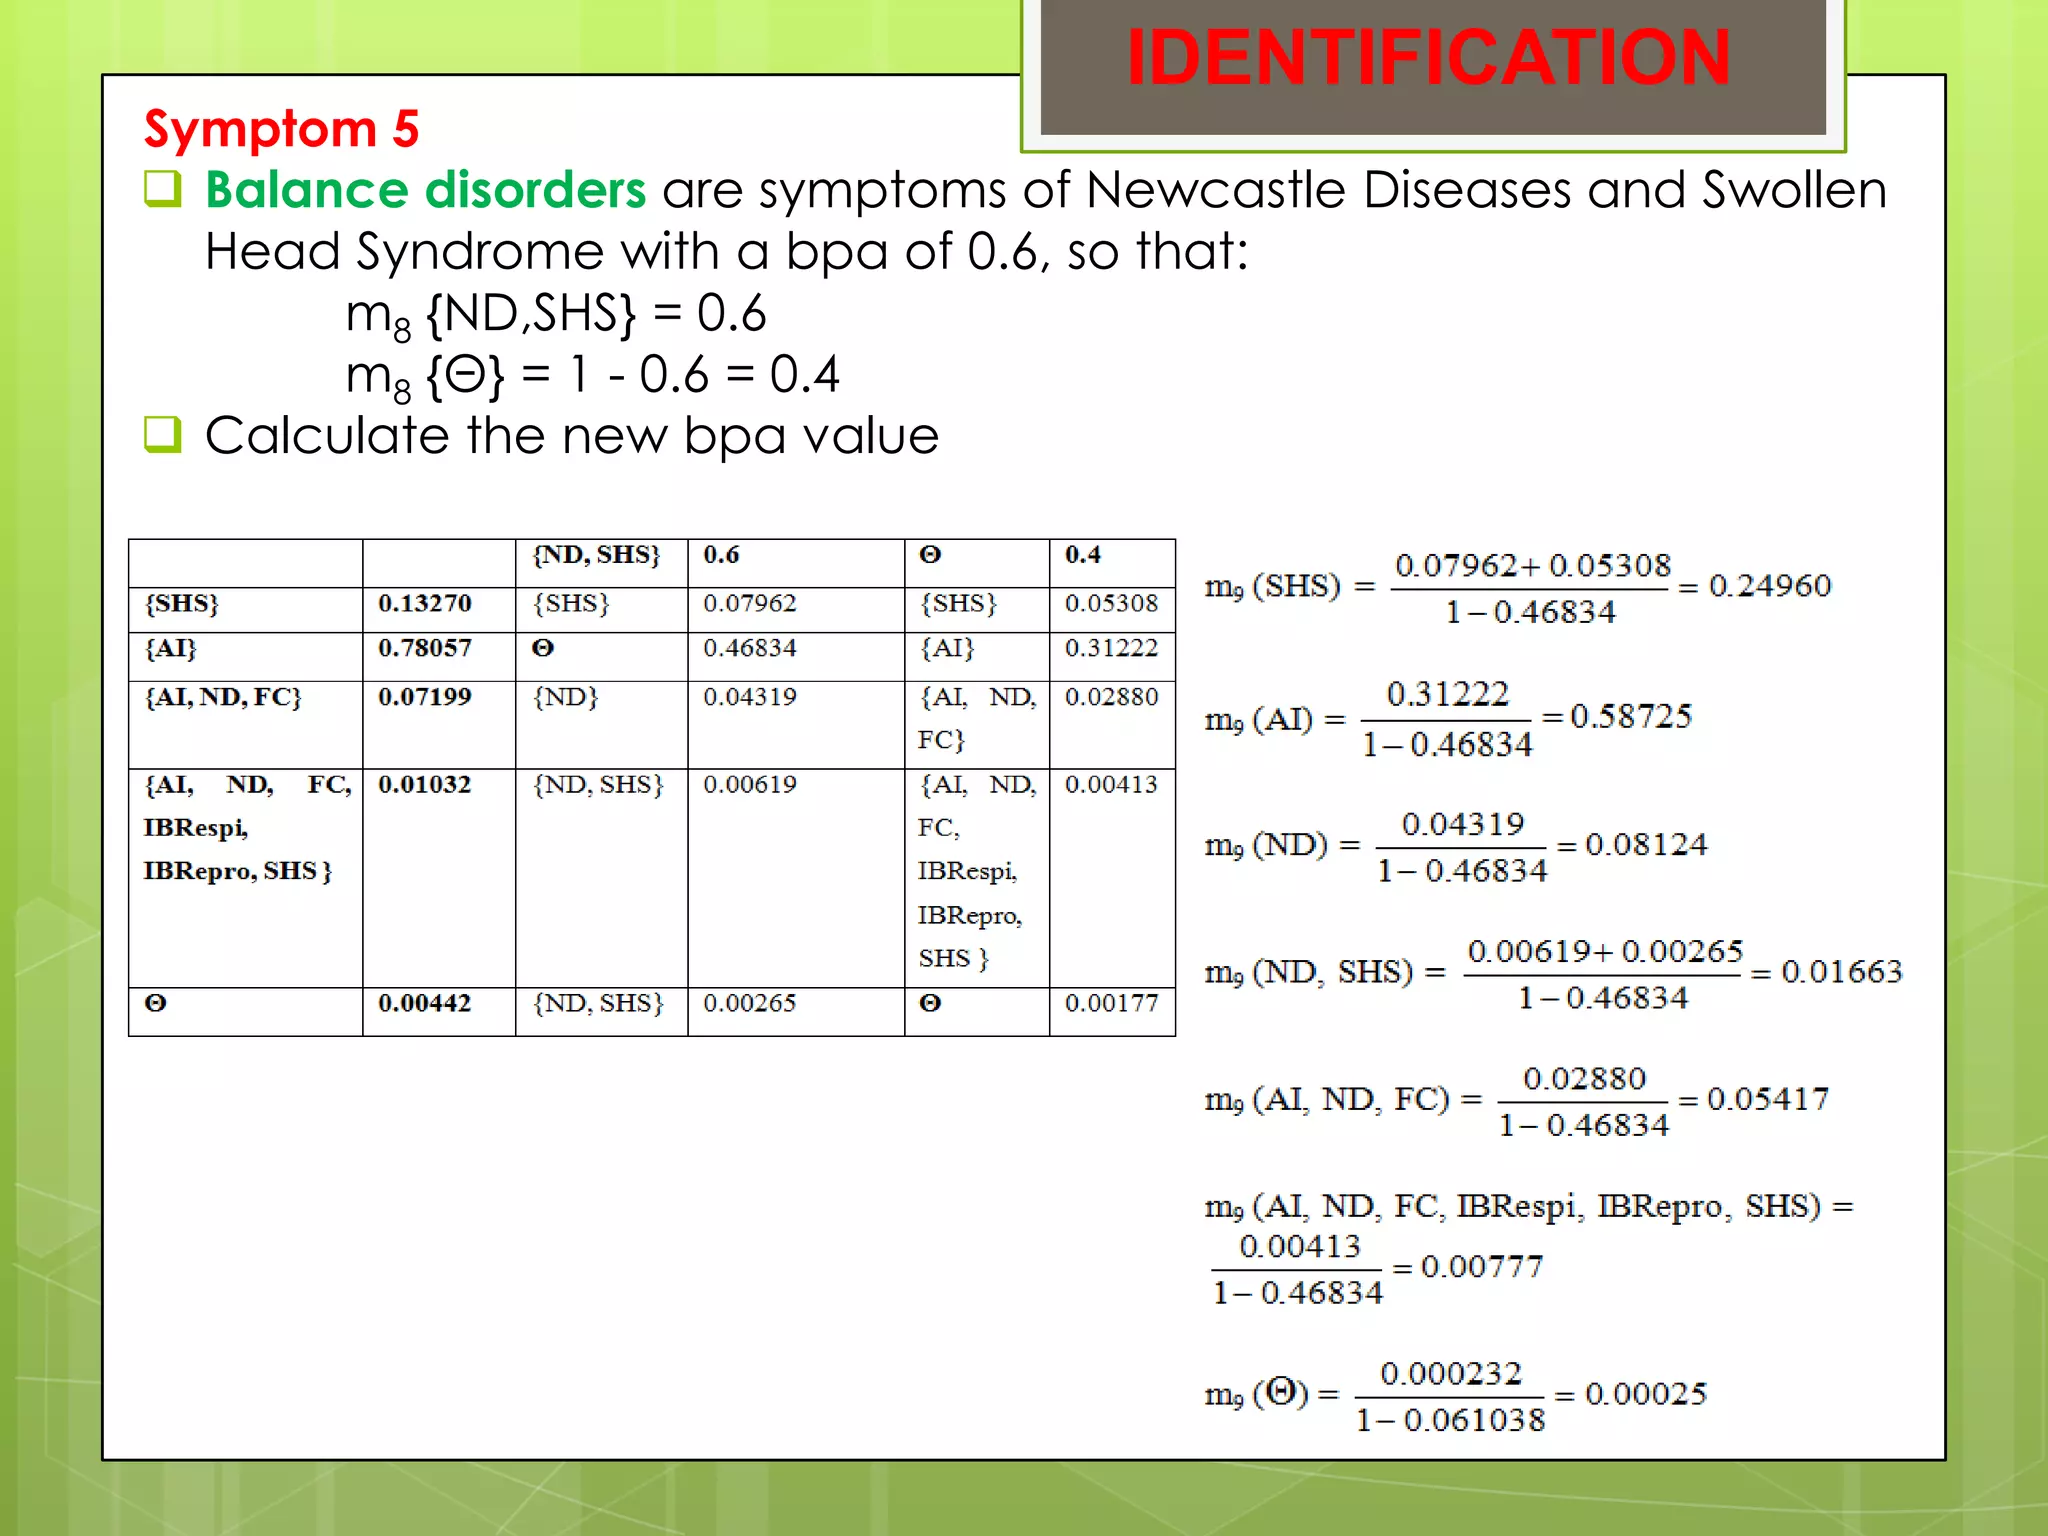
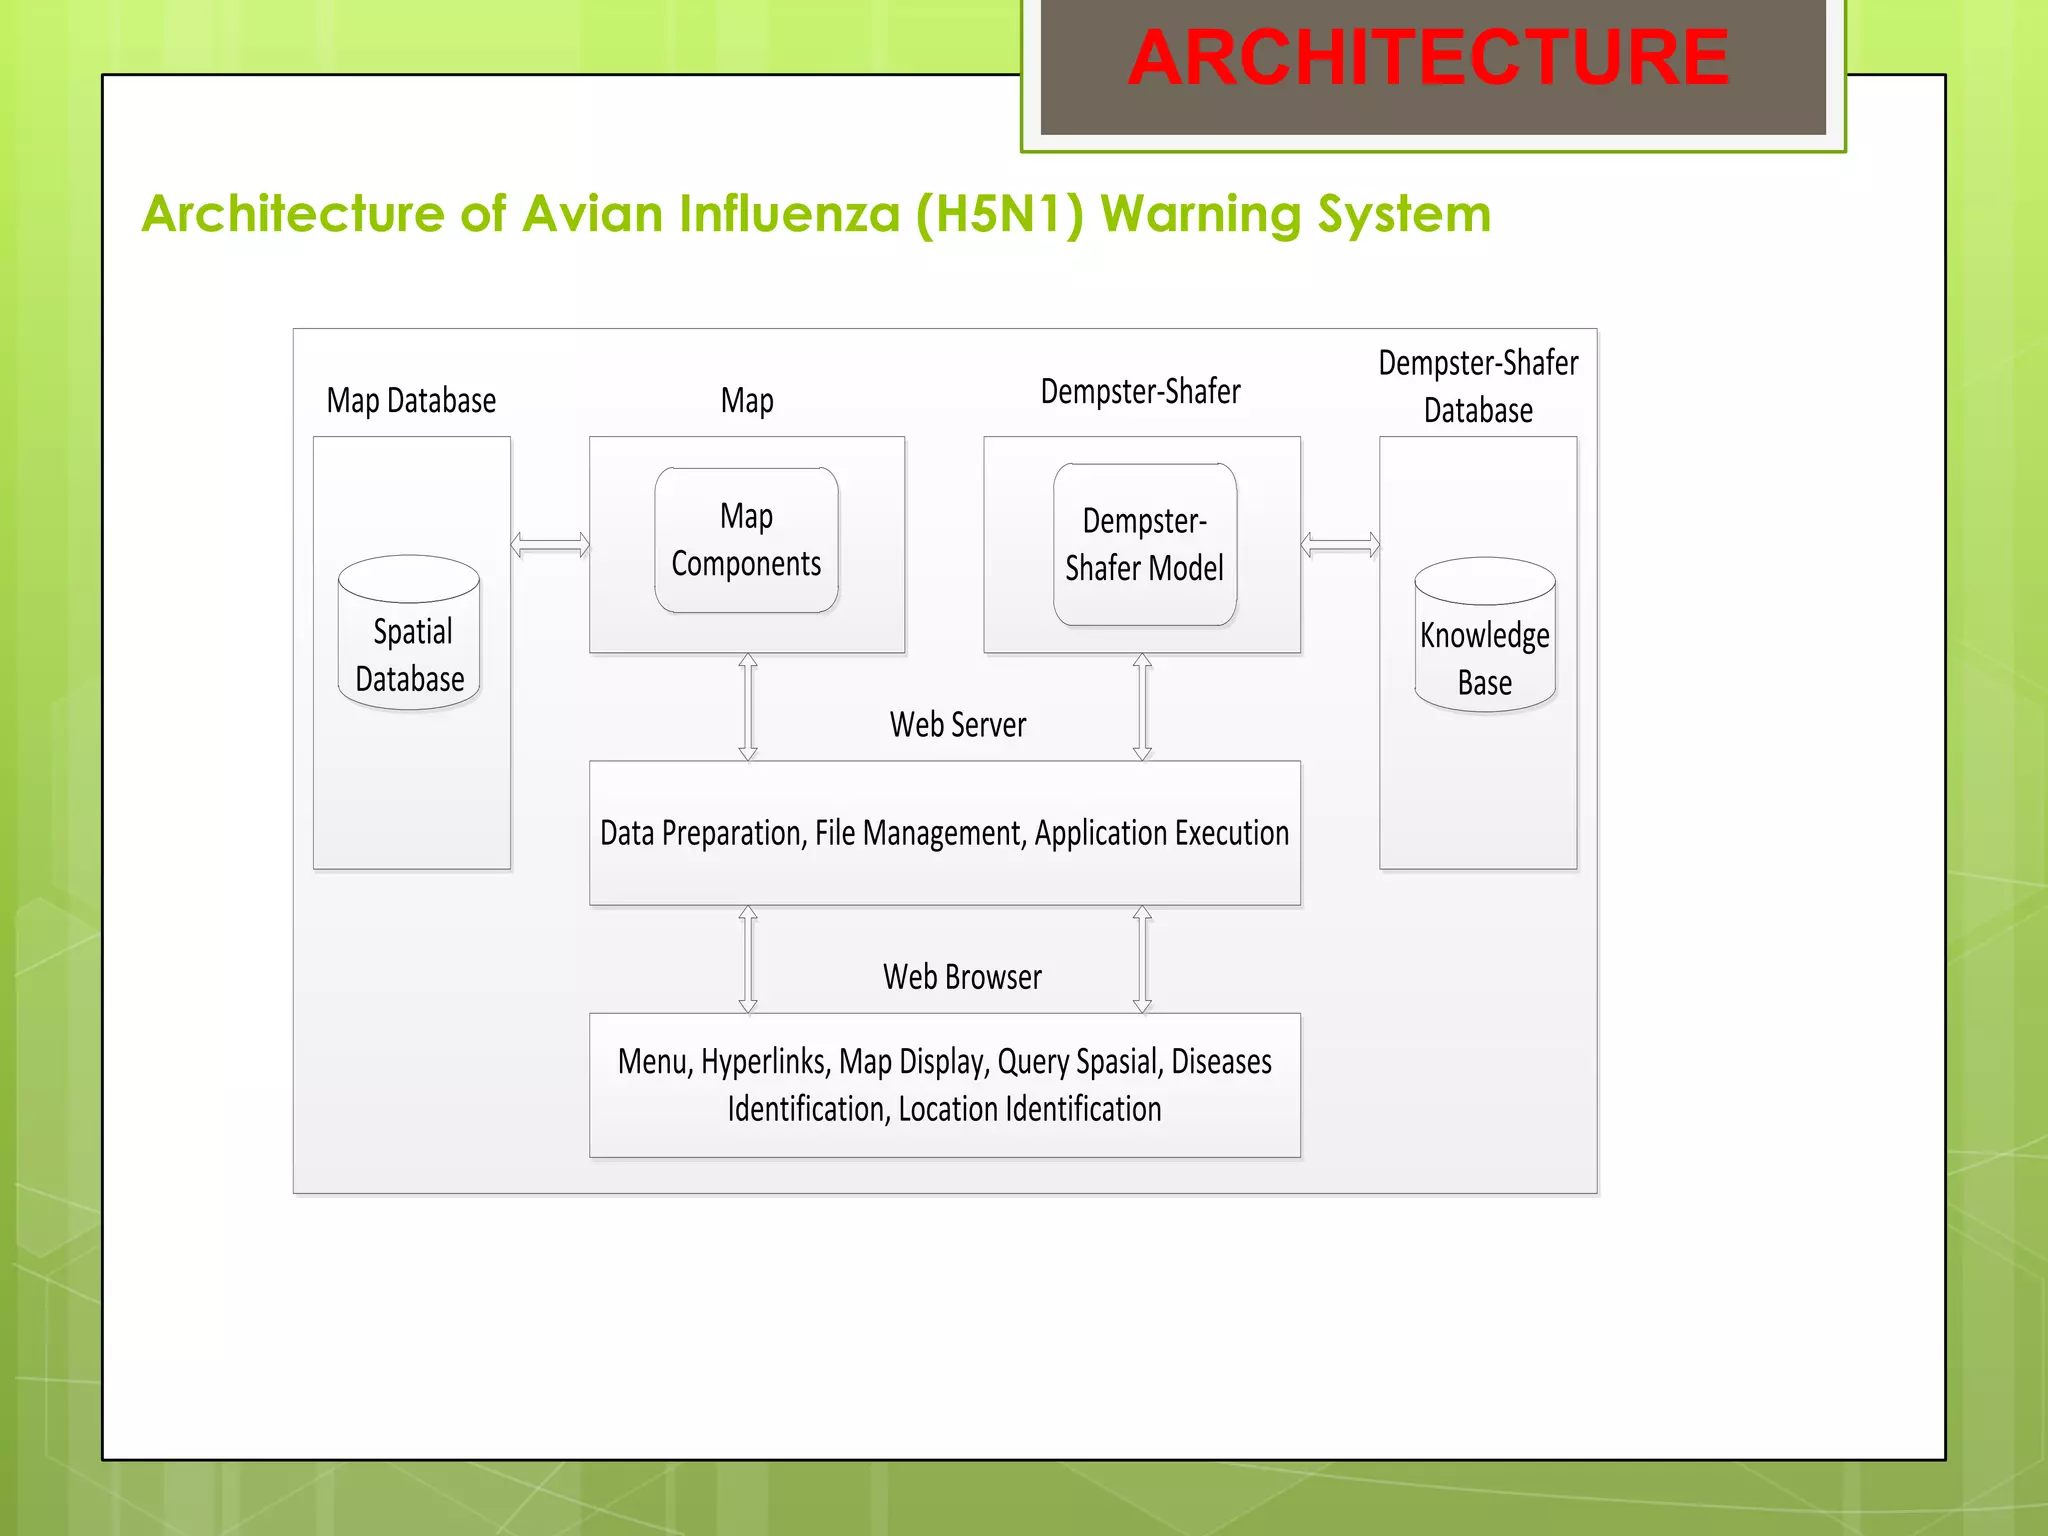
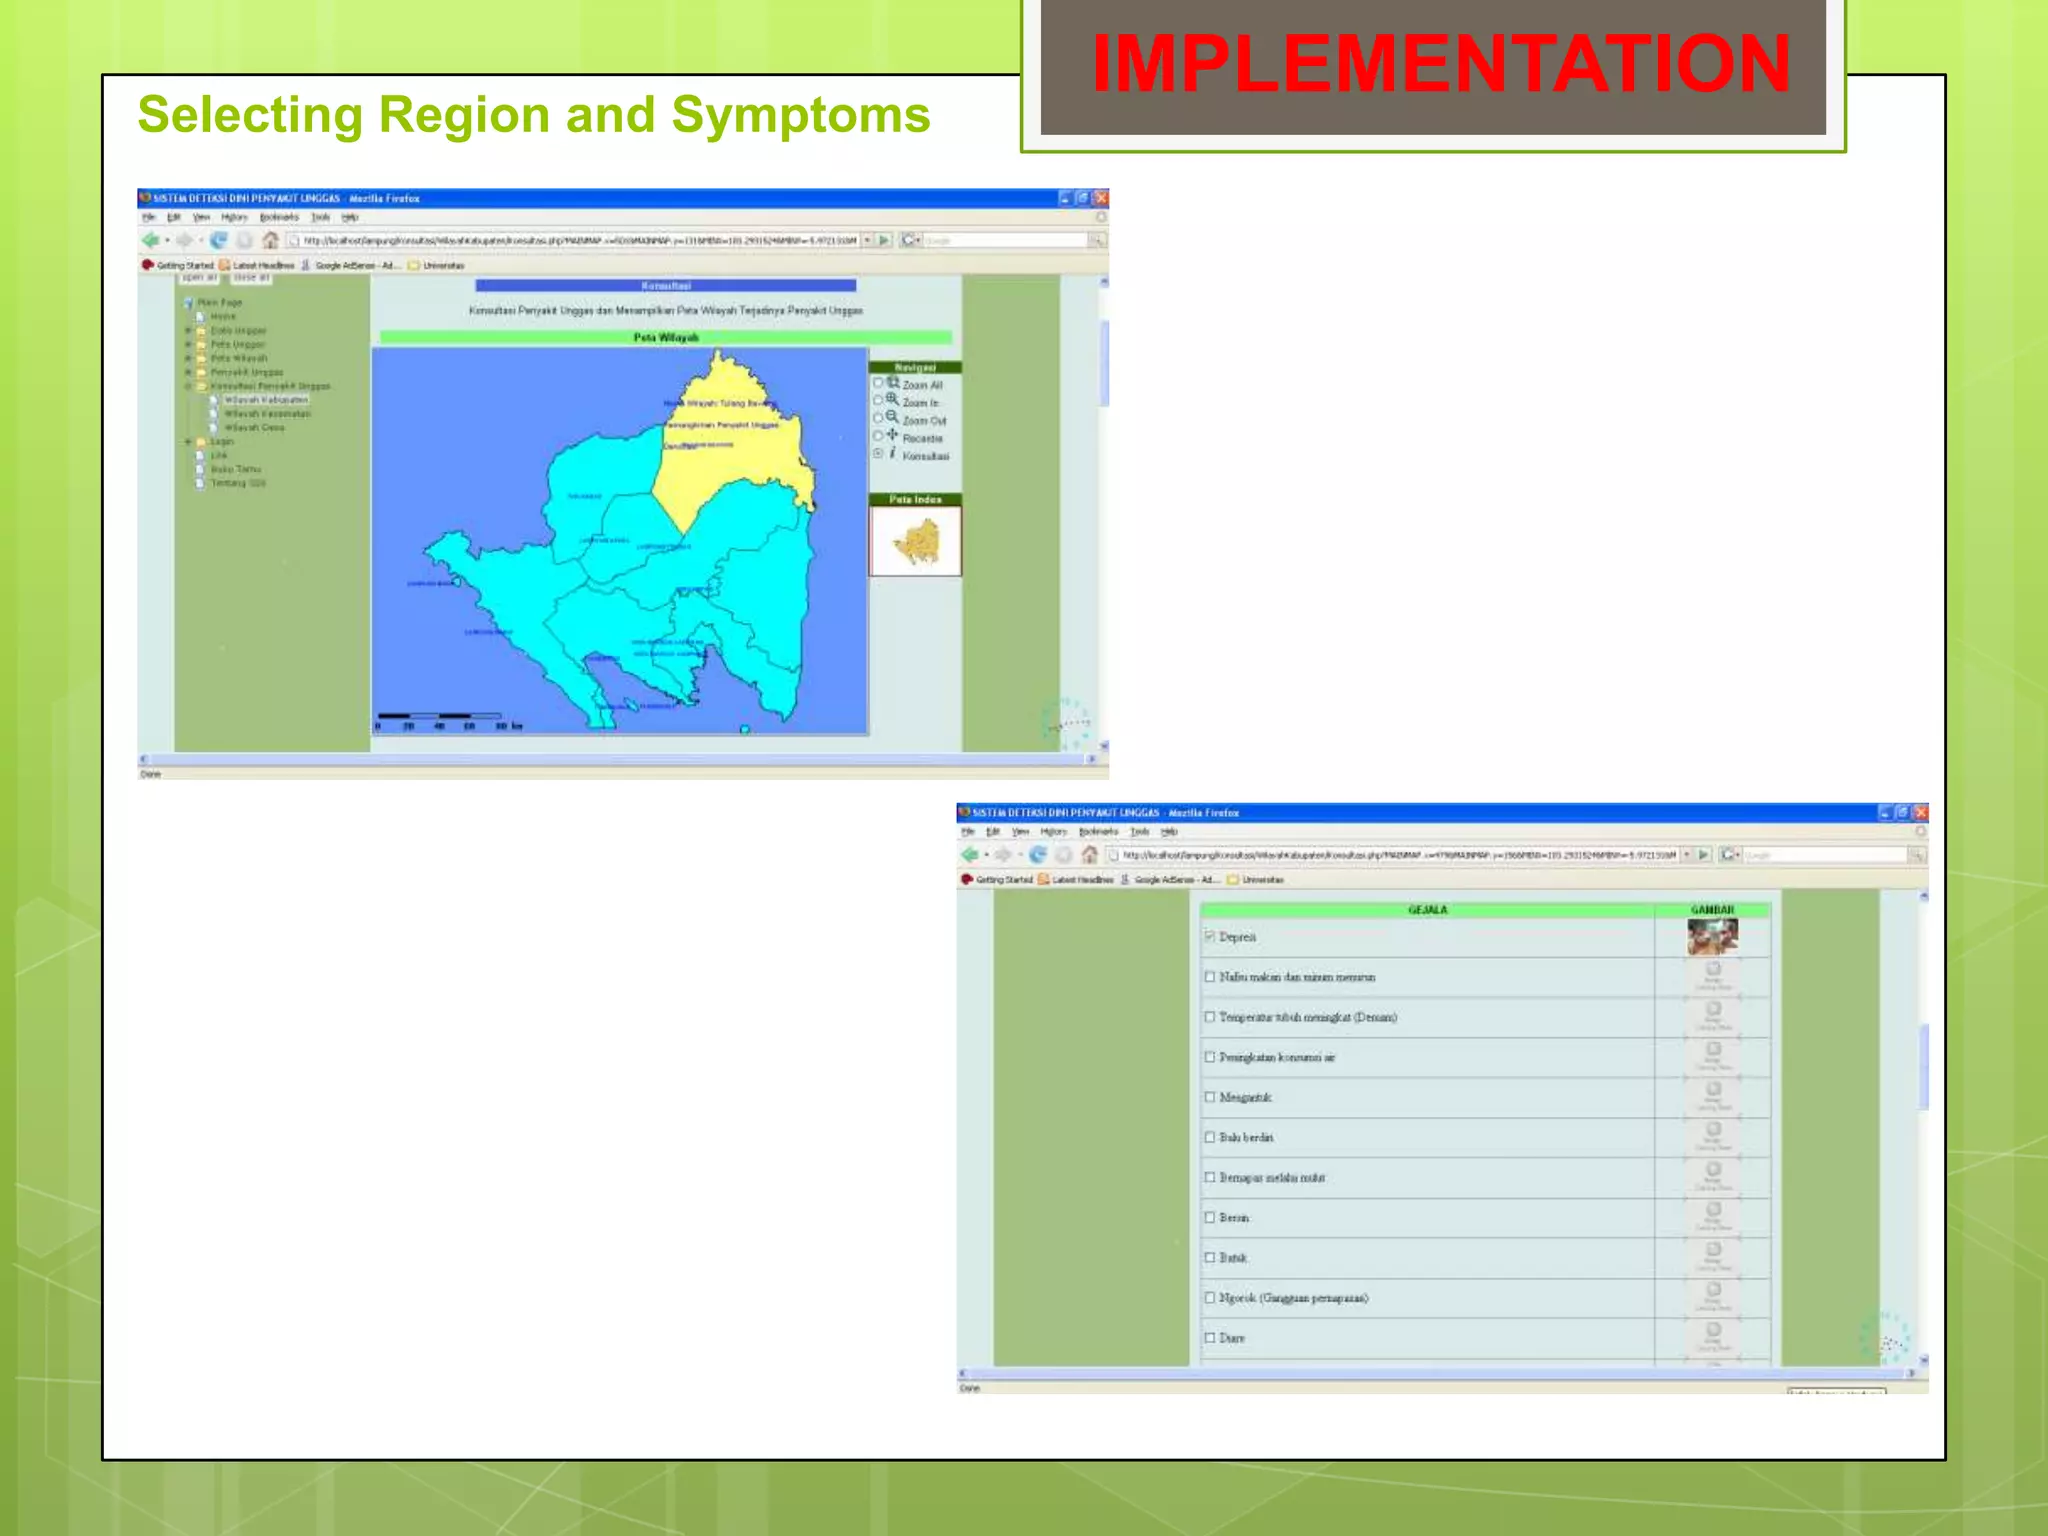
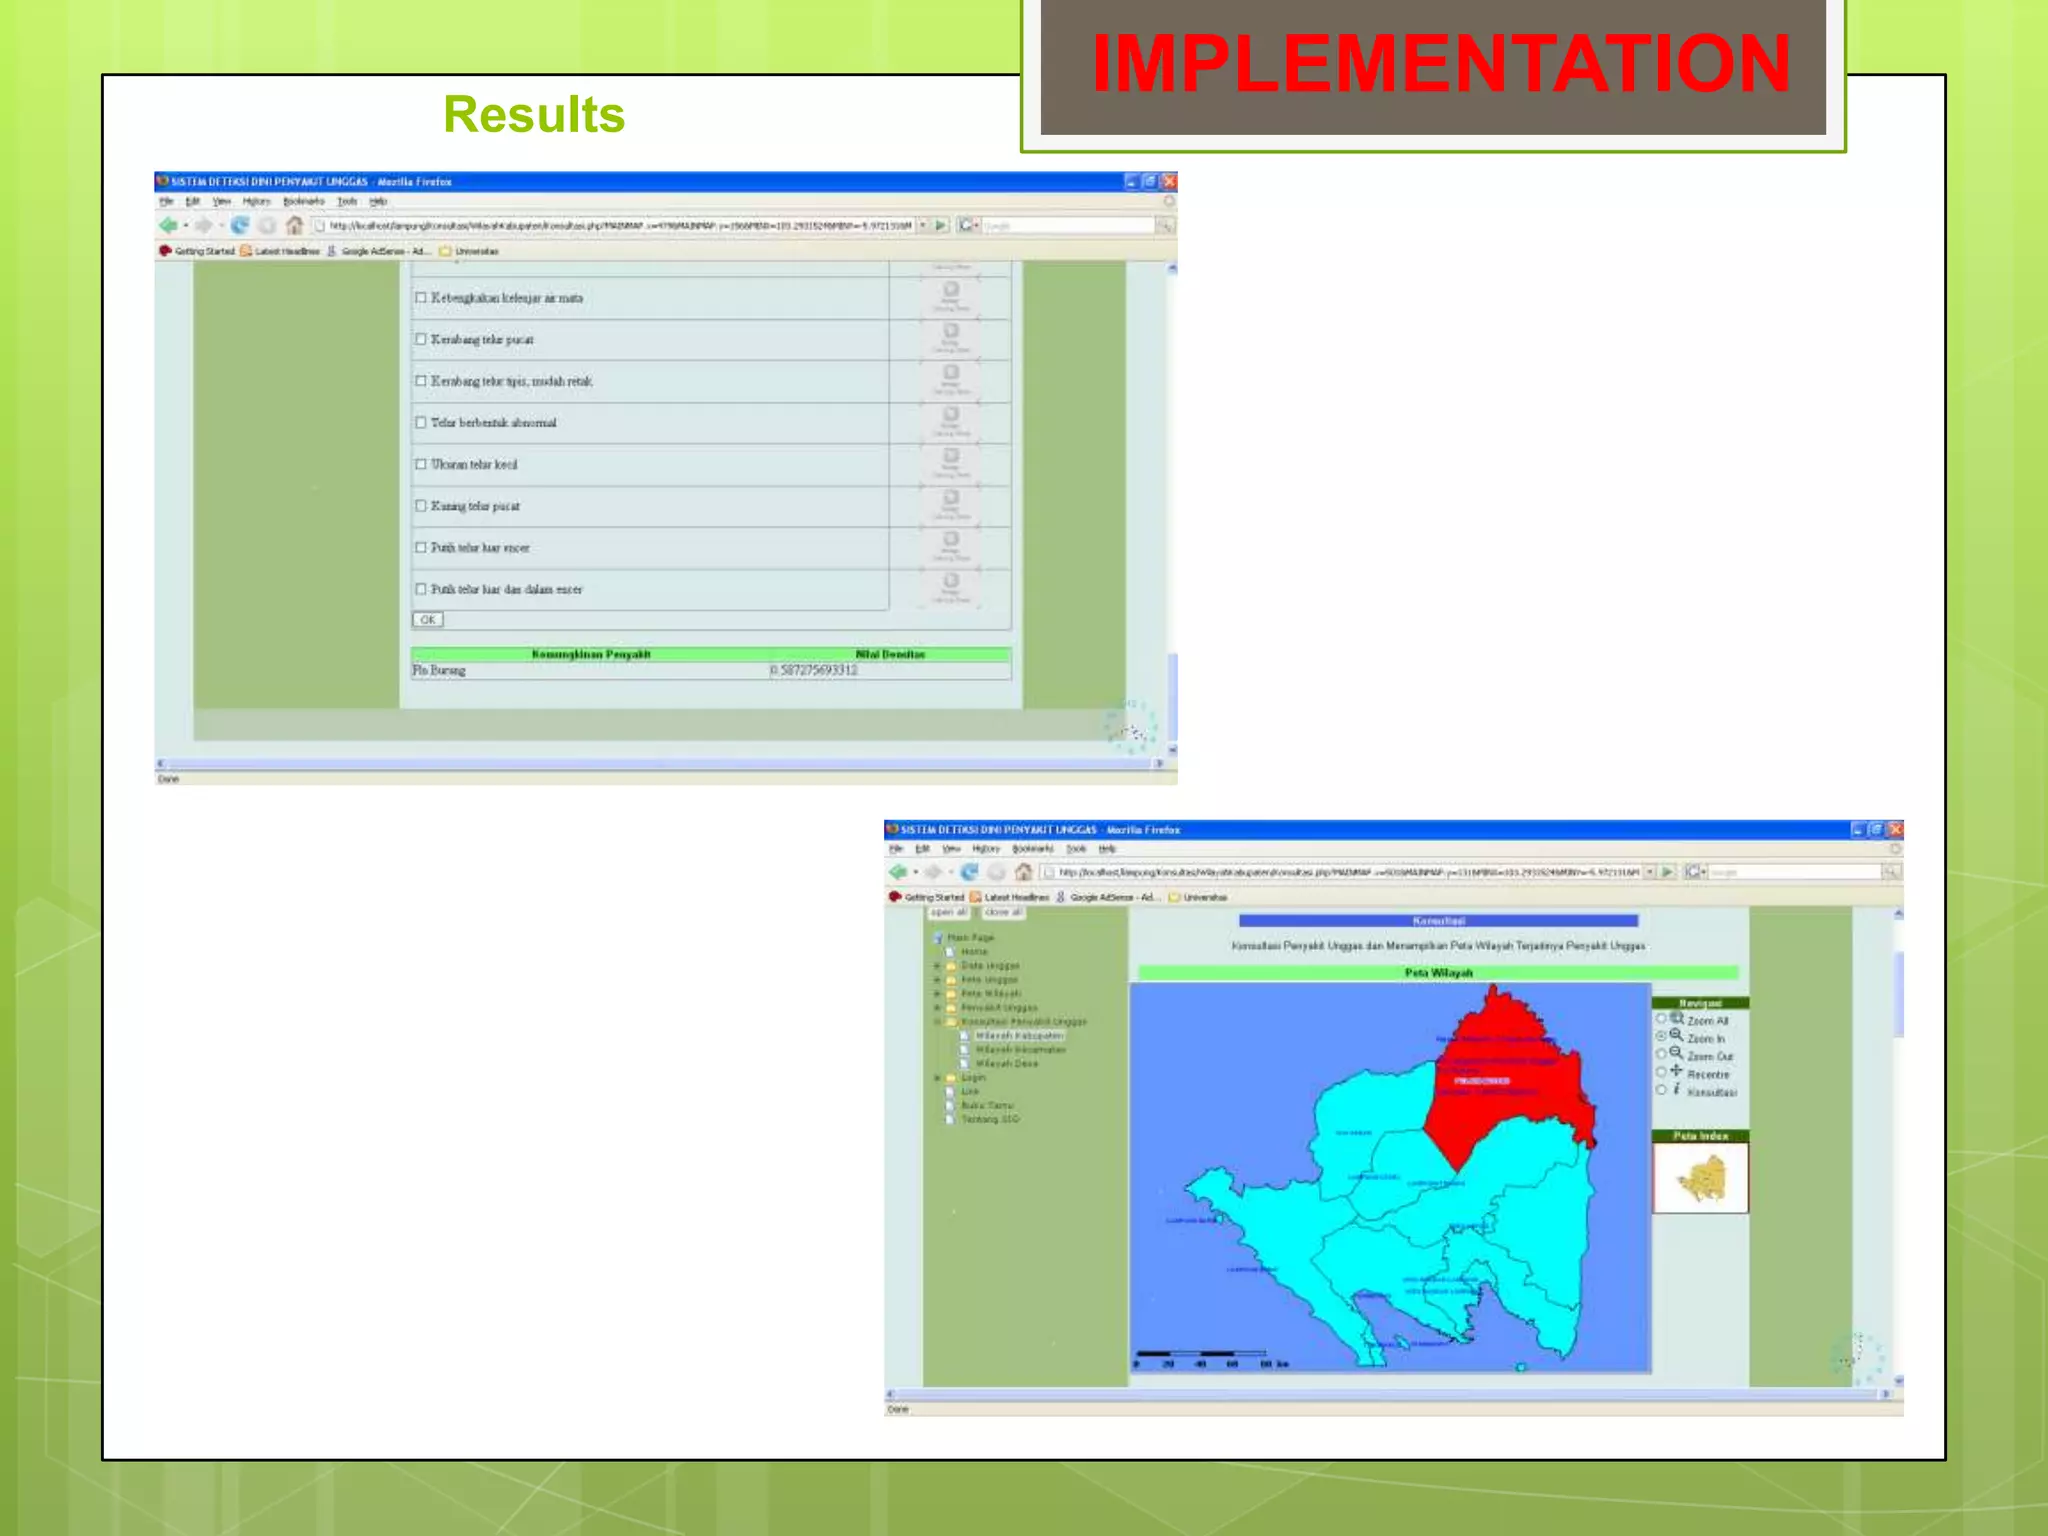
INTERNATIONAL SEMINAR
INDONESIAN STUDENTS IN ASEAN
" Green Technology, Social Work and Public
Health for Development of Indonesia"

Bangkok, Thailand
28 - 29 Oktober 2011


     Avian Influenza (H5N1) Warning System using
      Dempster-Shafer Theory and Web Mapping


                                                 Andino Maseleno
                                             andinomaseleno@yahoo.com
DEPARTMENT OF COMPUTER SCIENCE
      FACULTY OF SCIENCE
  UNIVERSITI BRUNEI DARUSSALAM
AGENDA

   INTRODUCTION

   FLOWCHART

   DEMPSTER-SHAFER

   WEB MAPPING

   IDENTIFICATION

   ARCHITECTURE

   CONCLUSION
INTRODUCTION

   World Health Organization (WHO): In the 2011 from 15
    countries, Indonesia has the largest number death
    because Avian Influenza which 146 deaths.

   Early warning is the provision of timely and effective
    information, through identified institutions, that allows
    individuals exposed to a hazard to take action to avoid or
    reduce their risk and prepare for effective response.

   Dempster-Shafer theory to combine beliefs in certain
    hypotheses under conditions of uncertainty and
    ignorance, and allows quantitative measurement of the
    belief and plausibility in our identification result.

   Web Mapping for displaying maps on a screen to visualize
    the result of identification process.
FLOWCHART
Flowchart of Avian Influenza (H5N1) Warning System

                      Start


                   Location


                                      Yes       Input
                    Symptoms                m1 (B) m2 (C)


                          No


                    m (A) = 1


               Location and Disease


                       End
DEMPSTER-SHAFER


The advantages of the Dempster-Shafer theory:
 It has the ability to model information in a flexible way
  without requiring a probability to be assigned to each
  element in a set.
 It  provides a convenient and simple mechanism
  (Dempster’s combination rule) for combining two or more
  pieces of evidence under certain conditions.
 It can model ignorance explicitly.
WEB MAPPING

Web      mapping      is    the     process      of
designing, implementing, generating and delivering
maps on the World Wide Web.

The web mapping server is the engine behind the
maps. The mapping server or web mapping program
needs to be configured to communicate between
the web server and assemble data layers into an
appropriate image.
IDENTIFICATION

Avian Influenza (H5N1) Symptoms:
1. Depression
2. Combs, wattle, bluish face region
3. Swollen face region
4. Narrowness of eyes
5. Balance disorders
IDENTIFICATION
Symptom 1


Depression is a symptom of Avian Influenza
 (AI), Newcastle Disease (ND), Fowl Cholera
 (FC),    Infectious   Bronchitis  respiratory form
 (IBRespi), Infectious Bronchitis reproduction form
 (IBRepro), and Swollen Head Syndrome (SHS).

The measures of uncertainty, taken collectively are
 known in Dempster Shafer Theory terminology as a
 ``basic probability assignment'' (bpa ).
  m1{AI, ND, FC, IBRespi, IBRepro, SHS} = 0.7
  m1{Θ} = 1 - 0.7 = 0.3
IDENTIFICATION
Symptom 2
 Combs, wattle, bluish face region are symptoms of Avian
  Influenza with a bpa of 0.9, so that:
        m2{AI} = 0.9
        m2 {Θ} = 1 – 0.9 = 0.1

 calculate the new bpa value
IDENTIFICATION
Symptom 3
 Swollen     face    region    is a symptom  of     Avian
  Influenza, Newcastle Disease, Fowl Cholera with a bpa of
  0.83, so that
        m4 {AI, ND, FC} = 0.83
        m4 (Θ) = 1 – 0.83= 0.17

 calculate the new bpa value
IDENTIFICATION
Symptom 4
 Narrowness of eyes is a symptom of Swollen Head Syndrome with a
  bpa of 0.9, so that:
       m6 (SHS) = 0.9
       m6 (Θ) = 1 – 0.9 = 0.1

 Calculate the new bpa value
IDENTIFICATION
Symptom 5
 Balance disorders are symptoms of Newcastle Diseases and Swollen
  Head Syndrome with a bpa of 0.6, so that:
       m8 {ND,SHS} = 0.6
       m8 {Θ} = 1 - 0.6 = 0.4
 Calculate the new bpa value
ARCHITECTURE
Architecture of Avian Influenza (H5N1) Warning System

                                                                                 Dempster-Shafer
       Map Database            Map                        Dempster-Shafer           Database

                              Map                           Dempster-
                           Components                      Shafer Model
          Spatial                                                                   Knowledge
         Database                                                                     Base
                                             Web Server

                      Data Preparation, File Management, Application Execution


                                            Web Browser

                       Menu, Hyperlinks, Map Display, Query Spasial, Diseases
                               Identification, Location Identification
IMPLEMENTATION
Selecting Region and Symptoms
IMPLEMENTATION
Results
CONCLUSION
   Identification of avian influenza can be performed using
    Dempster Shafer Theory and Web Mapping.

   Application is built to display the map of the region by
    the villages, districts, and regencies or municipalities.

   Web Mapping and Dempster-Shafer theory can be built
    as an early warning system of avian influenza.

   Dempster-Shafer theory to combine beliefs in certain
    hypotheses under conditions of uncertainty and
    ignorance, and allows quantitative measurement of the
    belief and plausibility in identification result.

   Web Mapping is also used for displaying maps on a
    screen to visualize the result of the identification process.
Thank You

Avian Influenza (H5N1) Warning System Using Dempster-Shafer Theory and Web Mapping

  • 1.
    INTERNATIONAL SEMINAR INDONESIAN STUDENTSIN ASEAN " Green Technology, Social Work and Public Health for Development of Indonesia" Bangkok, Thailand 28 - 29 Oktober 2011 Avian Influenza (H5N1) Warning System using Dempster-Shafer Theory and Web Mapping Andino Maseleno andinomaseleno@yahoo.com DEPARTMENT OF COMPUTER SCIENCE FACULTY OF SCIENCE UNIVERSITI BRUNEI DARUSSALAM
  • 2.
    AGENDA  INTRODUCTION  FLOWCHART  DEMPSTER-SHAFER  WEB MAPPING  IDENTIFICATION  ARCHITECTURE  CONCLUSION
  • 3.
    INTRODUCTION  World Health Organization (WHO): In the 2011 from 15 countries, Indonesia has the largest number death because Avian Influenza which 146 deaths.  Early warning is the provision of timely and effective information, through identified institutions, that allows individuals exposed to a hazard to take action to avoid or reduce their risk and prepare for effective response.  Dempster-Shafer theory to combine beliefs in certain hypotheses under conditions of uncertainty and ignorance, and allows quantitative measurement of the belief and plausibility in our identification result.  Web Mapping for displaying maps on a screen to visualize the result of identification process.
  • 4.
    FLOWCHART Flowchart of AvianInfluenza (H5N1) Warning System Start Location Yes Input Symptoms m1 (B) m2 (C) No m (A) = 1 Location and Disease End
  • 5.
    DEMPSTER-SHAFER The advantages ofthe Dempster-Shafer theory:  It has the ability to model information in a flexible way without requiring a probability to be assigned to each element in a set.  It provides a convenient and simple mechanism (Dempster’s combination rule) for combining two or more pieces of evidence under certain conditions.  It can model ignorance explicitly.
  • 6.
    WEB MAPPING Web mapping is the process of designing, implementing, generating and delivering maps on the World Wide Web. The web mapping server is the engine behind the maps. The mapping server or web mapping program needs to be configured to communicate between the web server and assemble data layers into an appropriate image.
  • 7.
    IDENTIFICATION Avian Influenza (H5N1)Symptoms: 1. Depression 2. Combs, wattle, bluish face region 3. Swollen face region 4. Narrowness of eyes 5. Balance disorders
  • 8.
    IDENTIFICATION Symptom 1 Depression isa symptom of Avian Influenza (AI), Newcastle Disease (ND), Fowl Cholera (FC), Infectious Bronchitis respiratory form (IBRespi), Infectious Bronchitis reproduction form (IBRepro), and Swollen Head Syndrome (SHS). The measures of uncertainty, taken collectively are known in Dempster Shafer Theory terminology as a ``basic probability assignment'' (bpa ). m1{AI, ND, FC, IBRespi, IBRepro, SHS} = 0.7 m1{Θ} = 1 - 0.7 = 0.3
  • 9.
    IDENTIFICATION Symptom 2  Combs,wattle, bluish face region are symptoms of Avian Influenza with a bpa of 0.9, so that: m2{AI} = 0.9 m2 {Θ} = 1 – 0.9 = 0.1  calculate the new bpa value
  • 10.
    IDENTIFICATION Symptom 3  Swollen face region is a symptom of Avian Influenza, Newcastle Disease, Fowl Cholera with a bpa of 0.83, so that m4 {AI, ND, FC} = 0.83 m4 (Θ) = 1 – 0.83= 0.17  calculate the new bpa value
  • 11.
    IDENTIFICATION Symptom 4  Narrownessof eyes is a symptom of Swollen Head Syndrome with a bpa of 0.9, so that: m6 (SHS) = 0.9 m6 (Θ) = 1 – 0.9 = 0.1  Calculate the new bpa value
  • 12.
    IDENTIFICATION Symptom 5  Balancedisorders are symptoms of Newcastle Diseases and Swollen Head Syndrome with a bpa of 0.6, so that: m8 {ND,SHS} = 0.6 m8 {Θ} = 1 - 0.6 = 0.4  Calculate the new bpa value
  • 13.
    ARCHITECTURE Architecture of AvianInfluenza (H5N1) Warning System Dempster-Shafer Map Database Map Dempster-Shafer Database Map Dempster- Components Shafer Model Spatial Knowledge Database Base Web Server Data Preparation, File Management, Application Execution Web Browser Menu, Hyperlinks, Map Display, Query Spasial, Diseases Identification, Location Identification
  • 14.
  • 15.
  • 16.
    CONCLUSION  Identification of avian influenza can be performed using Dempster Shafer Theory and Web Mapping.  Application is built to display the map of the region by the villages, districts, and regencies or municipalities.  Web Mapping and Dempster-Shafer theory can be built as an early warning system of avian influenza.  Dempster-Shafer theory to combine beliefs in certain hypotheses under conditions of uncertainty and ignorance, and allows quantitative measurement of the belief and plausibility in identification result.  Web Mapping is also used for displaying maps on a screen to visualize the result of the identification process.
  • 17.