Download as PDF, PPTX


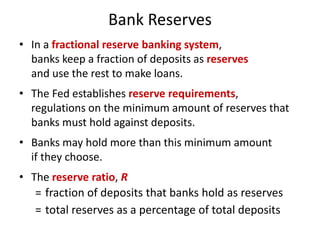
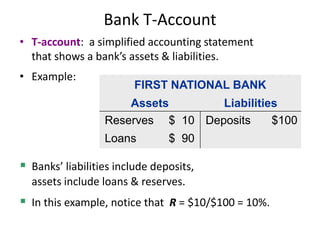
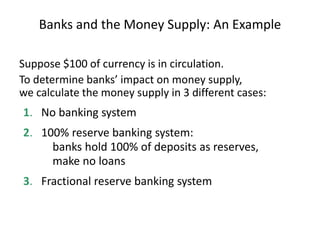
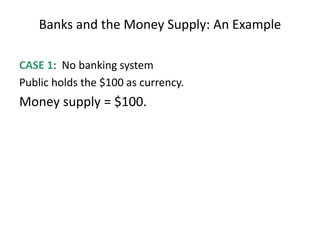
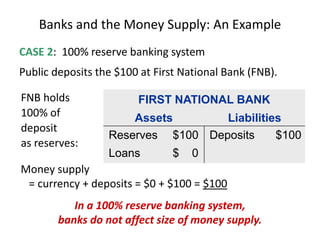
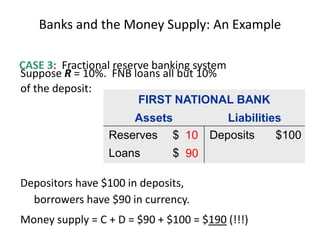
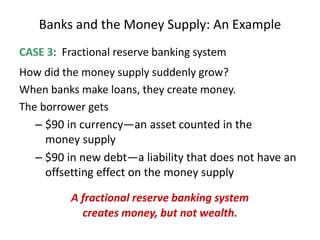
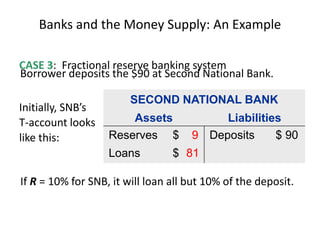
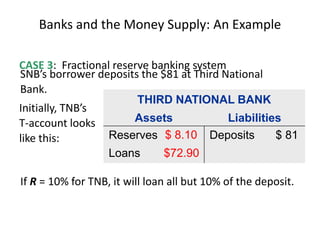
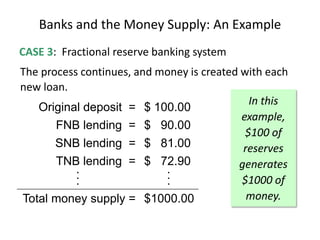
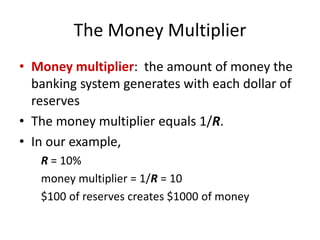
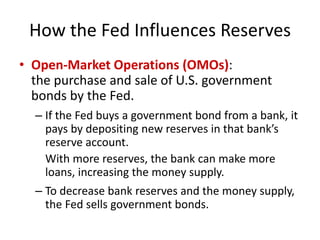
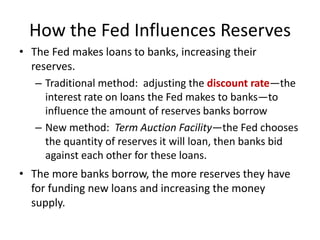
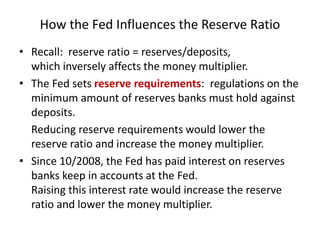
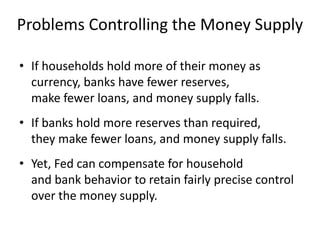

The document discusses money supply and the role of commercial banks and central banks. It introduces the money multiplier concept, showing how fractional-reserve banking allows banks to create money through lending. A $100 deposit that is lent out multiple times across different banks can expand the money supply to $1000. The central bank, like the Federal Reserve, uses tools like open market operations and reserve requirements to influence bank reserves and money multiplication, thereby regulating the overall money supply and short-term interest rates in the economy.