Download to read offline

![Geoengineering Final Report
UC01-001; AR10-182
July 27th, 2011
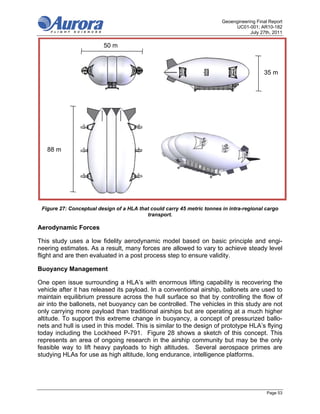
7.2.2 Uncertainty Analysis
As with aircraft, uncertainty analysis is performed to determine cost estimates sensitivity
to changes in key design variables. Table 12 shows the input variables and their varia-
tion, which are slightly different from the aircraft analysis due to the nature of the mod-
els.
Table 12: Uncertainty Analysis varied key design variables to determine maximum and minimum
cost
Variable Variance
HLA Mass +/- 10%
Engine Tt4 +/- 100 K
Max Engine Trust +/- 10%
Mission Time +/- 40 min
Cost of Fuel +/- 10%
Fuel Mass per Mission +/- 10%
This analysis produced maximum and minimum costs for the top ranking architecture at
each altitude. It is apparent that the most uncertain aspect of the cost estimates, similar
to airplane cost estimates, is the engine RDT&E cost. To take this into account, an addi-
tional propulsion uncertainty is added onto the total non-recurring cost calculation as
shown in Table 13. This uncertainty grows noticeably with altitude, but to a lesser de-
gree than in airplane cost estimates which use a similar engine cost model but has larg-
er propulsion cost uncertainty due to the limitations of integrating propulsion onto an
airplane. This is due to the extra flexibility the airship allows. It is relatively simple to
add an additional engine or gear box and larger propeller to the airship without impact-
ing its payload significantly.
Table 13: Additional uncertainty due to specialized engine development needed to perform at high
altitudes.
<65,000 [ft] 65,000 [ft] 80,000 [ft] 100,000 [ft]
No change +/- 10% of Engine RDT&E +/- 20% of Engine RDT&E +/- 30% of Engine RDT&E
7.3 Conclusions
7.3.1 HLA and Campaign Optimization
While the model used in this study provided an effective design and evaluation tool, it is
not a suitable optimization tool to find robust optima as is done in the new aircraft analy-
sis presented in Section 5. Cases are chosen for evaluation based on previous studies
and an estimated concept of operations, but the computational power was not available
to actively search for these parameters in the design space. As a result, there is no
Page 56](https://image.slidesharecdn.com/aurorageoreport-130310182652-phpapp02/85/Aurora-georeport-56-320.jpg)
![Geoengineering Final Report
UC01-001; AR10-182
July 27th, 2011
guarantee that an optimal solution was found but there is confidence in its general con-
clusions and demonstrated trends. The general trends are threefold
1) The designs tended to heavier payloads that take advantage of the buoyancy of
the HLA.
2) Lower altitudes require smaller vehicles that can carry more payload, driven by
the ratio of Helium density to atmospheric density at cruise altitude. This results
in significantly simpler operations and manufacturing. The large size of airships
for higher altitude is still an operational hurdle.
3) Cruise speed is constrained below 100 knots due to the large frontal area asso-
ciated with HLA’s. The slower cruise speed resulted in longer missions and a
slower operations tempo.
There is also a clear advantage to modern HLA’s at high altitudes where the volume of
helium needed for buoyant flight in a traditional airship (LTA) becomes very large. The
cost of systems at different altitudes also depends heavily on what altitude they are op-
timized for. Thus, the optimal solution at a given altitude will not perform well at other
altitudes. The plots in the appendix 10.3 show the comparison between the optimal so-
lutions and the LTA solutions.
7.3.2 Operational Constraints Considered
As with any vehicle, operations will place constraints on the design. For the subsequent
analysis, the HLA’s are constrained by existing hangers located in the US with the no-
tional idea that similar facilities could be built around the world if needed. These facilities
are shown in Table 14.
Table 14: Existing hangars on in the US constrain airships to 200x65x35 [m] or 650x210x110 [ft]
Location Length [ft] Width [ft] Height [ft]
Akron, OH 1175 325 200
Moffett Field, CA 1170 231 124
Weeksville, NC 1000 220 160
Lakehurst, NJ 1000 220 160
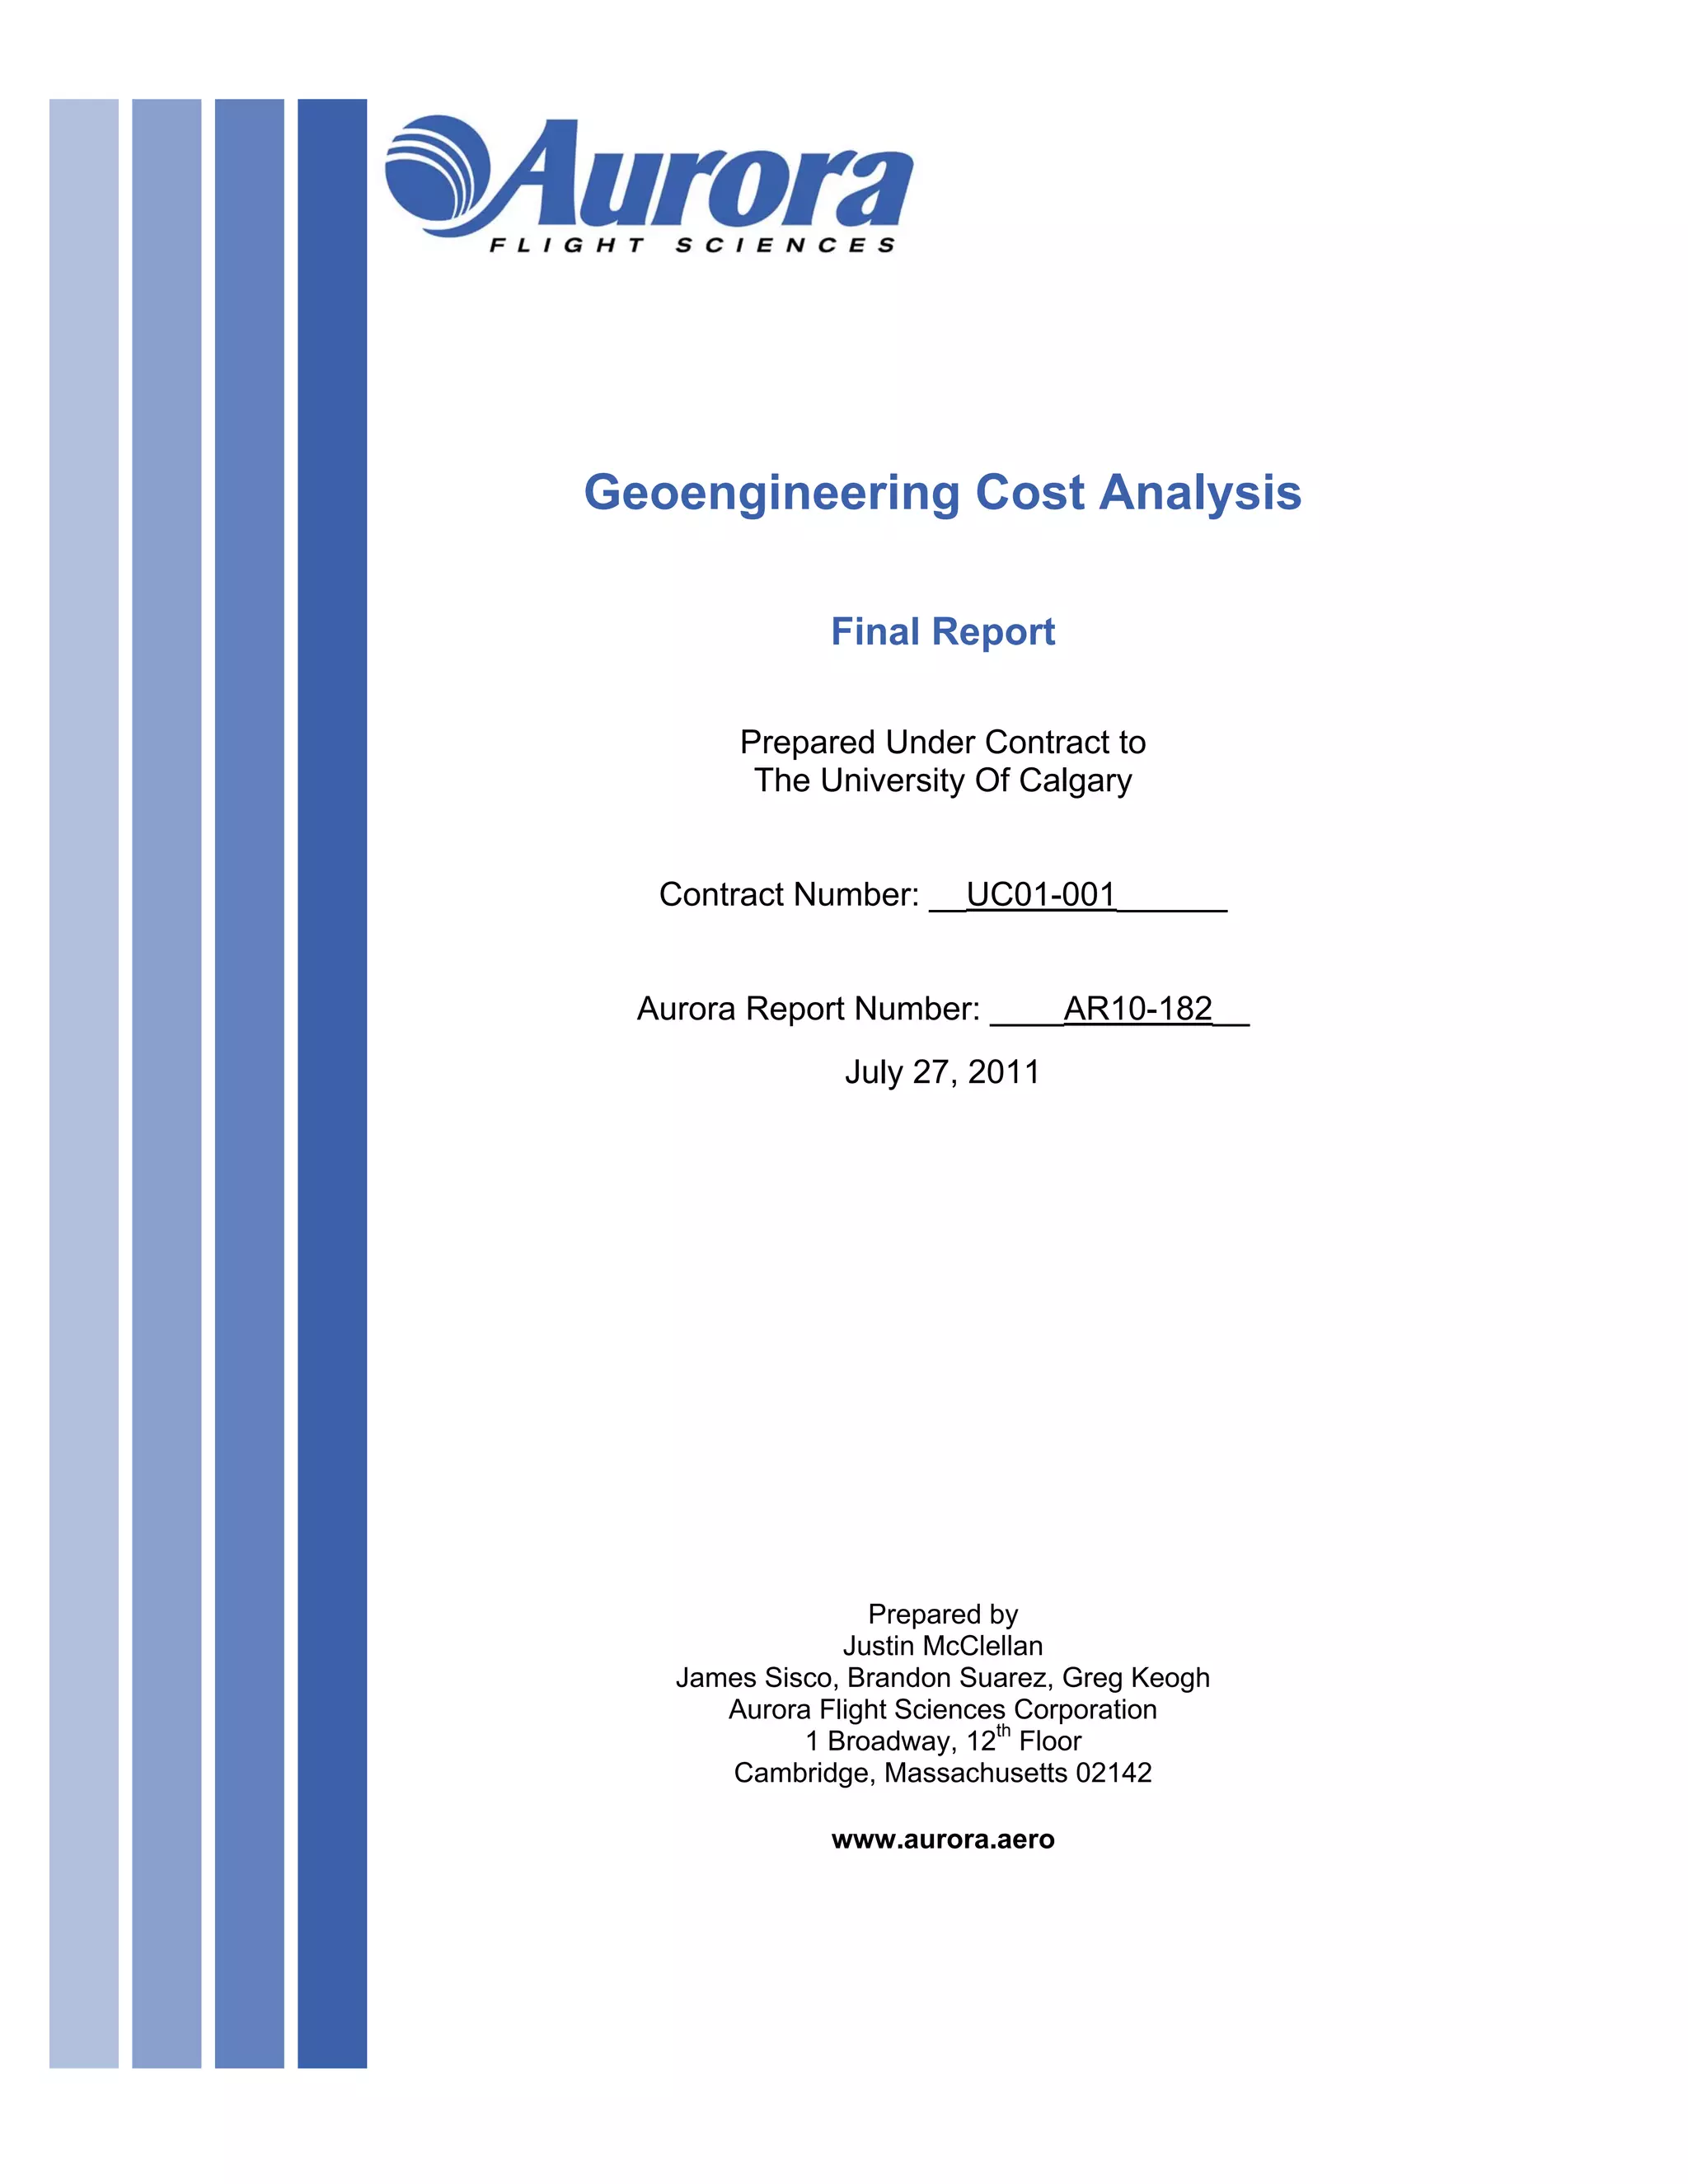
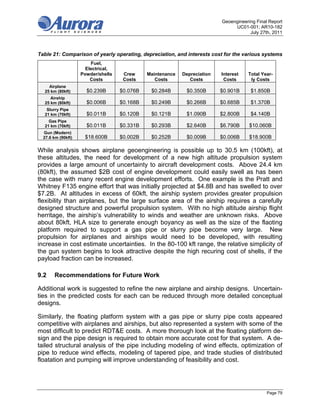
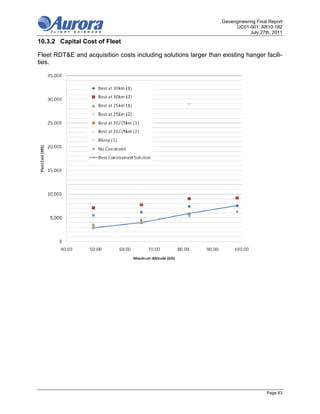
7.3.3 Development and Acquisition Costs
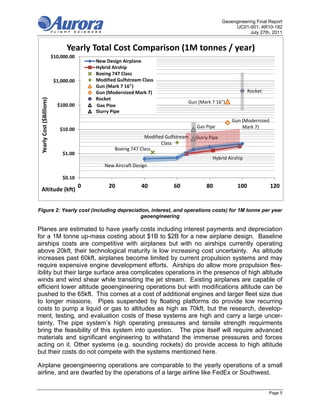
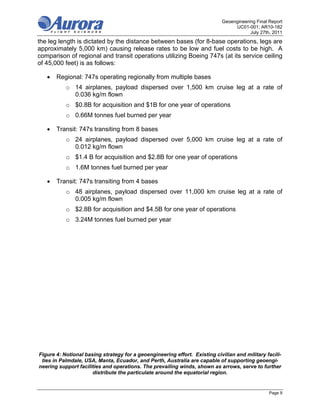
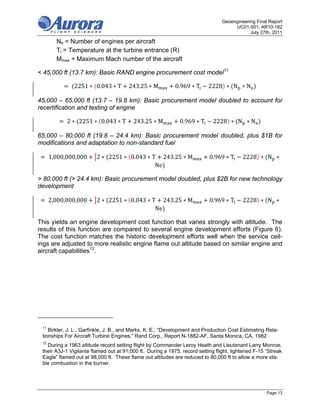
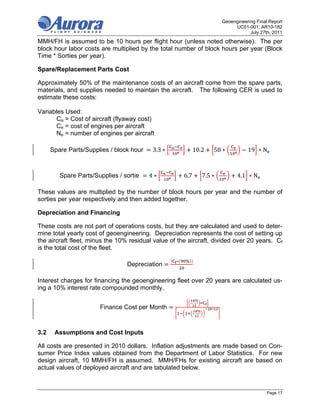
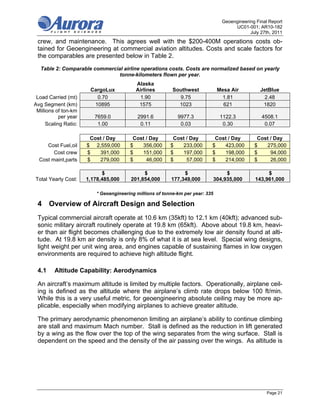
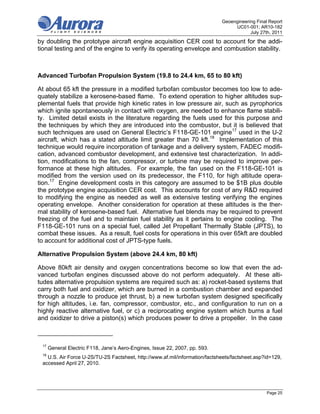
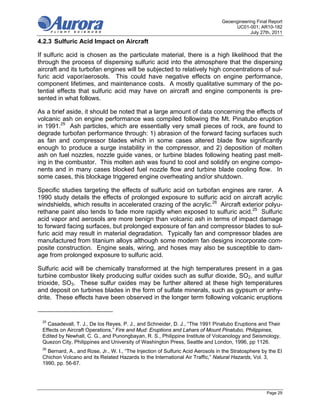
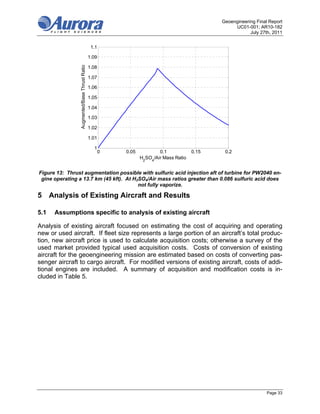
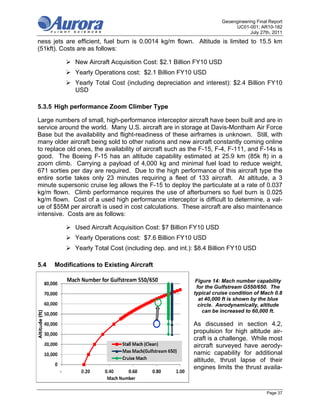
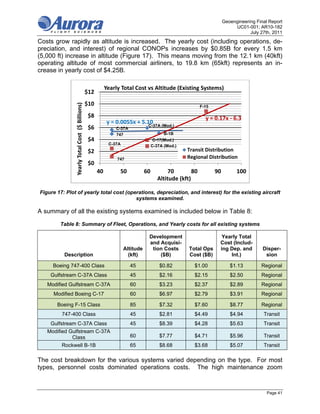
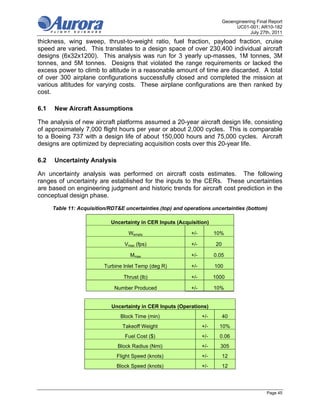
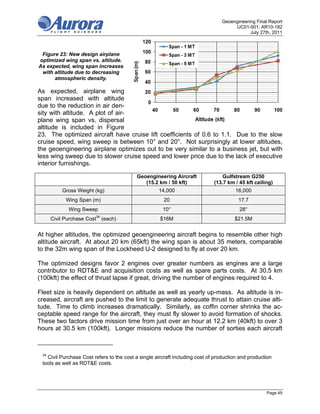
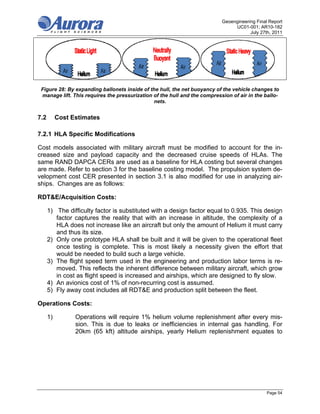
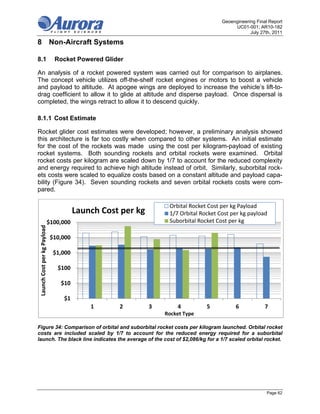
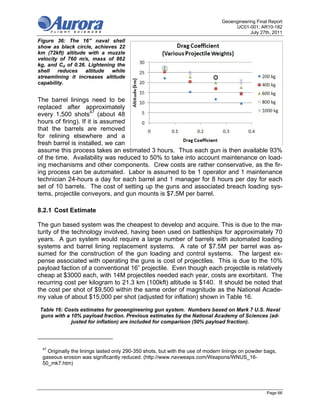
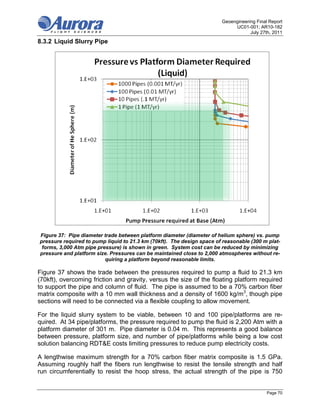
Estimated costs of developing and acquiring the HLA fleet are shown in Figure 30. Each
architecture has a different number of HLA’s in the fleet but overall costs are compara-
ble.
Page 57](https://image.slidesharecdn.com/aurorageoreport-130310182652-phpapp02/85/Aurora-georeport-57-320.jpg)
![Geoengineering Final Report
UC01-001; AR10-182
July 27th, 2011
Development and Acquisition Costs
10
9 Best Constrained Solution
Development and Acquisition Cost [$ Billions]
8 Second Constrained Solution
Maximum Uncertainity
7 Minimum Uncertainity
6
5
4
3
2
1
0
Altitude [kft] 40 50 60 70 80 90 100
Altitude (km) 12.2 15.2 18.3 21.3 24.4 27.4 30.5
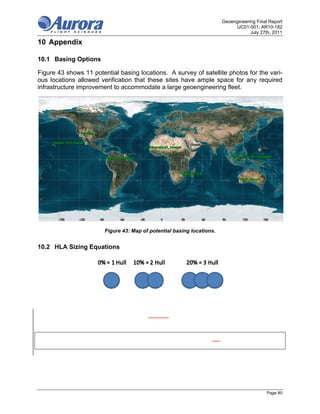
Figure 30: The total cost of the fleet in millions of dollars. Development and acquisition costs
increase with altitude ranging from $2.8 Billion to $7.5 Billion although fleet sizes vary.
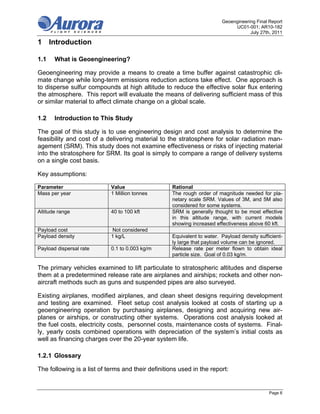
7.3.4 Yearly Operations Cost
Operations costs for each year include the entire fleet for a year fuel, personnel, helium
replacement, and maintenance. As with the other cost models in this study, HLA costs
do not include facilities or infrastructure. This is partly compensated by constraining the
vehicles to fit within existing hangars. It should be noted that here are some non-trivial
operational issues such as severe weather that may impact operations costs.
Page 58](https://image.slidesharecdn.com/aurorageoreport-130310182652-phpapp02/85/Aurora-georeport-58-320.jpg)
![Geoengineering Final Report
UC01-001; AR10-182
July 27th, 2011
Yearly Operations Costs
1.00
Best Constrained Solution
0.90
Second Constrained Solution
0.80
0.70
Yearly Operations [$ Billions]
0.60
0.50
0.40
0.30
0.20
0.10
0.00
Altitude [kft] 40 50 60 70 80 90 100
Altitude (km) 12.2 15.2 18.3 21.3 24.4 27.4 30.5
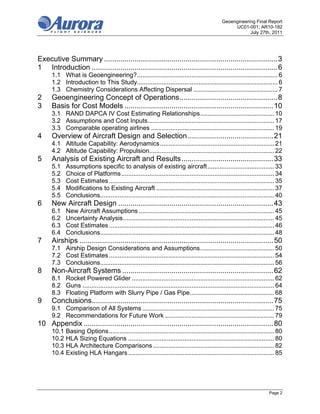
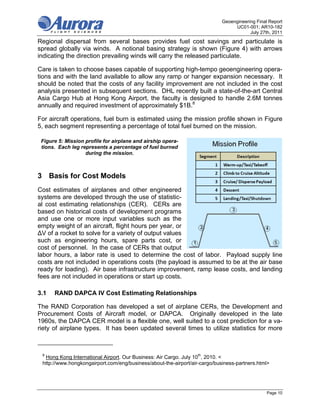
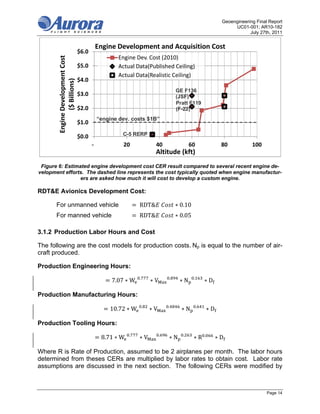
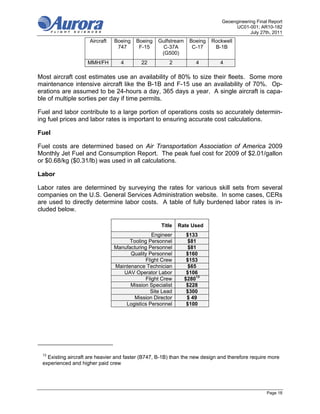
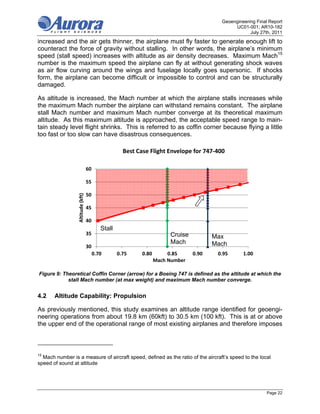
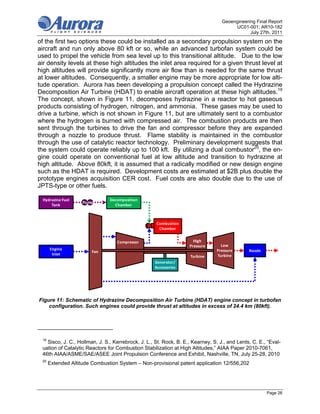
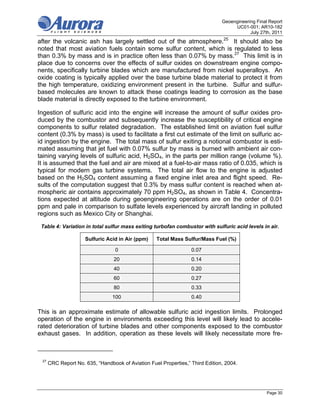
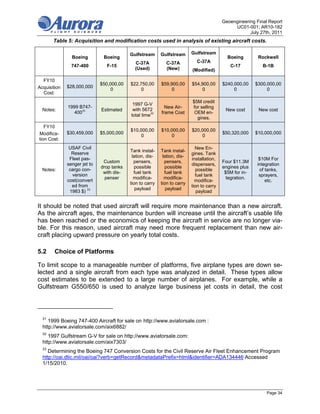
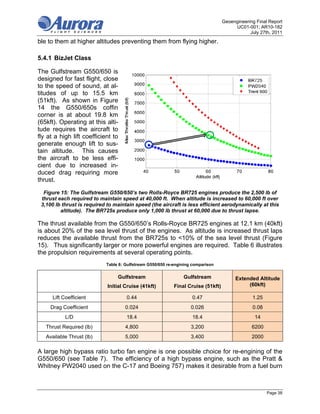
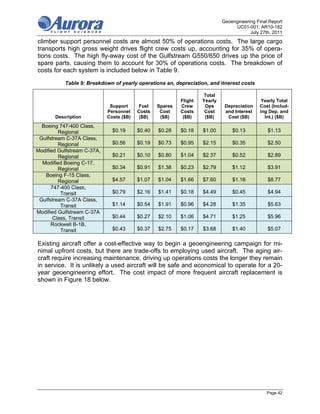
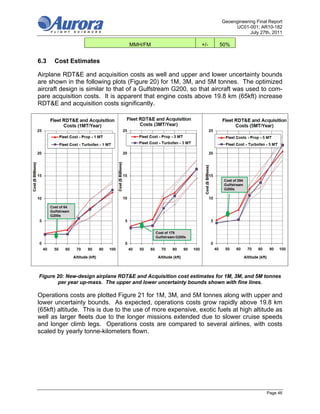
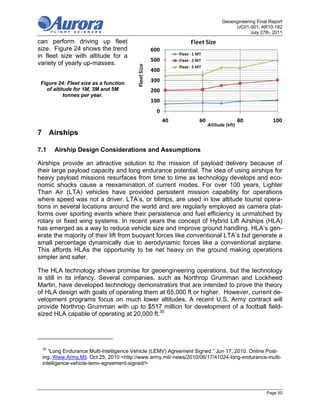
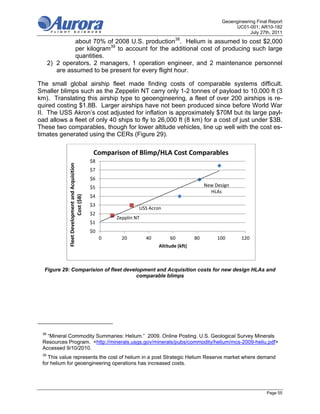
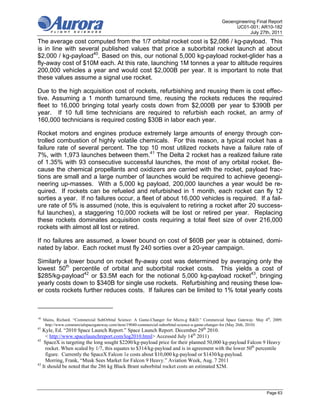
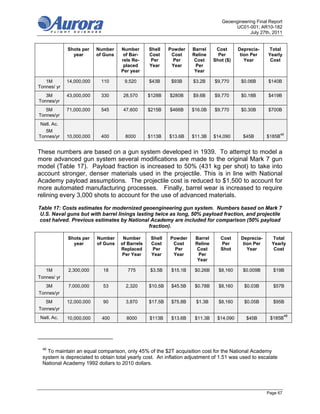
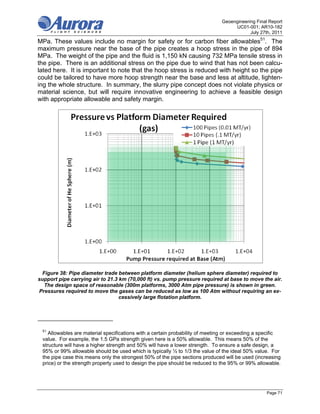
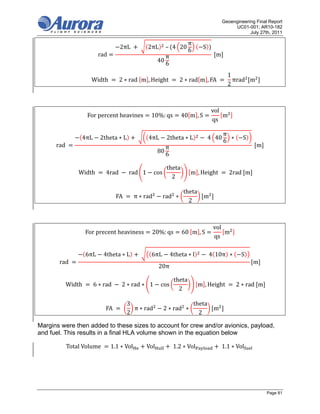
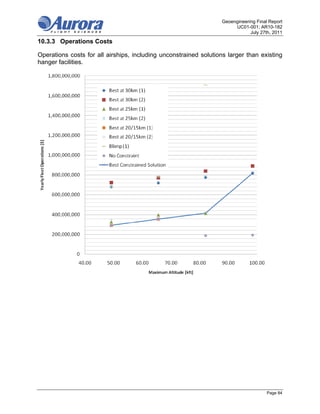
Figure 31: Yearly operations costs for airship geoengineering operations.
Figure 31 shows the fleet operating cost per year. The constrained solution shows a
drastic increase in cost past 24.3 km (80kft) due to the large size and weight of the
higher altitude HLA’s. Air is simply very thin above 24.4 km, about 3.5% of the density
at sea level, requiring large HLAs with small payload fractions. This drives up the fleet
size and the number of sorties per year increasing fuel costs, personnel costs, and
maintenance costs.
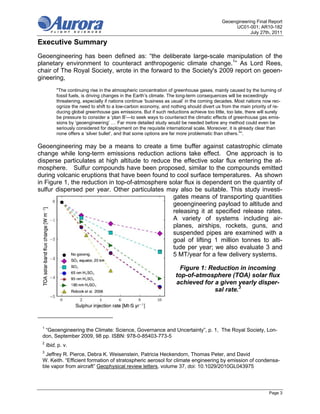
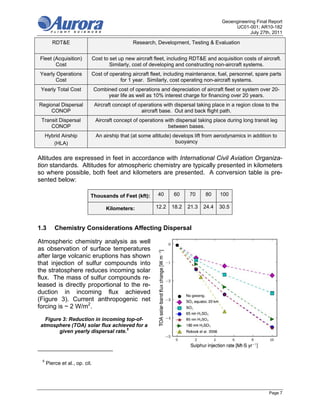
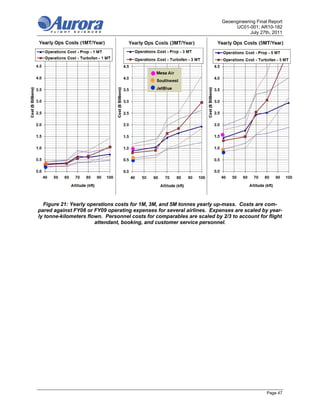
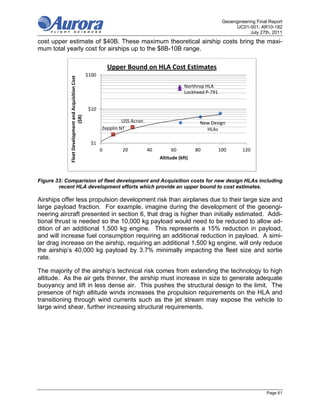
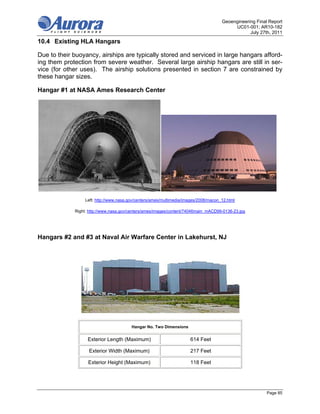
7.3.5 Total Yearly Costs
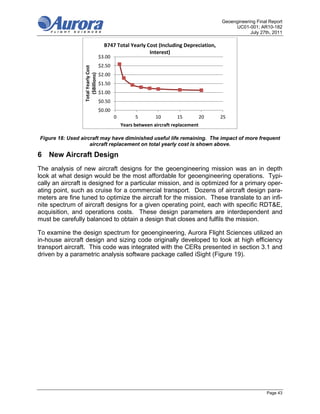
Yearly total costs were computed in the same manner as described for aircraft. Total
yearly costs include cost of operations, interest payments for 20-year financing, and de-
preciation over 20 years.
Page 59](https://image.slidesharecdn.com/aurorageoreport-130310182652-phpapp02/85/Aurora-georeport-59-320.jpg)
![Geoengineering Final Report
UC01-001; AR10-182
July 27th, 2011
Total Yearly Costs
(Including Operations, Depreciations, and Interest)
2.5
Best Constrained Solution
Second Constrained Solution
2.0
Total Yearly Cost [$ Billions]
1.5
1.0
0.5
0.0
Altitude [kft] 40 50 60 70 80 90 100
Altitude (km) 12.2 15.2 18.3 21.3 24.4 27.4 30.5
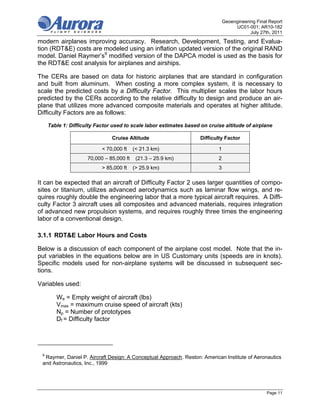
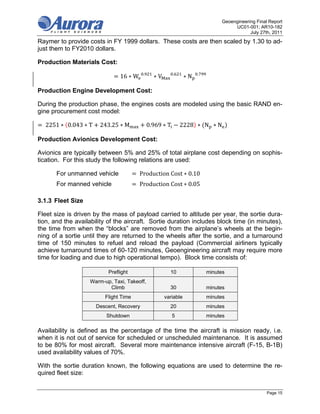
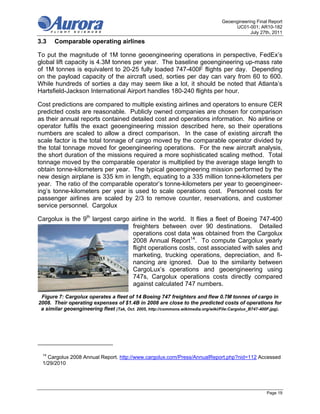
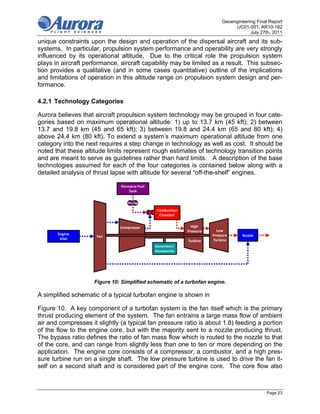
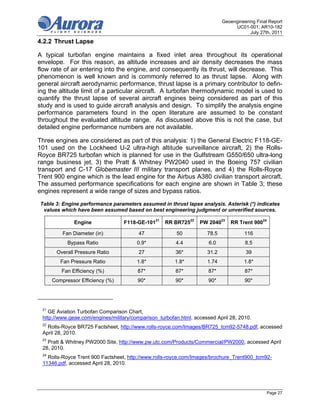
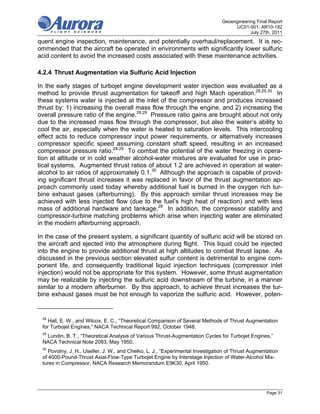
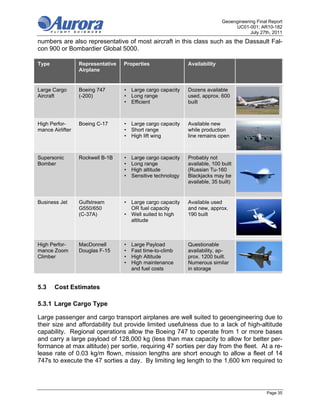
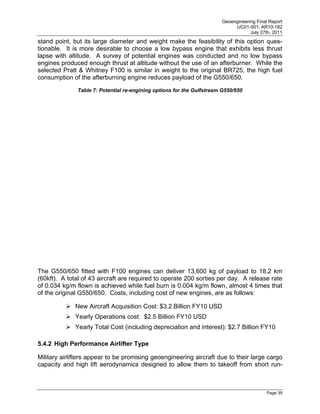
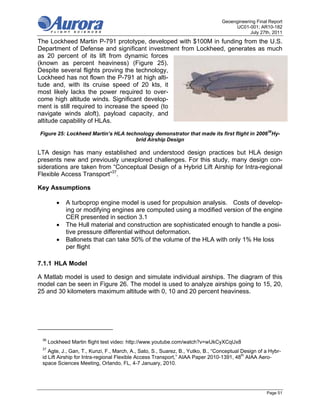
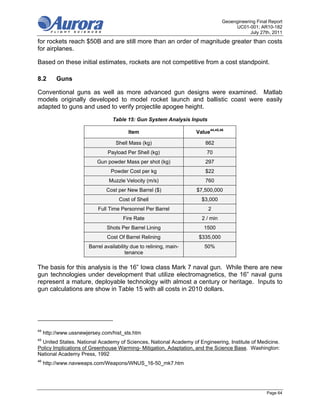
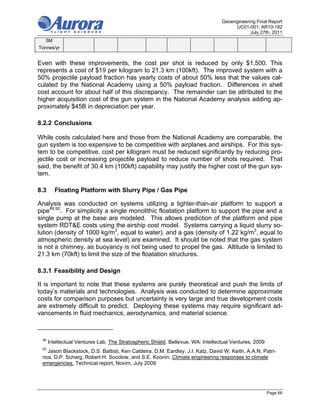
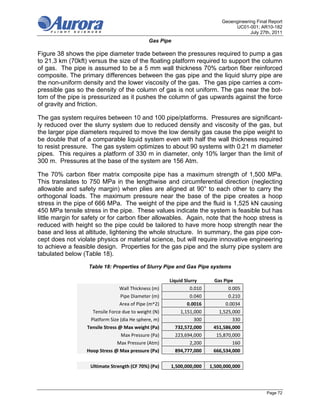
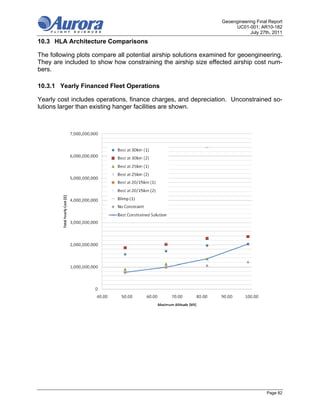
Figure 32: Yearly cost of operation including fleet operation and financial considerations.
Lower fuel costs and the smaller fleet size are likely to allow airships to beat airplane
operating costs. Above 24.4 km (80kft) the air becomes too thin for airships to be a log-
ical choice. The quantities of helium required increases while payload capacity shrinks,
driving airship costs up.
Airships provide a low cost method to transport large quantities of payload, but signifi-
cant development is required mature the HLA concept and move it to the high altitude
required for geoengineering. While the CERs developed for airships provide a good es-
timate of cost, current HLA development efforts are higher than these estimates and re-
flect the immaturity of this technology.
The end goal of these recent HLA development efforts is a 65,000 ft capable airship, so
that altitude is used for comparison purposes. It is important to note that current HLA
prototypes have not exceeded 20,000 ft (6 km) and that even proposed prototypes are
being design for 20,000 ft demonstration. The Northrop Grumman HLA development
effort with up to $500M to produce up to three HLAs capable of carrying an estimated
1,500 kg provides a per ship cost of $166M. This provides one upper bound for geoen-
gineering airships fleet costs of $45B. The Lockheed P-791 HLA prototype, with an es-
timated 1,000 kg payload, was developed for over $100M providing a second HLA fleet
Page 60](https://image.slidesharecdn.com/aurorageoreport-130310182652-phpapp02/85/Aurora-georeport-60-320.jpg)
![Geoengineering Final Report
UC01-001; AR10-182
July 27th, 2011
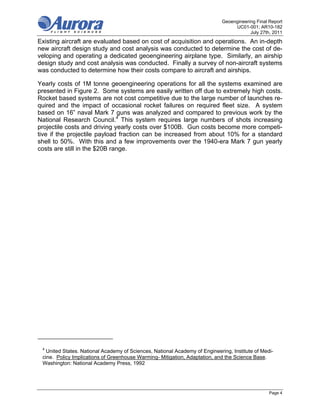
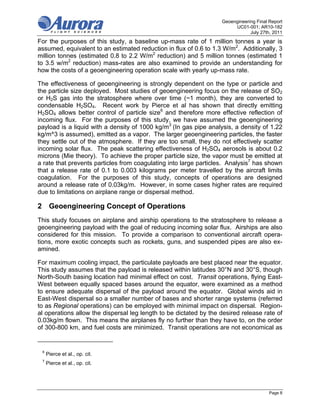
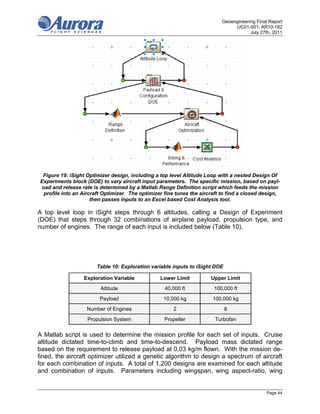
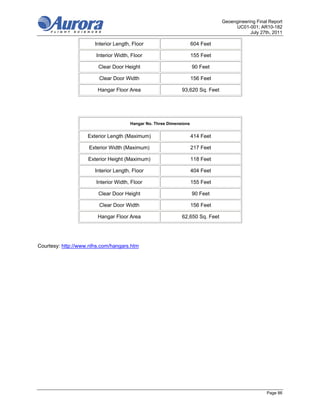
8.3.3 Cost Estimate
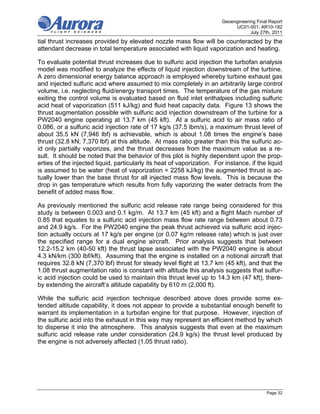
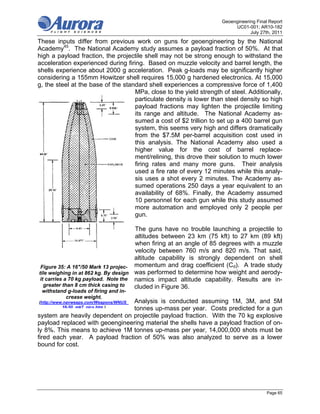
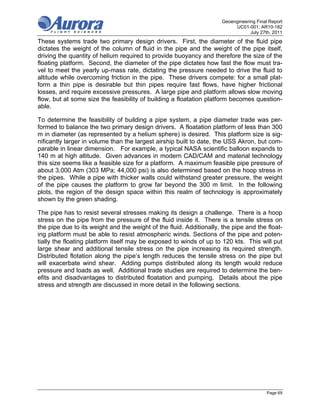
The development costs of a pipe strong enough to constrain the floating platform in the
presence of high altitude winds as well as
resist the extremely high pressure exerted Platform Cost (Airship CER) [M$]
on the pipe are difficult to predict. With
carbon fiber prices on the order of $22 per $500
kilogram and the pipe containing up to $400
114,000 kg of carbon, the material costs
for the pipe are $2.5M. Development of $300
more advanced materials, engineering and $200
development of the pipes themselves, and
testing costs are harder to predict for such $100 Platform Cost ($M, each)
a unique pipe application and easily ex- $0
ceed $1B and may reach perhaps $20B. 0.0 100.0 200.0 300.0 400.0
A value of $10B is used for cost estimates. Diameter of Helium Sphere (m)
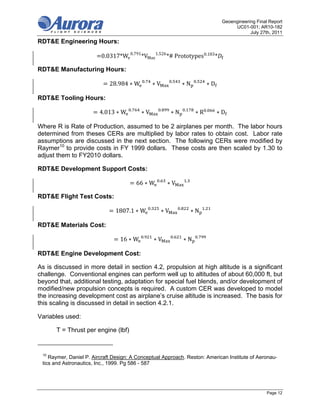
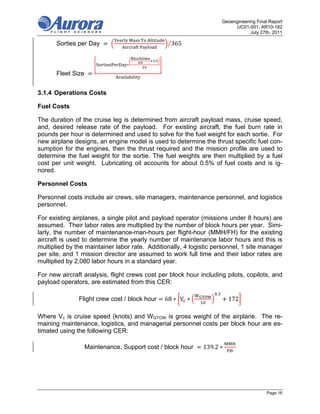
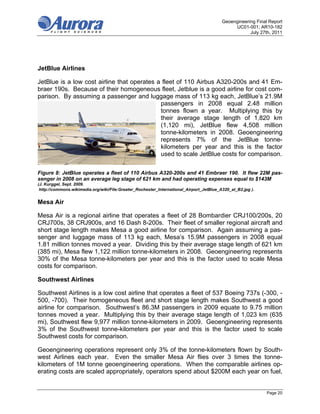
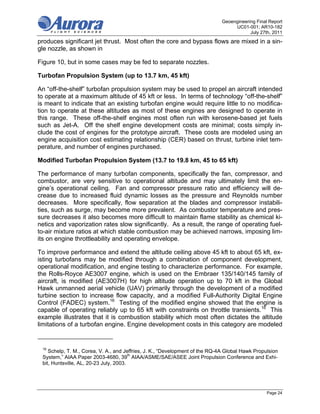
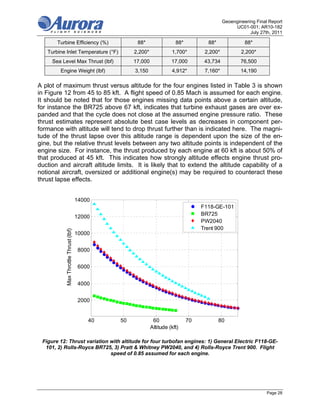
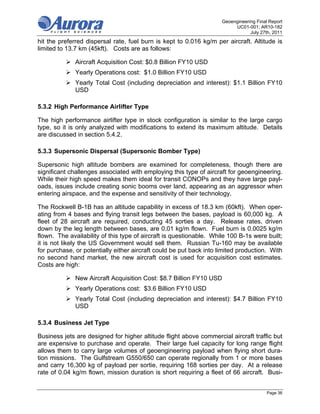
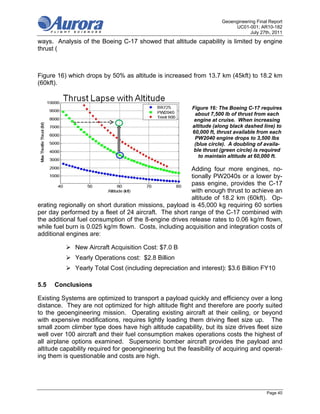
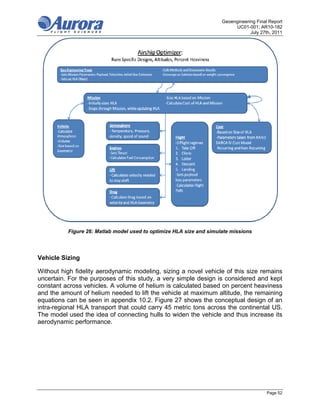
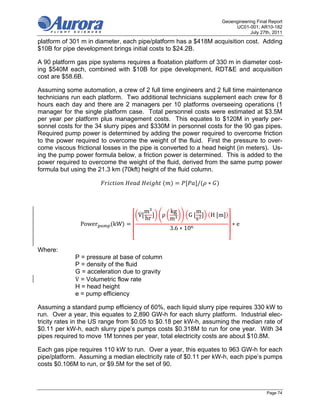
Figure 39: Cost of floatation platform based on airship CER presented in section 7.2.1. Points in-
dicate an airship cost determined with the airship CER. The curve fit was used for cost of the
floating platforms.
The costs associated with building a 10 or 100 dirigibles 300 m diameter are easier to
estimate so that will be the focus of the pipe/platform cost calculations. Utilizing the air-
ship CERs (Figure 39), a 300 m (0.014 km^3) floatation platform costs approximately
$415M. This cost seems reasonable due to the complexity of piping, pumps, and high
pressure equipment. Additionally the floatation platform may make use of propulsion to
counter the effects of winds aloft. Considering the similarity between the floating plat-
form and a deep water oil drilling rig, both support miles-long pipe systems while pump-
ing high pressure drilling fluids and processing high pressure (up to 2,000 Atm) oil and
gas, the drilling rig cost seems to be a good upper bound
for platform cost. At 106x70m the Cajun Express deep
water oil drilling rig pictured in Figure 40 rents out at
about $500,000 per day and has a cost of about $600M.
This is in good agreement with the values predicted by
the CER.
Figure 40: The Cajun Express deep water drilling rig. At
106x70m and with up to 10.6 km (35kft) of pipe down to a pocket
of high pressure oil and natural gas, these off shore rigs are
analogous to a floating geoengineering platform (Transocean
image, http://www.deepwater.com/fw/main/Cajun-Express-52C17.html).
The liquid slurry system requires 34 platforms and slurry
pipes to reduce pressures and platform buoyancy re-
quirements enough for the system to be feasible. With a
Page 73](https://image.slidesharecdn.com/aurorageoreport-130310182652-phpapp02/85/Aurora-georeport-73-320.jpg)
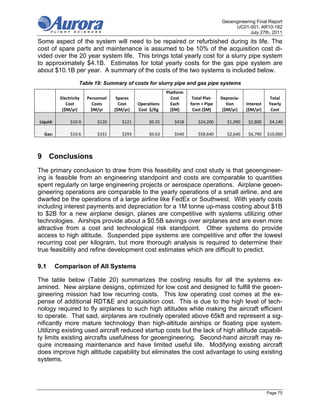
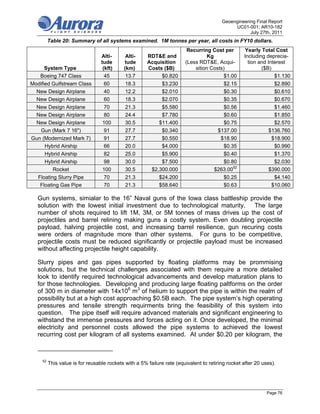
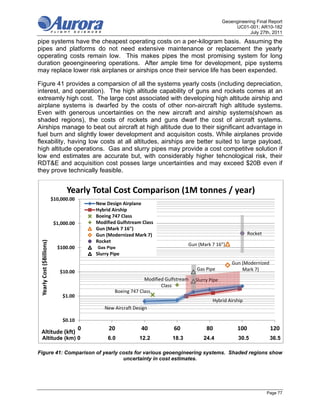

This report analyzes various systems for transporting particulate to stratospheric altitudes for solar radiation management (SRM) geoengineering. It evaluates the costs of using existing aircraft, new aircraft designs, airships, rockets, guns, and suspended pipes to lift 1 million metric tonnes of payload per year to altitudes between 40,000 and 100,000 feet. It finds that new aircraft designs and modified commercial aircraft could transport payload for $1-2 billion annually, while airships have comparable costs but greater technical uncertainties. Rockets, guns, and suspended pipes have much higher predicted costs or technical challenges that reduce their feasibility compared to aircraft options.


![Fema 403 wtc[1]](https://cdn.slidesharecdn.com/ss_thumbnails/fema403wtc1-120118181853-phpapp01-thumbnail.jpg?width=640&height=640&fit=bounds)


