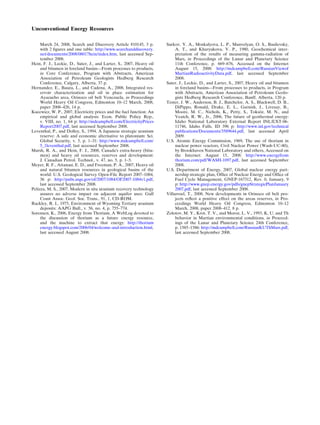
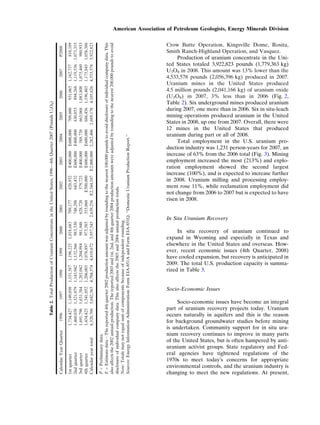
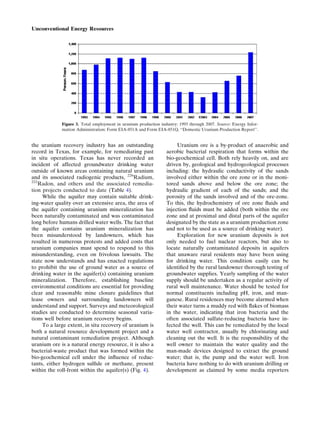
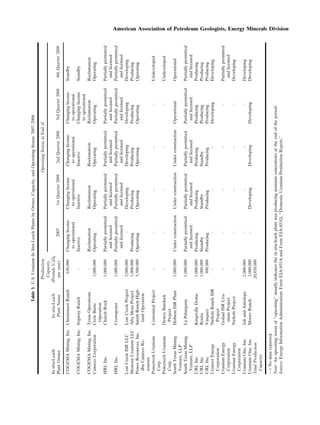
This paper summarizes reports from the Energy Minerals Division of the American Association of Petroleum Geologists on five unconventional energy resources: gas hydrates, gas shales, geothermal resources, oil sands, and uranium resources. It discusses current U.S. and global research and development activities related to these resources. Gas hydrates have enormous potential resources but production technologies are still under development. Gas shales, geothermal, oil sands, and uranium are increasingly being explored and developed and are becoming important energy resources.


![already begun (Surkov and others, 1980; Zolotov,
Krot, and Moroz, 1993). With the number of
unmanned missions planned in the next few years,
additional information should be available to begin
looking actively for resources in our solar sys-
tem hopefully within the next 20–30 years and
beyond, supported by both solar and nuclear power
(Campbell and others, in prep).
ACKNOWLEDGMENTS
The authors wish to thank two anonymous
reviewers. Their comments greatly improved the
quality of the paper.
REFERENCES
Armbrustmacher, T. J., Modreski, P. J., Hoover, D. B., and Klein,
D. P., 1995, Thorium-rare earth element vein deposits, U.S.
Geological Survey Open File Report 831 (Chapter 7), p.
50–53, Accessed the Internet on August 15, 2008: http://
pubs.usgs.gov/of/1995/ofr-95-0831/CHAP7.pdf, last accessed
September 2008.
Alberta Energy and Utilities Board, 2007, AlbertaÕs Energy
Reserves 2006 and Supply/Demand Outlook 2007–2016,
Alberta Energy and Utilities Board, Statistical Series, ST98-
2007, p. 1–1 to 9–14, 4 Appendices.
Alberta Energy Resources Conservation Board, 2008, AlbertaÕs
Energy Reserves 2007 and Supply/Demand Outlook 2008–
2017, Alberta Energy and Utilities Board, Statistical Series,
ST98-2008, variously paginated: http://www.ercb.ca/docs/
products/STs/st98_current.pdf, last accessed September 2008.
American Association of Petroleum Geologists, Energy Minerals
Division 2007, Unconventional energy resources and
geospatial information—2006 review: Nat. Resour. Res, v. 16,
no. 3, p. 243–261.
Campbell, M. D., King, J. D., Wise, H. D., Handley, B., and
Campbell, M. D., II, in prep., The role of nuclear power in
space exploration and the associated environmental safe-
guards: an overview, 2009 Report of the Uranium Commit-
tee: Energy Minerals Division, American Association of
Petroleum Geologists. To be released at the AAPG Con-
vention, June 21, Denver, CO.
Campbell, M. D., King, J. D., Wise, H. M., Rackley, R. I., and
Handley, B. N., 2008, The Nature, extent of uranium
reserves, resources, their Environmental development in the
U.S., overseas: American Association of Petroleum Geolo-
gists: Annl Convent Program, v. 17, p. 27.
Campbell, M. D., Wise, H. M., and King, J. D., 2008, Nuclear fuel
exploration, in situ recovery, and environmental issues in
context with the national energy needs through year 2040,
in Proceedings of the Texas Commission on Environmental
Quality Conference and Trade Fair, April 30, Austin, Texas,
CD-ROM.
Campbell, M. D., Wise, H. M., and Rackley, R. I., 2007, Uranium
in situ leach (recovery) development and associated envi-
ronmental issues: Gulf Coast Assoc. Geol. Soc. Trans., v. 91,
18 p: http://www.mdcampbell.com/CampbellWiseRackleyGC
AGS2007.pdf, last accessed September 2008.
Campbell, M. D., Wise, H. M., and Evensen, D., 2005, Recent
uranium industry developments, exploration, mining and
environmental programs in the U.S. and Overseas: Report of
the Uranium Committee, Energy Minerals Division, AAPG,
March 25: (http://www.mdcampbell.com/2005EMDuranium
Report.pdf, last accessed February 15, 2009.
Christopher, P. A., 2007, Technical report on the Coles Hill ura-
nium property, Pittsylvania County, Virginia (North and
South Deposits), for Virginia Uranium, Inc., Chatham,
Virginia, November 6 (A 43-101 Report), 49 p: http://
www.mdcampbell.com/ColesHill UraniumVirginia.pdf, last
accessed February 15, 2009.
Collett, T. S., Agena, W. F., Lee, M. W., Zyrianova, M. V., Bird,
K. J., Charpentier, T. C., Houseknect, D. W., Klett, T. R.,
Pollastro, R. M., and Schenk, C. J., 2008, Assessment of gas
hydrate resources on the North Slope, Alaska, 2008: U.S.
Geological Survey Fact Sheet 2008–3073, 4 p: http://pubs.
usgs.gov/fs/2008/3073/, last accessed March 16, 2009.
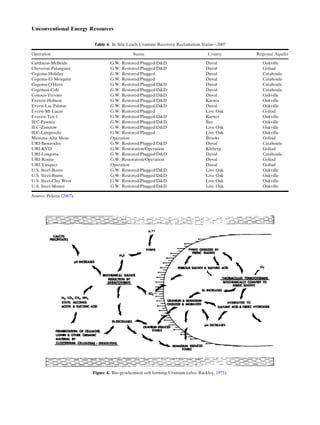
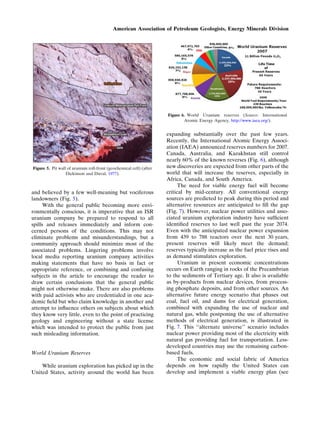
Dickinson, K. A., and Duval, J. S., 1977, Trend areas and explo-
ration techniques—South-Texas uranium: Geologic controls,
exploration techniques, and potential, in Geology [and
Environmental Considerations] of Alternate Energy
Resources, Uranium, Lignite, and Geothermal Energy in the
South Central States, pp. 45–66 (Fig. 4D—p. 51): The
Houston Geological Society, 364 p, http://www.ela-iet.
com/ie08000B.htm, accessed April 1, 2007.
Dusseault,M. B., Zambrano, A., Barrios,J.R.,andGuerra, C.,2008,
Estimating technically recoverable reserves in the Faja Petro-
lifera del Orinoco—FPO, in Proceedings World Heavy Oil
Congress, Edmonton 10–12 March, 2008, paper 2008–437, 6 p.
Energy Information Administration, 2009, U.S. crude oil, natural
gas, and natural gas liquids reserves, 2007 annual report:
Energy Information Administration, DOE/EIA-0216(2007),
145 p.
Ewing, T. E., 2004, Volcanoes, asphalt, tectonics and groundwa-
ter, Field trip guidebook, Gulf Coast Association of Geo-
logical Societies, 54th Convention, San Antonio, TX, South
Texas Geological Society, Guidebook 2004–01, 92 p.
Faraj, B., Williams, H., Addison, G., McKinstry, B., Donaleshen,
R., Sloan, G., Lee, J., Anderson, T., Leal, R., Anderson, C.,
Lafleur, C., and Ahlstrom, J., 2002, Gas shale potential of
selected Upper Cretaceous, Jurassic, Triassic and Devonian
shale formations in the WCSB of western Canada: implica-
tions for shale gas production: Des Plaines, Illinois, Gas
Technology Institute, GRI-02/0233, compact disc, 285 p.
Faraj, B., Williams, H., Addison, G., and McKinstry, B., 2004, Gas
potential of selected shale formations in the western Cana-
dian sedimentary basin: GasTIPS, v. 10, no. 1, p. 21–25.
Hamblin, A. P., 2006, The ‘‘shale gas’’ concept in Canada: a
preliminary inventory of possibilities: Geological Survey of
Canada, Open File 5384, 108 p.
Hein, F. J., 2006, Heavy oil and oil (tar) sands in North American:
An overview and summary of contributions: Nat. Resour.
Res., v. 15, no. 2, p. 67–84.
Hein, F. J., and Marsh, R. A., 2008, Regional geologic framework,
depositional models and resource estimates of the oil sands of
Alberta, Canada, in Proceedings World Heavy Oil Congress,
Edmonton 10–12 March, 2008, paper 2008-320, 9 p.
Hein, F. J., Marsh, R. A., and Boddy, M. J., 2007, Overview of the
oil sands and carbonate bitumen of Alberta: Regional geo-
logic framework and influence of salt-dissolution effects,
in Proceedings and Abstracts, American Association of
Petroleum Geologists Hedberg Conference, Heavy Oil and
Bitumen in Foreland Basins—From Processes to Products,
September 30–October 3, 2007, Banff and Calgary, AB,
Canada, extended digital abstract, modified and posted
American Association of Petroleum Geologists, Energy Minerals Division](https://image.slidesharecdn.com/8eda8511-fc89-45fd-9cf9-a4b70758ad9c-150415202928-conversion-gate01/85/EMD_AAPG_2009_NRR_online_first-18-320.jpg)