
Recommended
Recommended
More Related Content
Similar to Evaluating Interface Properties and Predicting Landfill Liner Stability Under Static and Seismic Loading
Similar to Evaluating Interface Properties and Predicting Landfill Liner Stability Under Static and Seismic Loading (20)
Recently uploaded
Recently uploaded (20)
Evaluating Interface Properties and Predicting Landfill Liner Stability Under Static and Seismic Loading
- 1. 1 INTRODUCTION The world consumption of natural resources has been increasing exponentially. In Japan the consumption of resource is at 1900 million tones annually. This consumption generates waste of 600 million tones, which consist of 400 million tons of industrial waste and 50 million tons of municipal waste. Out of this 220 million tons are recycled and reused, 324 million tons are pre-treated waste for disposal. 56 million tons are disposed to landfill in Japan in year 2000. The estimated life spend of landfill site in Japan is about 6 to 7 years of operational. It becomes very difficult to build new sites in Japan cause of the syndrome of “Not In My Back Yard”. The cost of a new site in Tokyo could cost up to 500 million US dollars. The running cost of existing landfill site in Tokyo is at 300 USD / m3 . A landfill also behaves as in-situ bioreactor, where the contents undergo complex biochemical reactions. The adoption of suitable design and construction methods are essential not only to reduce design and construction cost, but also to minimize long term operation, maintenance and monitoring cost. 1.1 BASIC LANDFILL DESIGN An engineered landfill site must be geologically, hydrologically and environmentally suitable. As such landfill site need to be carefully design to envelope the waste and prevent escape of leachate into the environment. Most important requirement of a landfill site is that it does not pollute or degrade the surrounding environment. An engineered Municipal Solid Waste landfills consist of the following (Xuede Qian (2002): Evaluating interface properties and predicting landfill liner stability under static and seismic loading Saravanan, M.1 . Kamon, M.2 , Faisal, H. A.3 , Katsumi T.4 , Akai, T.5 , Inui, T.6 , and Matsumoto, A.5 1 Graduate Student, Graduate School of Global Environmental Studies, Kyoto University, Kyoto, Japan 2 Professor, Graduate School of Global Environmental Studies, Kyoto University, Kyoto, Japan 3 Professor, Department of Civil Engineering, University Malaya, Kuala Lumpur, Malaysia. 4 Associate Professor, Graduate School of Global Environmental Studies, Kyoto University, Kyoto, Japan 5 Senior Research Scientist, Technology Research Institute of Osaka Prefecture, Osaka, Japan 6 ABSTRACT: Predicting landfill stability and maintaining stable configuration during filling is responsibility of engineers. Majority of failures occurs within waste mass and along landfill liners. This paper will discuss the methods adopted to predict landfill liner stability in terms of interface performances. Interfaces shear strength parameter evaluation for landfill liner systems have been a tedious testing process. Various testing methods and guidelines have been proposed by engineers and researchers over the years. The current testing procedures are based on ASTM testing guideline and basic fundamental engineering testing philosophies. Hence there is a need for much ideal testing equipment which can perform the entire test series required for landfill liner parameter evaluations. The equipment are required to perform interface test between 1) soil and soil (GCLs), 2) geomembrane (HDPEs and PVC) and soil, 3) geosynthetic (GCLs) / compacted (CCLs) clay liners and soil, 4) geomembrane and geotextile, 5) geotextile and soil, 6) geotextile and geosynthetic (GCLs) / compacted (CCLs) clay liners, 7) geomembrane and geosynthetic (GCLs) / compacted (CCLs) clay liners. Having such variety in requirement and testing complexity for landfill liner system, this paper also addresses the modification adapted to a large scale shear box in order to perform the above said interface tests. The modified large scale shear box is used to study interface performance of various combination of liners. Test data are compiled into landfill models to study the stability performance of landfill liners under static and seismic loading. Finding from the analysis are compiled further to evaluate interface factor of safety prediction methodology for landfill liners. The liner interface parameter data together with factor of safety prediction methodology presented herewith will be a quick reference guide for engineers. Details of laboratory test and analysis results will be presented here with.
- 2. i. Bottom and lateral side liners system ii. Leachate collection and removal system iii. Gas collection and control system iv. Final cover system v. Strom water management system vi. Ground water monitoring system vii. Gas monitoring system During construction or design of a landfill site, the engineers required to perform detail engineering evaluation on : i. Landfill foot print layout ii. Subsoil grading iii. Cell layout and filling iv. Temporary cover selection v. Final cover grading vi. Final cover selection The above are directly relate to geotechnical engineering works which involves the use of ground improvement and slope stabilization technology. Although the issue of landfill and environmental stability is part of global environmental problem, it is essential to solve them one by one. Every geotechnical engineers are required to engage in the environmental engineering problems with the motto of “Think Globally, Act Locally” (Kamon 2001). 1.2 SCOPE OF ENVIRONMENTAL GEOTECHNICS The definition of research fields of “Environmental Geotechnics” is not clear among the geotechnical engineers. The main research objects of environmental geotechnics are classified as “creation of better environment”, “prevention of environmental risks to human activities” and “prevention of danger on human life caused by natural hazards” (Kamon 1989). Tabulated below are the three major definitions or classification of environmental geotechnics. The prevention of natural disaster should be considered as one of the most important research issues among the environmental geotechnical engineers. Movement of the earth materials during earthquakes, landslides, subsidence, volcanic eruption are to be considered as part of environmental geotechnics issues. The prevention of environmental risks cause by human activities is the most suitability associated with environmental geotechnical activities. Table 1 : Definition of environmental geotechnics (Kamon, 2001) Classification Content Subjects Creation of better environment Geotechnical activities aiming to improve the environment Geotechnical creation of more comfortable and safe environment for human being Geotechnical activities causing environmental interference and/or avoiding risks in the geosphere Ground settlement, soil erosion, ground vibration, obstacles of underground water, etc. Waste containment and reuse of waste as geotechnical materials Reclamation of MSW and industrial waste, Storage of radioactive waste, recycling, etc. Prevention of environmental risk cause by human activities Remediation for the contaminated ground Clean-up of polluted underground water and soil Prevention of dangers on human life caused by natural hazards Geotechnical activities for disaster prevention Landslide, debris flow, liquefaction, volcanic eruption, etc. 1.3 ENVIRONMENTAL ENGINEERING ASPECT OF LANDFILL Environmental engineers have contributed to the development of engineered landfill site, safe to the environment. The major objective in constructing a safe disposal site is to; i. Construction of liners, floors, walls and covers that adequately limit the spread of pollutants and the infiltration of surface water. ii. Contain, collect and removal of leakage from landfill site iii. Control, collection and removal or utilization of landfill gases iv. Maintenance of landfill stability Monitor and ensure that the necessary long term performance is achieved. The environmental standards were introduced to safeguard human health and to preserve the living environment. Effluent standards were introduced to control the water quality discharged from factories and other private establishments into public water and seepage of water into the ground.
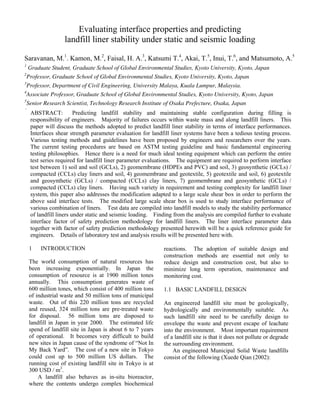
- 3. The guidelines have contributed in developing suitable liners or hydraulic barriers for the landfill site. Early liners consisted primarily of a single liner composed of a clay layer or a synthetic polymeric membrane. During the past few decades the trend is to use composite liner systems comprising both clay and synthetic geomembranes together with interspersed drainage layers. The following is an approximate chronology showing the introduction date for each of these approaches. Pre – 1982 Single clay liner 1982 Single geomembrane liner 1983 Double geomembrane liner 1984 Single composite liner 1985 Double composite liner with primary and secondary leachate collection system Double composite liners with both primary and secondary leachate collection system have been widely adopted in solid waste landfills in the United States. This type of liner system is mandated by Federal and State regulations for hazardous waste, in United States. Figure 1, shows typical details of double composite liner system. Progressively many other countries have impost their own guidelines in bottom composite liners system. Figure 2 shows the various type of bottom lining system used in many countries. Figure 1 : Double Composite Liner System 1.4 GEOTECHNICAL ENGINEERING ASPECT OF LANDFILL Geotechnical aspects of landfill involves the assessment of engineering properties of landfill components and design a stable landfill site against any mode of failure and avoid contamination to environment. Hence parallel to the development of clay liner system, intensive research have been carried out to study the slopes in landfill site for their stability during various kind of exposure to environment changes, internal and external hydraulic condition of landfill site and most importantly seismic stability of landfill. Some recent landfill failures have indicated failures taking place along low friction angle zone between subsoil and geosynthetic or geosynthetic layers, clay liners, landfill cover slopes in static state or under seismic condition. This has lead to various researches to be carried on the shear strength and interface properties of subsoils, clay liners, geosynthetic and waste material. Most of the researches suggest the importance of geotechnical design in a landfill to prevent failures cause by low interface coefficient. Some studies have suggested to use sand clay or bentonite sand mixture with very low hydraulic conductively and improved shear strength properties (Xenxing 2001). Figure 2 : Bottom lining systems used in many countries (Kamon, 2001) Solid Waste Sand protective layer Geotextile filtration layer Geonet drainage layer Primary geomembrane Primary clay liner Geotextile filtration layer Geonet drainage layer Secondary geomembrane Secondary clay liner Subsoil
- 4. The weakest interface identified, is generally lower between a woven geotextile component of geosynthetic clay liner and the adjacent materials (David, 1998). The interface strength may be low in some parts because of bentonite or clay which tends to extrude through the opening in the relatively thin, woven geotextile and then into the interface as the clay liner hydrates. Design engineers are encouraged to consider clay liner with relatively thick, non woven geotextile components in critical situations where high interface shear strength is required. As the interface shear strength are dependent on many factors such as product type, hydration and shearing conditions and the specification of the equipment used to perform the tests (Eric J. Triplett, 2001). Although technical issues associated with internal and interface direct shear testing of clay liner remain, it is gratifying to have documented field data that substantiate the current design process. Hence engineers are required to be careful in not designing slope that exceeds the safe slope angle for the clay liners or their respective interface within the system. For example, an infinite slope consisting of cohesionless interfaces with no seepage, the factor of safety (F) is (David E. Daniel, 1998) : F = tan φ / tan β Where φ = angle of internal friction; β = slope angle Strain incompatibility with Municipal Solid Waste (MSW) could be another cause of stability failures. Example when failure occurs for the first, in the native soil, only a fraction of the MSW peak strength will be mobilized. As progressive failure occurs in the native soil, the peak strength of the MSW would be mobilized at a time when the shear strength of the native soil had declined to a value significantly below peak. This condition takes place cause by stain incompatibility between native soil and MSW. Similar condition is also applied for geosynthetic interface and foundation soils because of their strain incompatibility with the adjacent materials in stability analysis (Hisham 2000). Strain incompatibility could suggest the use of residual shear strength in stability analysis instate of peak shear strength. 2 LANDFILL STABILITY Stability of landfills has been a major concern of the present environmental geotechnical engineering community. Failures at landfill sites can be minor, however the cost of rectification is huge. As landfill sites generally used to contain solid waste of various kinds, which some can contaminate and harm the environment. Hence landfill failures could lead to serious environment pollutions. However, stability is an issue that has be sometimes overlooked for the need of maximization of waste storage per unit area during continuous filling exceeding the initially design. In general majority of landfill sites are overfilled. Cincinnati landfill is an example of failure caused by overfilling and rapid expansion (Timoth, 2000). Koerner and Soong (2000b) presented and analyzed ten large solid waste landfill failures, including Kettleman, Cincinnati and some of the world landfill failures. The ten solid waste failure can be generally characterized into (Wenxing Jian 2001); i. Wide range failure in their geographic distribution ii. Extremely large in volume and lateral movement iii. Rapid and generally unexpected iv. Associated with excessive amounts of liquids (over, under or within the liner system); to the point where liquefication takes place. v. Involving extensive remediation which sometime include insurance and litigation cost Table 2 : Summary of waste failures (Koerner and Soong, 2000) Case History Location Type of Failure Quantity Involved (Unlined Sites) U-1 - 1984 North America Single Rotational 110,000 m3 U-2 - 1989 North America Multiple Rotational 500,000 m3 U-3 - 1993 Europe Translational 470,000 m3 U-4 - 1996 North America Translational 1,100,000 m3 U-5 - 1997 North America Single Rotational 100,000 m3 (Lined Sites) L-1 - 1988 North America Translational 490,000 m3 L-2 - 1994 Europe Translational 60,000 m3 L-3 - 1997 North America Translational 100,000 m3 L-4 - 1997 Africa Translational 300,000 m3 L-5 - 1997 North America Translational 1,200,000 m3
- 5. The failure commonly occurs along liner slope, through landfill foundations, surface side slope and within the waste mass itself. In addition to such failures, failures have also occurred during cell excavation, liner system construction, waste filling and after landfill closure. All of it is a classical geotechnical mode of failure depending upon site specific conditions, the placement and geometry of the waste mass (Xuede Qian, 2003). Potential failure mode include the following ; i. Sliding failure along the leachate collection system ii. Rotational failure along sidewall slope and base iii. Rotational failure through waste, liner and foundation subsoil iv. Rotational failure within the waste mass v. Translational failure by movement along the underlying liner system The failures through liner system beneath the waste mass are common, cause by multiple layer components consist of clay, soils and geosynthetic materials. Double-lined system can consist of as many as 6 to 10 individual components. As such the interfaces resistance of the individual components against shear stress could be low and cause potential failure plane. Figure 3 and 4 shows the type of potential failure along the liner system. Figure 3 : Failure Completely Along (or Within) Liner System (Xuede Qian, 2003) Figure 4 : Failure Along (or Within) Liner System and Solid Waste (Xuede Qian, 2003) The liners and closure cover system of a modern MSW landfill are constructed with layers of material having dissimilar properties, such as compacted clay or geosynthetic clay liner, geomembrane (liquid barrier), geonet (drainage layer), geotextile (filter) and geogrid (reinforcement). Typical detail of such system is shown in Figure 5. While compacted clay or geosynthetic clay and geomembranes function effectively as flow barriers to leachate and infiltration, their interface peak and residual friction angles are lower than those of the soil alone. Such lower friction angle between a geomembrane and other geosynthetics could trigger much rapid failure during seismic loading conditions. The soil-geomembrane interface acts as a possible plane of potential instability of the system under both static and seismic loading (Hoe I. Ling, 1997). Hence environmental geotechnical engineers are very concern about the potential instability caused by the waste containment liner system. Figure 5 : Cross section of typical bottom liner systems (Kamon, 2001) Attention to slope stability of municipal solid waste during static and seismic loading has increased following report of Kettleman Hills waste landfill failure. The cause of failure was due to low friction angle between the soil and geosynthetic or geosynthetic layers in the liner system. Waste Failure Foundation Liner Waste Failure Liner Foundation Leachate Collection Geomembrane Base Soil (a) Single geomembrane liner Leachate Collection Clay Liner Base Soil (b) Single clay liner Leachate Collection Geomembrane Clay Liner Base Soil (c) Single composite liner Leachate Collection Geomembrane Clay Liner Geomembrane Clay Liner Base Soil (d) Double liner
- 6. This failure however was not attributed to seismic loading. Seismic performance of landfills has been reported for the 1989 Loma Prieta Earthquake and the 1994 Northridge Earthquake. Seismic design of landfill systems should include response analysis, liquefaction analysis, deformation analysis and slope stability analysis. Shear failure involving liner system can occur at three possible location : i. The external interface between top of liner system and the overlying material ii. Internally within the liner system iii. Interface between clay liner and geosynthetic layer iv. The external interface between the bottom of the liner system and the underlying subsoil material Current engineering design practice is to establish appropriate internal and interface shear strength parameters for design using direct shear test on test specimens and employing traditional limit equilibrium techniques for analyzing the landfill slope stability (David E. Daniel, 1998). As such simplified Janbu analysis procedure is recommended as it often gives factor of safety that is significantly less than those calculated by Spencer’s procedure (Robert B. Gilbert, 1998). 2 LANDFILL STABILIY RESEARCH The above discussion calls for detail and compressive study of landfill stability on the following : a. Study landfill liner components and their physical properties b. Study the compacted clay liner (CCLs) interface properties with geomembrane and geosynthetic clay liners (GCLs). c. Study the interface properties of compacted clay liners (CCLs) with native soils d. Study the interface properties between CCL, GCL, non woven geotextile and geomembrane. e. Study the suitable configuration of composite liner system which could improve the liner stability without neglecting the hydraulic conductivity requirement f. Conduct detail stability analysis study of various configurations of landfill liner using laboratory data by limit equilibrium method. g. Propose recommendation for landfill stability design and installation guide for landfill liner and landfill cover to improve overall stability of landfill site by providing sufficient strain compatibility within the component members In order to conduct the above said study careful selection of test materials and configuration of liner system were used in the research. 3.1 LANDFILL LINER CONFIGURATION The research approach will be dependent on the configuration and the material used for landfill liner system. Nine type of liner configurations were studied in the research. The configuration consists of two type of single membrane liner and seven type of single composite liner. Details and description of the said liner configuration are listed in Figure 6a to 6k. Figure 6a : Single membrane liner configuration 1 Table 3a : Liner configurations and interface tests for single membrane liner configuration 1 (SMLC 1) Liner Configuration Interface Test Description Test 1A Geotextile & HDPE Type 1 SMLC 1A Test 27A HDPE Type 1 & Native soil Test 2A Geotextile & HDPE Type 2 SMLC 1B Test 28A HDPE Type 2 & Native soil Test 3C Geotextile & PVC (Front Side) SMLC 1C Test 29A PVC (Rear) & Native soil Figure 6b : Single membrane liner configuration 2 Non Woven Geotextile Geomembrane, HDPE Type 1 (smooth surface), HDPE Type 2 (Textured surface) and PVC Native Soil / Highly Decomposed Granite Soil Non Woven Geotextile Geomembrane, HDPE Type 1 (smooth surface), HDPE Type 2 (Textured surface) and PVC Native Soil / Highly Decomposed Granite Soil Non Woven Geotextile
- 7. Table 3b : Liner configurations and interface tests for single membrane liner configuration 2 (SMLC 2) Liner Configuration Interface Test Description Test 1A Geotextile & HDPE Type 1 SMLC 2A Test 26A Geotextile & Native soil Test 2A Geotextile & HDPE Type 2 SMLC 2B Test 26A Geotextile & Native soil Test 3C Geotextile & PVC (Front Side) Test 3A Geotextile & PVC (Rear Side) SMLC 2C Test 26A Geotextile & Native soil Figure 6c : Single composite liner configuration 1 Table 3c : Liner configurations and interface tests for single composite liner configuration 1 (SCLC 1) Liner Configuration Interface Test Description Test 1A Geotextile & HDPE Type 1 Test 13A HDPE Type 1 & Silt Bentonite (100 : 10) SCLC 1A Test 16A Native soil & Silt Bentonite (100 : 10) Test 2A Geotextile & HDPE Type 2 Test 14A HDPE Type 2 & Silt Bentonite (100 : 10) SCLC 1B Test 16A Native soil & Silt Bentonite (100 : 10) Test 3C Geotextile & PVC (Front Side) Test 15A PVC (Rear Side) & Silt Bentonite (100 : 10) SCLC 1C Test 16A Native soil & Silt Bentonite (100 : 10) Test 1A Geotextile & HDPE Type 1 Test 13A HDPE Type 1 & Sand Bentonite (100 : 10) SCLC 1D Test 23A Native soil & Sand Bentonite (100 : 10) Test 2A Geotextile & HDPE Type 2 Test 14A HDPE Type 2 & Sand Bentonite (100 : 10) SCLC 1E Test 23A Native soil & Sand Bentonite (100 : 10) Test 3C Geotextile & PVC (Front Side) Test 15A PVC (Rear Side) & Sand Bentonite (100 : 10) SCLC 1F Test 23A Native soil & Sand Bentonite (100 : 10) Figure 6d : Single composite liner configuration 2 Table 3d : Liner configurations and interface tests for single composite liner configuration 2 (SCLC 2) Liner Configuration Interface Test Description Test 1A Geotextile & HDPE Type 1 Test 6A HDPE Type 1 & GCL Type 1 (Bentonite Side) Test 4C Geotextile & GCL Type 1 (HDPE Side) SCLC 2A Test 26A Geotextile & Native soil Test 2A Geotextile & HDPE Type 2 Test 8A HDPE Type 2 & GCL Type 1 (Bentonite Side) Test 4C Geotextile & GCL Type 1 (HDPE Side) SCLC 2B Test 26A Geotextile & Native soil Test 3C Goetextile & PVC (Front Side) Test 10A PVC (Rear Side) & GCL Type 1 (Bentonite Side) Test 4C Geotextile & GCL Type 1 (HDPE Side) SCLC 2C Test 26A Geotextile & Native soil Figure 6e : Single composite liner configuration 3 Non Woven Geotextile Geomembrane, HDPE Type 1 (smooth surface), HDPE Type 2 (Textured surface) and PVC Silt and Bentonite Mix (10 %) / Sand and Bentonite Mix (10 %) Native Soil / Highly Decomposed Granite Soil Non Woven Geotextile Geomembrane, HDPE Type 1 (smooth surface), HDPE Type 2 (Textured surface) and PVC Bentonite + Adhesive Geomembrane Geosynthetic Clay Liner Type 1 Non Woven Geotextile Non Woven Geotextile Native Soil / Highly Decomposed Granite Soil Geomembrane, HDPE Type 1 (smooth surface), HDPE Type 2 (Textured surface) and PVC Geosynthetic Clay Liner Type 2 Bentonite + Adhesive Non-Woven Geotextile Woven Geotextile Non Woven Geotextile Native Soil / Highly Decomposed Granite Soil Non Woven Geotextile
- 8. Table 3e : Liner configurations and interface tests for single composite liner configuration 3 (SCLC 3) Liner Configuration Interface Test Description Test 1A Geotextile & HDPE Type 1 Test 7A HDPE Type 1 & GCL Type 2 (Non Woven Site) Test 5C Geotextile & GCL Type 2 (Woven Side) SCLC 3A Test 26A Geotextile & Native soil Test 1A Geotextile & HDPE Type 1 Test 7C HDPE Type 1 & GCL Type 2 (Woven Side) Test 5A Geotextile & GCL Type 2 (Non Woven Site) SCLC 3B Test 26A Geotextile & Native soil Test 2A Geotextile & HDPE Type 2 Test 9C HDPE Type 2 & GCL Type 2 (Woven Side) Test 5A Geotextile & GCL Type 2 (Non Woven Site) SCLC 3C Test 26A Geotextile & Native soil Test 2A Geotextile & HDPE Type 2 Test 9A HDPE Type 2 & GCL Type 2 (Non Woven Side) Test 5C Geotextile & GCL Type 2 (Woven Side) SCLC 3D Test 26A Geotextile & Native soil Figure 6f : Single composite liner configuration 4 Table 3f : Liner configurations and interface tests for single composite liner configuration 4 (SCLC 4) Liner Configuration Interface Test Description Test 19A Geotextile & Sand Bentonite (100 : 10) Test 20A HDPE Type 1 & Sand Bentonite (100 : 10) SCLC 4A Test 23A Native soil & Sand Bentonite (100 : 10) Test 19A Geotextile & Sand Bentonite (100 : 10) Test 21A HDPE Type 2 & Sand Bentonite (100 : 10) SCLC 4B Test 23A Native soil & Sand Bentonite (100 : 10) Test 19A Geotextile & Sand Bentonite (100 : 10) Test 22C PVC (Front Side) & Sand Bentonite (100 : 10) Test 22A PVC (Rear Side) & Sand Bentonite (100 : 10) SCLC 4C Test 23A Native soil & Sand Bentonite (100 : 10) Test 19A Geotextile & Sand Bentonite (100 : 10) Test 22A PVC (Rear Side) & Sand Bentonite (100 : 10) Test 22C PVC (Front Side) & Sand Bentonite (100 : 10) SCLC 4D Test 23A Native soil & Sand Bentonite (100 : 10) Figure 6g : Single composite liner configuration 5 Non Woven Geotextile Sand and Bentonite Mix (10 %) Sand and Bentonite Mix (10 %) Geomembrane, HDPE Type 1 (smooth surface), HDPE Type 2 (Textured surface) and PVC Native Soil / Highly Decomposed Granite Soil Geomembrane, HDPE Type 1 (smooth surface), HDPE Type 2 (Textured surface) and PVC Non Woven Geotextile Silt and Bentonite Mix (10 %) / Silt and Bentonite Mix (10 %) / Native Soil / Highly Decomposed Granite Soil
- 9. Table 3g : Liner configurations and interface tests for single composite liner configuration 5 (SCLC 5) Liner Configuration Interface Test Description Test 12A Geotextile & Silt Bentonite (100 : 10) Test 13A HDPE Type 1 & Silt Bentonite (100 : 10) SCLC 5A Test 16A Native soil & Silt Bentonite (100 : 10) Test 12A Geotextile & Silt Bentonite (100 : 10) Test 14A HDPE Type 2 & Silt Bentonite (100 : 10) SCLC 5B Test 16A Native soil & Silt Bentonite (100 : 10) Test 12A Geotextile & Silt Bentonite (100 : 10) Test 15C PVC (Front Side) & Silt Bentonite (100 : 10) Test 15A PVC (Rear Side) & Silt Bentonite (100 : 10) SCLC 5C Test 16A Native soil & Silt Bentonite (100 : 10) Test 12A Geotextile & Silt Bentonite (100 : 10) Test 15A PVC (Rear Side) & Silt Bentonite (100 : 10) Test 15C PVC (Front Side) & Silt Bentonite (100 : 10) SCLC 5D Test 16A Native soil & Silt Bentonite (100 : 10) Figure 6h : Single composite liner configuration 6 Table 3h : Liner configurations and interface tests for single composite liner configuration 6 (SCLC 6) Liner Configuration Interface Test Description Test 12A Geotextile & Silt Bentonite (100 : 10) Test 17A GCL Type 1 (Bentonite Side) & Silt Bentonite (100 : 10) Test 17C GCL Type 1 (HDPE Side) & Silt Bentonite (100 : 10) SCLC 6A Test 16A Native soil & Silt Bentonite (100 : 10) Test 12A Geotextile & Silt Bentonite (100 : 10) Test 17C GCL Type 1 (HDPE Side) & Silt Bentonite (100 : 10) Test 17A GCL Type 1 (Bentonite Side) & Silt Bentonite (100 : 10) SCLC 6B Test 16A Native soil & Silt Bentonite (100 : 10) Figure 6i : Single composite liner configuration 7 Table 3i : Liner configurations and interface tests for single composite liner configuration 7 (SCLC 7) Liner Configuration Interface Test Description Test 12A Geotextile & Silt Bentonite (100 : 10) Test 18A GCL Type 2 (Non Woven Side) & Silt Bentonite (100 : 10) Test 18C GCL Type 2 (Woven Side) & Silt Bentonite (100 : 10) SCLC 7A Test 16A Native soil & Silt Bentonite (100 : 10) Test 12A Geotextile & Silt Bentonite (100 : 10) Test 18C GCL Type 2 (Woven Side) & Silt Bentonite (100 : 10) Test 18A GCL Type 2 (Non Woven Side) & Silt Bentonite (100 : 10) SCLC 7B Test 16A Native soil & Silt Bentonite (100 : 10) Non Woven Geotextile Silt and Bentonite Mix (10 %) / Silt and Bentonite Mix (10 %) / Native Soil / Highly Decomposed Granite Soil Bentonite + Adhesive Geomembrane Geosynthetic Clay Liner Type 1 Non Woven Geotextile Silt and Bentonite Mix (10 %) / Silt and Bentonite Mix (10 %) / Native Soil / Highly Decomposed Granite Soil Geosynthetic Clay Liner Type 2 Bentonite + Adhesive Non-Woven Geotextile Woven Geotextile
- 10. Figure 6j : Single composite liner configuration 8 Table 3j : Liner configurations and interface tests for single composite liner configuration 8 (SCLC 8) Liner Configuration Interface Test Description Test 19A Geotextile & Sand Bentonite (100 : 10) Test 24A GCL Type 1 (Bentonite Side) & Sand Bentonite (100 : 10) Test 24C GCL Type 1 (HDPE Side) & Sand Bentonite (100 : 10) SCLC 8A Test 23A Native soil & Sand Bentonite (100 : 10) Test 19A Geotextile & Sand Bentonite (100 : 10) Test 24C GCL Type 1 (HDPE Side) & Sand Bentonite (100 : 10) Test 24A GCL Type 1 (Bentonite Side) & Sand Bentonite (100 : 10) SCLC 8B Test 23A Native soil & Sand Bentonite (100 : 10) Figure 6k : Single composite liner configuration 9 Table 3k : Liner configurations and interface tests for single composite liner configuration 9 (SCLC 9) Liner Configuration Interface Test Description Test 19A Geotextile & Sand Bentonite (100 : 10) Test 25A GCL Type 2 (Non Woven Side) & Sand Bentonite (100 : 10) Test 25C GCL Type 2 (Woven Side) & Sand Bentonite (100 : 10) SCLC 9A Test 23A Native soil & Sand Bentonite (100 : 10) Test 19A Geotextile & Sand Bentonite (100 : 10) Test 25C GCL Type 2 (Woven Side) & Sand Bentonite (100 : 10) Test 25A GCL Type 2 (Non Woven Side) & Sand Bentonite (100 : 10) SCLC 9B Test 23A Native soil & Sand Bentonite (100 : 10) Figure 7 shows the simplified configuration of interface research listed. Figure 7 : Simplified configuration for interface research The details of selected materials are : i. Mountain sand was used as sand ii. Non Woven Geotextile iii. Geomembrane a. HDPE Geomembrane • Type 1 – Smooth non textured • Type 2 – Textured membrane (blown-film texturing) b. PVC Geomembrane Silt and Bentonite Mix (10 %) / Sand and Bentonite Mix (10 %) Geosynthetic Clay Liner Type 1 and Geosynthetic Clay Liner Type 2 Non Woven Geotextile Geomembrane, HDPE Type 1 (smooth surface), HDPE Type 2 (Textured surface) and PVC Non Woven Geotextile Native Soil / Highly Decomposed Granite Soil Bentonite + Adhesive Non-Woven Geotextile Bentonite + Adhesive Geomembrane Woven Geotextile Non Woven Geotextile Sand and Bentonite Mix (10 %) / Sand and Bentonite Mix (10 %) / Native Soil / Highly Decomposed Granite Soil Geosynthetic Clay Liner Type 2 Bentonite + Adhesive Non-Woven Geotextile Woven Geotextile Non Woven Geotextile Sand and Bentonite Mix (10 %) / Sand and Bentonite Mix (10 %) / Native Soil / Highly Decomposed Granite Soil Bentonite + Adhesive Geomembrane Geosynthetic Clay Liner Type 1
- 11. iv. Clay Liners a. Silt and Bentonite Mix (100 : 10) b. Sand and Bentonite Mix (100 : 10) c. Geosynthetic Clay Liner (GCL) • GCL Type 1 – Adhesive-bond bentonite to geomembrane (wavy textured) • GCL Type 2 – Stitch bonded non woven geotextile and woven geotextile sandwiching bentonite v. Native Soil type - Decomposed granite soil Smooth and textured geomembranes were studied to validate the interface properties due to plowing and frictional contribution of textured surface as compared to smooth surface. Where the measured friction coefficient for smooth particles is relatively low and plowing is not an important contributor. Whereas rougher and more angular particles have relatively larger friction coefficients and plowing is important even at low normal loads. (Joseph E. Dove, 1999). In order to conduct the listed interface tests modifications were made to large scale shear box. The shearing machine was modified to provide maximum normal load of 300 kPa and constant shearing speed of 1 mm/min with maximum shearing displacement of 100mm. Each interface tests were tested for normal loads of 100, 200 and 300 kPa to obtain interface properties. Clamping mechanism was introduced to hold the geosynthetic in place during shearing. Modifications were also done to introduce pore pressure transducers to measure pore pressures during shearing under saturated condition. However this paper discusses test data from as installed condition only. 3 SHEAR BOX MODIFICATION The modifications of large scale shear box for interface shear strength evaluation for landfill liners were developed based on the guideline of i. American Standard – ASTM D3080 – 98 – Standard Test Method for Direct Shear Test of Soils Under Consolidated Drained Conditions. ii. American Standard – ASTM D5321 – 02 – Standard Test Method for Determining the Coefficient of Soil and Geosynthetic or Geosynthetic and Geosynthetic Friction by the Direct Shear Method. iii. American Standard – ASTM D6243 – 98 – Standard Test Method for Determining the Internal and Interface Shear Resistance of Geosynthetic Clay Liner by the Direct Shear Method. As per the ASTM guideline and testing requirement the apparatus design is subdivided into three categories, namely i. Soil and soil internal and interface testing modification to perform test on • Interface shear strength between native soil and compacted clay liners. • Internal shear strength of native soil and compacted clay liners. ii. Geosynthetic and geomembrane interface testing modification to perform test on • Geomembranes and geotextile • Geotextile and geosynthetic clay liners • Geomembranes and geosynthetic clay liners iii. Geosynthetic and soil interface testing modification to perform test on • Geomembranes and native soil / compacted clay liners • Geotextile and native soil / compacted clay liner Following are the design guide adopted to modify the large scale shear box i. Shear box design adopted a. The shear box size shall have minimum size of 300mm x 300mm or 15 times the d85 of the coarse soil sample used, or 5 times the maximum opening size (in plan) of the geosynthetic to be tested. The adopted shear box size was 250mm x 500mm for top box and 300mm x 600mm for bottom box. b. The shear box height shall have a minimum height of 50mm or 6 times the maximum particle size of the coarse soil used. The adopted box height ranges between 75mm for bottom box and 100mm for top box. Bentonite + Adhesive Geomembrane Bentonite + Adhesive Non-Woven Geotextile Woven Geotextile
- 12. c. Test failure is defined as shear stress at 15 % to 20 % of relative lateral displacement. The shear machine was modified to have maximum displacement of 100mm which is 20 % of 500mm of top shear box length. d. The box is required to be made of stainless steel with sufficient thickness to avoid box deformation during loading and shearing. Hence box thickness of 12mm was adopted. e. The top and bottom box opening shall be ½ of d85 or 1mm. ii. Geosynthetic (Geosynthetic Clay Liner, Geotextile and Geomembrane) clamping method adopted a. Flat jaw like clamping device and rough surface were used to grip the geosynthetics b. The gripping jaw and rough surface were firm enough to allow geosynthetic outer surface being sheared while the inner side remained gripped firmly. c. The gripping surface completely transfers the shear stress through the outside surface into the geosynthetic. d. The gripping was modified not to damage the geosynthetic and not to influence the shear strength behavior of the geosynthetic. e. Rough surface was introduced by using high strength double sided tape. The tapes provide strong gripping force without damaging the geosynthetic. f. The rough surface was to simulate frictional resistance from adjacent liner components. g. The failure surface was entirely within the geosynthetic member. h. The geosynthetic was free to displace in the direction of shear allowing geosynthetic to mobilize the tensile forces beyond rough surface resistance. iii. Shearing Process adopted a. The shearing machine was required to have displacement rate of 0.025mm/min to 6.35mm/min however the machine was tuned to adopt constant displacement rate of 1mm/min. Displacement rate have relatively small effect on measured shear strength, (Patrick J. Fox, 1998). b. The normal loading was applied using air bag system within a fix frame. Due to this vertical displacements were restricted from taking place. c. The load cell or proving ring have an accuracy of 2.5N to record and monitor shearing forces. d. Horizontal displacement measuring device has an accuracy of 0.02mm with maximum displacement of 110mm. e. LVDT – Linear Variable Differential Transformer was used to measure displacements. The above listed was the summary of interface and internal shear strength test requirement and modification adopted base on the guideline in , ASTM D3080-98, ASTM D5321-02 and ASTM D6343-98. With such stringent guide and testing complexity, much attention was paid to modify the conventional shear box to meet the standard guideline. The shear box was also modified to record pore pressure readings under saturated condition. However data were not presented herewith as the research is in progress. Figures 8a, b, c, 9a, b, c and 10a, b, c shows some of the typical modifications of large scale shear box adopted for the research work for three different test conditions. Namely i) Case 1 – Interface testing between geosynthetic and geosynthetic, ii) Case 2 - Interface testing between geosynthetic and soil, and iii) Case 3 - Interface testing between soil and soil. Bottom shear box size of 350 x 600mm and the top box size of 250 x 500mm were used for the test. Larger 100mm bottom box in shearing direction was used to define test failure of 15 % to 20% to relative lateral displacement of the top box dimension. The larger sides were adopted in order to provide additional rough surface for gripping forces on to geosynthetic during shearing. The shearing surface contact areas were made same for both top and bottom box of 250 x 500mm in size allowing control and specific shearing area with reduction in contact area during shearing. Height adjustable bottom box base plate with spacer blocks were introduced to cater for variation in sample thickness and allowance for settlement or sample deformation during normal loading prior to shearing. The spacer blocks minimize plowing kind of effect during shearing process, occurring when two different material hardness are in contact and sheared. Due to area reduction during shearing, area correction method was adopted to obtain shear stresses. Constant shearing speed of 1 mm/min was
- 13. used for test normal loads of 100, 200 and 300 kPa for the interface tests. Fig. 8a : Case 1 – Modification adopted for geosynthetic and geosynthetic testing – Plan view Fig. 8b : Case 1 – Modification adopted for geosynthetic and geosynthetic testing – Section X-X Fig. 8c : Case 1 – Modification adopted for geosynthetic and geosynthetic testing – Section Y-Y Fig. 9a : Case 2 – Modification adopted for geosynthetic and soil testing – Plan view Fig. 9b : Case 2 – Modification adopted for geosynthetic and soil testing – Section X-X Fig. 9c : Case 2 – Modification adopted for geosynthetic and soil testing – Section Y-Y
- 14. Fig. 10a : Case 3 – Modification adopted for soil and soil testing – Plan view Fig. 10b : Case 3 – Modification adopted for soil and soil testing – Section X-X Fig. 10c : Case 3 – Modification adopted for soil and soil testing – Section Y-Y 4 TEST MATERIAL PHYSICAL PROPERTIES The selected properties are tested for their basic physical properties such as tensile strength, elongation, cohesion, friction, permeability, etc. Details of material properties are presented as follows. 1. Geosynthetics comprise of non woven geotextile, HDPE Type 1 (smooth surface), HDPE Type 2 (textured surface) and PVC geomembranes. Table 4 : Summary of geosynthetic physical properties Description Geotextile PVC HDPE – Type 1 and 2 Thickness 10mm 1.5 mm 1.5 mm Tensile strength 160 N/cm (Weft) 80 N/cm (Wrap) 300 N/cm both Weft and Wrap 544 N / cm both Weft and Wrap Elongation at break 70 N/cm (Weft) 55 N/cm (Wrap) 320 % both Weft and Wrap 790 % both Weft and Wrap The details of tensile strength test results are presented in figures 11a and 11b for both warp and weft direction respectively for geosynthetics. Displacement (mm) 0 100 200 300 400 Load (N) 0 100 200 300 400 PVC Geotextile HDPE Type 1 HDPE Type 2 Figure 11a : Geosynthetic tensile strength plot on warp direction
- 15. Displacement (mm) 0 100 200 300 400 Load (N) 0 200 400 600 800 Geotextile PVC HDPE Type 1 HDPE Type 2 Figure 11b : Geosynthetic tensile strength plot on weft direction 2. Geosynthetic Clay Liners comprise of 1) type 1 – adhesive bond bentonite to geomembrane and 2) type 2 – stitch bonded non woven goetextile and woven goetextile sandwiching bentonite. Table 5 : Summary of Geosynthetic Clay Liner (GCL) physical properties Description GCL Type 1 GCL Type 2 Composite of GCL Type 2 Thickness - Bentonite - HDPE - Non Woven geotextile - Woven geotextile ?? mm ?? mm ?? mm ?? mm ?? mm ?? mm Tensile strength - HDPE - Non Woven geotextile - Woven geotextile ?? N/cm ?? N/cm ?? N/cm ?? N/cm Elongation at break - HDPE - Non Woven geotextile - Woven geotextile ?? % ?? % ?? % ?? % 3. Compacted Clay Liners comprise of 1) silt bentonite mixture of 100 to 10 percent ratio and 2) sand bentonite mixture of 100 to 10 percent ratio. Native soil was from highly weathered granitic soil origin. Table 6 : Summary of CCLs and native soil properties TEST USING CASAGRANDE SAND BENTONITE (100 : 10) SILT BENTONITE (100 : 10) GRANITIC SOIL Liquid limit, LL ,wL % 47 69 - Plastic limit, PL, wP % 23 35 - Plasticity Index,PI, Ip 23 34 - Average Particle Density, ρs Mg / m3 2.60 2.64 2.59 Dry Density, ρd Mg / m3 1.9 1.68 2.06 Optimum Moisture Content, Mc % 10.5 17.5 9 Classification CL / OL ORGANIC SILT OR CLAY OF LOW PLASTICITY CH / OH CLAY HIGH PLASTICITY HIGHLY WEATHERED GRANITIC SOIL SHEAR BOX TEST RESULTS CU kPa 77.0 43.1 31.4 FiU o 34.3 35.8 45.5 CIU TEST RESULTS C’ kPa Fi’ o Permeability Shear box tests were done using small shear box of 60mm x 60mm with constant shearing speed of 1 mm/ min. The results represent total cohesion and friction parameters. Sand and silt mixed with bentonite shows similar friction, however sand mixture had higher cohesion contribution. As for granitic soil the contribution of both cohesion and frictional were sufficient to provide strong founding base. With the parameters obtained probability of internal failures of sand or silt bentonite mixture are less as compared to probability of interface failures within liner configurations. Normal Stress, σn (kN/m 2 ) 0 100 200 300 400 Shear Stress, τ p (kN/m 2 ) 0 100 200 300 400 Silt Bentonite τ p = 43.1 + σn tan (35.8) Sand Bentonite τ p = 77.0 + σn tan (34.3) Native Soil τ p = 31.4 + σn tan (45.5) Figure 12 : Summary total shear stress parameters for internal failures of compacted clay liners and base material.
- 16. Figure 13 : Summary of classification plot Moisture Content (%) 0 5 10 15 20 25 30 Dry Density (Mg/m 3 ) 1.2 1.4 1.6 1.8 2.0 2.2 2.4 1.68 1.90 2.06 9 10.5 17.5 Granitic Soil Silt Bentonite Sand Bentonite Figure 14 : Optimum dry density plot Soil classification and dry density plots are shown in Figure 13 and 14 respectively. Silt bentonite mixture require optimum moisture content of 17.5 percent as compared to 10.5 and 9 percent for sand bentonite and native soil respectively to achieve maximum dry density. The compacting test was done using 4.5 kg, drop hammer. as per BS 1377 : Part 4 : 1990. 3.3/3.4/3.5/3.6. For shear box compaction, hand held electric vibrating compaction machine was used with base size of 250 x 150 mm. Careful calibration was done to obtain optimum compaction time required to achieve minimum compaction density of 90 percent for soil samples placed in the shear box. Five layer compaction with minimum 12 minutes compaction time per layer, was adopted to compact the soil samples into shear boxes. Figures 15 a, b, 16 a, b and 17 a, b shows the plot of moisture content, dry and bulk density and relative compaction density obtained for all interface tests carried out. Figure 15a : Sample moisture content before and after test for Silt Bentonite mixture (100 : 10) Figure 15b : Sample compacted bulk, dry density and compaction relative density for Silt Bentonite mixture (100 : 10) Figure 16a : Sample moisture content before and after test for Sand Bentonite mixture (100 : 10) 0 MOISTURE CONTENT AFTER TEST (%) 8 9 10 11 12 13 1 (Avg M 1 (MC b (Avg TEST NORMAL STRESS, σn (kN/m 2 ) 0 100 200 300 400 MOISTURE CONTENT AFTER TEST (%) 8 9 10 11 12 13 11.3 (Avg MC after test) 11.6 (MC before test) 10.5 (OMC) INITIAL MOISTURE CONTENT (%) 0 1 2 3 4 5 1.41 (Mean Initial MC) TEST NORMAL STRESS, σn (kN/m 2 ) 0 100 200 300 400 MOISTURE CONTENT AFTER TEST (%) 14 15 16 17 18 19 20 18.1 (Avg MC after test) 18.4 (MC before test) 17.5 (OMC) INITIAL MOISTURE CONTENT (%) 0.5 1.0 1.5 2.0 2.5 3.0 1.14 (Mean Initial MC) TEST NORMAL STRESS, σn (kN/m 2 ) 0 100 200 300 400 COMPACTED BULK & DRY DENSITY, (Mg/m 3 ) 1.4 1.6 1.8 2.0 2.2 2.4 1.68 (DD of Sample) 1.52 (Avg DD) RELATIVE COMPACTED DENSITY, % (Mg/m 3 ) 60 70 80 90 100 90 % (CD) 90.5 (Avg CD) 1.97 (BD of Sample) 1.80 (Avg BD)
- 17. Figure 16b : Sample compacted bulk, dry density and compaction relative density for Sand Bentonite mixture (100 : 10) Figure 17a : Sample moisture content before and after test for Native soil Figure 17b : Sample compacted bulk, dry density and compaction relative density for Native soil 5 INTERFACE TEST RESULTS In order to obtain much clear understanding of interface test results, the test data are grouped into 8 categories. The categories were made by grouping one single member interfacing with others. The categories are i. Geotextile interfacing with geomembrane, namely HDPE Type 1 and 2, PVC and GCLs Type 1 and 2 ii. HDPE Type 1 and 2 interfacing with PVC and GCLs Type 1 and 2 iii. PVC interfacing with GCLs Type 1 and 2 iv. Geosynthetic interfacing with CCLs – Silt Bentonite (100 : 10) v. GCLs interfacing with CCLs – Silt Bentonite (100 : 10) vi. Geosynthetic interfacing with CCLs – Sand Bentonite (100 : 10) vii. GCLs interfacing with CCLs – Sand Bentonite (100 : 10) viii. Geosynthetic interfacing with Native Soil (Highly weathered granitic soil) The above interface test results indicate the presents of strain incompatibility between test members. The peak shear stresses were reached between 2 to 15 % strain. Hence the selections of peak stresses were limited to maximum stresses reached within 8% strain. Peak shear stresses were plotted with normal stresses to obtain peak failure envelope. Best fit liner plots were adopted in order to obtain total cohesion and total interface friction angle. The shear stress intersections were set to be either through axis or positive cohesion. 5.1 Geotextile interfacing with geomembrane and GCLs Using peak shear stresses geotextile interfacing with PVC and GCL Type 1 , bentonite side found to have high cohesion and frictional resistance. This could be due to plowing kind of effects created during shearing. The performance of HDPE was dominated by textured surface HDPE as predicted. The weakest is between geotextile and geotextile from GCL Type 2 and HDPE Type 1. Details of test results are presented in Table 7 and Figures 18a to 18i respectively. TEST NORMAL STRESS, σn (kN/m 2 ) 0 100 200 300 400 MOISTURE CONTENT AFTER TEST (%) 7 8 9 10 11 9.7 (Avg MC after test) 10.1 (Avg MC before test) 9 (OMC) INITIAL MOISTURE CONTENT (%) 0.5 1.0 1.5 2.0 2.5 3.0 1.2 (Mean Initial MC) TEST NORMAL STRESS, σn (kN/m 2 ) 0 100 200 300 400 COMPACTED BULK & DRY DENSITY, (Mg/m 3 ) 1.8 2.0 2.2 2.4 2.6 2.06 (DD of Sample) 1.89 (Avg DD) RELATIVE COMPACTED DENSITY, % (Mg/m 3 ) 60 70 80 90 100 90 % (CD) 91.9 (Avg CD) 2.24 (BD of Sample) 2.08 (Avg BD) TEST NORMAL STRESS, σn (kN/m 2 ) 0 100 200 300 400 COMPACTED BULK & DRY DENSITY, (Mg/m 3 ) 1.6 1.8 2.0 2.2 2.4 2.6 1.81 (DD of Sample) 1.74 (Avg DD) RELATIVE COMPACTED DENSITY, % (Mg/m 3 ) 70 75 80 85 90 95 100 90 % (CD) 91.7 (Mean CD) 2.10 (BD of Sample) 1.93 (Avg BD)
- 18. Table 7 : Test results of geotextile interfacing with geomembrane Figure 18a : Summary of peak failure envelopes for geotextile interfacing with geomembrane. For geotextile and HDPE type 1 interface, the peak shear stresses were reached within strain of 1 to 1.5 % . Beyond peak stresses constant reduction in shear stresses were observed before constant increment in shear stresses in residual region. Continuous increments in shear stresses were observed beyond 10% strain in the residual region. The rate of residual shear stresses increment was relatively minor for lower normal stresses as compared to higher normal stresses. Hence in the case of geotextile and HDPE type 1 interface the residual shear stress increases gradually for lower normal stresses and increases rapidly for higher normal stresses beyond strain of 10%. No plowing kind of effects was observed in the test. Surface deformation was observed on HDPE type 1, where wavy stress marks were observed on the smooth HDPE surface. Higher concentrations of wavy stress marks were observed as the normal loads are increased. These wavy formations believed to be cause of increase in shear stresses in the residual region. Figure 18b shows the shear stress plots for interface test between geotextile and HDPE type 1 – Test 1A. Strain (%) 0 5 10 15 20 Shear Stress, τ (kN/m 2 ) 0 10 20 30 40 50 σn = 300 (kN/m2) σn = 200 (kN/m2) σn = 100 (kN/m2) Figure 18b : Test 1A - Geotextile and HDPE Type 1, Shear Stress, τ (kN/m2 ) Vs Strain (%) In the case of geotextile and HDPE type 2 interface peak shear stresses were reached within strain of 4 to 5%. Continuous reduction in shear stresses were observed beyond peak , in the residual region unlike in the case of HDPE type 1. In all normal stresses there were pre peaks or slippage and minor plowing taking place before peak stresses. These indicate the shearing off HDPE texture with strain, losing the initial gripping forces between geotextile and HDPE Type 2. Internal failure of geotextile also took place, causing the geotextile split into two at centre. Figure 18c shows the shear stress plots for interface test between geotextile and HDPE type 2 – Test 2A. Strain (%) 0 5 10 15 20 Shear Stress, τ (kN/m 2 ) 0 20 40 60 80 100 120 140 σn = 300 (kN/m2) σn = 200 (kN/m2) σn = 100 (kN/m2) Figure 18c : Test 2A - Geotextile and HDPE Type 2, Shear Stress, τ (kN/m2 ) Vs Strain (%) NORMAL STRESS, σn (kN/m2 ) 0 100 200 300 400 SHEAR STRESS, τ p (kN/m 2 ) 0 100 200 300 400 Test 1A, τp = σn tan (7.6) Test 2A, τp = 3.2 + σn tan (21.1) Test 3A, τp = 11.1 + σn tan (18.7) Test 3C, τp = 25.7 + σn tan (17.1) Test 4A, τp = 12.1 + σn tan (17.1) Test 4C, τp = σn tan (21.8) Test 5A, τp = 1.5 + σn tan (15.1) Test 5C, τp = 10.5 + σn tan (14.8)
- 19. Peak shear stresses were reached within strain of 4 to 6% for the case of geotextile and PVC (rear side) interface. The irregular trend of graphs was due to plowing effect during shearing. PVC was stretched about 5 to 25mm depending on normal stresses. Wavy formations were observed on PVC surfaces and internal failures of geotextile took place. These were due to cohesive forces between geotextile and PVC (rear side). Continuous increment in shear stresses was observed beyond 8% strain in the residual region. In all normal stresses there were pre peaks or slippage and minor plowing taking place before peak stresses. These indicate the loss of initial cohesive forces between geotextile and PVC (rear side). Figure 18d shows the shear stress plots for interface test between geotextile and PVC (rear side) – Test 3A. Strain (%) 0 5 10 15 20 Shear Stress, τ (kN/m 2 ) 0 20 40 60 80 100 120 140 σn = 200 (kN/m2) σn = 100 (kN/m2) σn = 300 (kN/m2) Figure 18d : Test 3A - Geotextile and PVC (rear side), Shear Stress, τ (kN/m2 ) Vs Strain (%) Peak shear stresses were reached within strain of 4 to 7% for the case of geotextile and PVC (front side) interface. The irregular trend of graphs was due to plowing effect during shearing. However unlike in the case of 3A, plowing effects were not observed in the residual region for high normal loads. PVC was stretched about 5 to 30mm depending on normal stresses. Wavy formations were observed on PVC surfaces and only partial internal failures of geotextile took place. Continuous increment in shear stresses was observed beyond 8% strain in the residual region for low normal stress.. In the case of higher normal stresses (200 and 300 kPa) reduction in residual shear stresses were observed in the residual region. In all normal stresses there were pre peaks or slippage and minor plowing taking place before peak stresses. These indicate the loss of initial cohesive forces between geotextile and PVC (front side). Figure 18e shows the shear stress plots for interface test between geotextile and PVC (front side) – Test 3C. Strain (%) 0 5 10 15 20 Shear Stress, τ (kN/m 2 ) 0 20 40 60 80 100 120 140 σn = 300 (kN/m2) σn = 200 (kN/m2) σn = 100 (kN/m2) Figure 18e : Test 3C - Geotextile and PVC (front side), Shear Stress, τ (kN/m2 ) Vs Strain (%) In the case of geotextile and GCL Type 1 (Bentonite side) interface peak shear stresses were reached within strain of 4 to 6%. Shear stresses consistently reduce with strain beyond peak stresses. This could be due sliding within geotextile layer after internal failure of geotextile. Minor plowing force was observed between geotextile and GCL type 1 before peak forces were reached. In all normal stresses there were pre peaks or slippage and minor plowing taking place before peak stresses. These indicate the internal failure of geotextile and bentonite adhesive failure taking place. Figure 18f shows the shear stress plots for interface test between geotextile and GCL Type 1 (Bentonite side) – Test 4A. Strain (%) 0 5 10 15 20 Shear Stress, τ (kN/m 2 ) 0 20 40 60 80 100 120 σn = 300 (kN/m2) σn = 200 (kN/m2) σn = 100 (kN/m2) Figure 18f : Test 4A - Geotextile and GCL Type 1 (Bentonite side), Shear Stress, τ (kN/m2 ) Vs Strain (%)
- 20. Peak shear stresses were reached within strain of 4 to 6%. Shear stresses consistently reduce with strain beyond peak stresses. This could be due sliding between geotextile and HDPE of GCL. Plowing force was observed between geotextile and HDPE of GCL before peak forces were reached. In all normal stresses there were pre peaks or slippage and minor plowing taking place before peak stresses. Geotextiles were not ripped apart in these tests, however internal failures do took place. Figure 18g shows the shear stress plots for interface test between geotextile and GCL Type 1 (HDPE side) – Test 4C. Strain (%) 0 5 10 15 20 Shear Stress, τ (kN/m 2 ) 0 20 40 60 80 100 120 140 σn = 300 (kN/m2) σn = 200 (kN/m2) σn = 100 (kN/m2) Figure 18g : Test 4C - Geotextile and GCL Type 1 (HDPE side), Shear Stress, τ (kN/m2 ) Vs Strain (%) Peak shear stresses were reached within strain of 4 to 5%. Shear stresses consistently reduce with strain beyond peak stresses and maintained constant residual shear stresses. Minor plowing force was observed between geotextile and woven geotextile of GCL Type 2 before peak forces were reached. In all normal stresses there were pre peaks or slippage and minor plowing taking place before peak stresses. Both geotextiles were not ripped apart in these tests. Figure 18h shows the shear stress plots for interface test between geotextile and GCL Type 2 (Woven side) – Test 5A. Strain (%) 0 5 10 15 20 Shear Stress, τ (kN/m 2 ) 0 20 40 60 80 100 σn = 300 (kN/m2) σn = 200 (kN/m2) σn = 100 (kN/m2) Figure 18h Test 5AC - Geotextile and GCL Type 2 (Woven side), Shear Stress, τ (kN/m2 ) Vs Strain (%). In the case of geotextile and GCL Type 2 (Non woven geotextile side) interface peak shear stresses were reached within strain of 4 to 5%. Shear stresses consistently reduce with strain beyond peak stresses and maintained constant residual shear stresses. Minor plowing force was observed between geotextile and non woven geotextile of GCL Type 2 before peak forces were reached. In all normal stresses there were pre peaks or slippage and minor plowing taking place before peak stresses. Residual shear stresses remain constant beyong 12% strain. Both geotextiles were not ripped apart in these tests. Figure 18i shows the shear stress plots for interface test between geotextile and GCL Type 2 (Non woven side) – Test 5C. Strain (%) 0 5 10 15 20 Shear Stress, τ (kN/m 2 ) 0 20 40 60 80 100 120 σn = 300 (kN/m2) σn = 200 (kN/m2) σn = 100 (kN/m2) Figure 18i : Test 5C - Geotextile and GCL Type 2 (Non woven side), Shear Stress, τ (kN/m2 ) Vs Strain (%)
- 21. To conclude the performance of geotextile with geomembrane and GCLs, in all cases expect HDPE type 1, plowing or slippage occurred before peak stresses. In some cases the geotextiles were ripped apart with internal failures. 5.2 HDPE Type 1 and 2 interfacing with GCLs The performances of HDPEs were clearly distinguished between the case of smooth and textured surface. The fictional contribution of smooth surface HDPE was between 7 to 9 degree. The textured surface of HDPE contributes frictional resistance in the range of 19 to 26 degree with increment of 200 to 300 percent. Details of the test results are presented in Table 8 and Figure 19a to 19i respectively. Table 8 : Test results of HDPE Type 1 and 2 interfacing with GCLs Figure 19a : Summary of peak failure envelopes for HDPE Type 1 and 2 interfacing with GCLs. In the case of interface between HDPE type 1 and GCL type 1 (Bentonite side), the peak shear stresses were reached within strain of 2 to 2.5%. Shear stresses were maintained constantly in the residual region. No plowing kind of forces was observed, only minor slippage during shearing before peak stresses. The GCL bentonite was intact, no bentonite adhesive failure took place. Figure 19b shows the shear stress plots for interface test between HDPE type 1 and GCL type 1 (Bentonite side) – Test 6A Strain (%) 0 5 10 15 20 Shear Stress, τ (kN/m 2 ) 0 10 20 30 40 50 60 σn = 300 (kN/m2) σn = 200 (kN/m2) σn = 100 (kN/m2) Figure 19b : Test 6A – HDPE Type 1 and GCL Type 1 (Bentonite side), Shear Stress, τ (kN/m2 ) Vs Strain (%) Peak shear stresses were reached within strain of 1 to 2.5%. Shear stresses beyond peak were maintained constant with minor increment in the residual region. No plowing force was observed between HDPE Type 1 and GCL Type 1 (HDPE side) before peak forces were reached. Both HDPE surface were in good condition. Figure 19c shows the shear stress plots for interface test between HDPE Type 1 and GCL Type 1 (HDPE side) – Test 6C. Strain (%) 0 5 10 15 20 Shear Stress, τ (kN/m 2 ) 0 20 40 60 80 σn = 300 (kN/m2) σn = 200 (kN/m2) σn = 100 (kN/m2) Figure 19c : Test 6C – HDPE Type 1 and GCL Type 1 (HDPE side), Shear Stress, τ (kN/m2 ) Vs Strain (%) NORMAL STRESS, σn (kN/m2 ) 0 100 200 300 400 SHEAR STRESS, τ p (kN/m 2 ) 0 100 200 300 400 Test 6A, τp = σn tan (9.1) Test 6C, τp = 2.2 + σn tan (8.9) Test 7A, τp = 2.2 + σn tan (7.8) Test 7C, τp = 2.4 + σn tan (9.3) Test 8A, τp = 28.8 + σn tan (19.0) Test 8C, τp = σn tan (19.9) Test 9A, τp = 10.2 + σn tan (25.7) Test 9C, τp = 2.1 + σn tan (23.2)
- 22. For HDPE type 1 and GCL type 2 (non woven side) interface, the peak shear stresses were reached within strain of 1.5 to 2.5 %. Beyond peak stresses constant reduction in shear stresses were observed before minor increment in shear stresses in residual region. Continuous increment in shear stresses was observed beyond 10% strain in the residual region. The rate of residual shear stresses increment was relatively consistent for all normal stresses. Figure 19d shows the shear stress plots for interface test between HDPE type 1 and GCL type 2 (non woven side) – Test 7A. Strain (%) 0 5 10 15 20 Shear Stress, τ (kN/m 2 ) 0 10 20 30 40 50 60 σn = 300 (kN/m2) σn = 200 (kN/m2) σn = 100 (kN/m2) Figure 19d : Test 7A – HDPE Type 1 and GCL Type 2 (non woven side), Shear Stress, τ (kN/m2 ) Vs Strain (%) Peak shear stresses were reached within strain of 1 to 2 %. Shear stresses beyond peak were maintained constant in the residual region. No plowing force was observed between HDPE Type 1 and GCL Type 2 (woven side) before peak forces were reached. Both HDPE and woven geotextile surface were in good condition. Minor plowing or slippage occurred before peak shear stresses. Figure 19e shows the shear stress plots for interface test between HDPE Type 1 and GCL Type 2 (woven side) – Test 7C Strain (%) 0 5 10 15 20 Shear Stress, τ (kN/m 2 ) 0 20 40 60 80 σn = 300 (kN/m2) σn = 200 (kN/m2) σn = 100 (kN/m2) Figure 19e : Test 7C – HDPE Type 1 and GCL Type 2 (woven side), Shear Stress, τ (kN/m2 ) Vs Strain (%) For HDPE type 2 and GCL type 1 (bentonite side) interface, the peak shear stresses were reached within strain of 3 to 5 %. Beyond peak stresses constant reduction in shear stresses were observed before minor increment in shear stresses in residual region. In the case of lower normal stresses (100 kPa), the residual shear stress was maintain constant. The rate of residual shear stresses increment was relatively consistent for 200 and 300 kPa normal stresses. In all normal stresses there were pre peaks or slippage and minor plowing taking place before peak stresses. These indicate the failure of bentonite adhesive failure taking place. Minor ripping of bentonite was observed for 100 kPa normal stress and total ripped off of bentonite was observed for 300 kPa normal stress. Figure 19f shows the shear stress plots for interface test between HDPE type 2 and GCL type 1 (bentonite side) – Test 8A. Strain (%) 0 5 10 15 20 Shear Stress, τ (kN/m 2 ) 0 20 40 60 80 100 120 140 160 σn = 300 (kN/m2) σn = 200 (kN/m2) σn = 100 (kN/m2) Figure 19f : Test 8A – HDPE Type 2 and GCL Type 1 (bentonite side), Shear Stress, τ (kN/m2 ) Vs Strain (%)
- 23. Peak shear stresses were reached within strain of 4 to 5 %. Shear stresses beyond peak, consistently reduced before remaining constant in the residual region. No plowing force was observed between HDPE Type 2 and GCL Type 1 (HDPE side) before peak forces was reached. HDPE type 2 textured surfaces were shear between 20 to 70% depending on the normal stresses. Minor smoothening took place on GCL type 1 (HDPE side). GCL type 1 (HDPE side) texture is much harder than HDPE type 2 texture. Figure 19g shows the shear stress plots for interface test between HDPE Type 2 and GCL Type 1 (HDPE side) – Test 8C Strain (%) 0 5 10 15 20 Shear Stress, τ (kN/m 2 ) 0 20 40 60 80 100 120 140 σn = 300 (kN/m2) σn = 200 (kN/m2) σn = 100 (kN/m2) Figure 19g : Test 8C – HDPE Type 2 and GCL Type 1 (HDPE side), Shear Stress, τ (kN/m2 ) Vs Strain (%) For HDPE type 2 and GCL type 2 (non woven side) interface, the peak shear stresses were reached within strain of 4 to 6 %. Beyond peak stresses constant reduction in shear stresses were observed and maintained constant in the residual region. In the case of lower normal stresses (100 and 200 kPa), the residual shear stresses were maintain constant. As for the 300 kPa normal stress the wavy formation in residual region was due to tension failure of geotextiles. Both non woven and woven geotextile of GCls were torn. The surface of textured HDPE was not damaged. In all normal stresses there were pre peaks or slippage and minor plowing taking place before peak stresses. Figure 19h shows the shear stress plots for interface test between HDPE type 2 and GCL type 2 (non woven side) – Test 9A. Strain (%) 0 5 10 15 20 Shear Stress, τ (kN/m 2 ) 0 20 40 60 80 100 120 140 160 180 σn = 300 (kN/m2) σn = 200 (kN/m2) σn = 100 (kN/m2) Figure 19h : Test 9A – HDPE Type 2 and GCL Type 2 (non woven side), Shear Stress, τ (kN/m2 ) Vs Strain (%) In the case of HDPE type 2 and GCL type 2 (woven side) interfaces, the peak shear stresses were reached within strain of 3 to 5 %. Beyond peak stresses constant reduction in shear stresses were observed and maintained constant in the residual region. In the case of lower normal stresses (100 and 200 kPa), the residual shear stresses were maintain constant. As for the 300 kPa normal stress the wavy formation in residual region was due to tension failure of geotextiles. Only woven geotextile of GCl was torn. The surface of textured HDPEs was sheared from partially to fully sheared surface. In all normal stresses there were no pre peaks, slippage or plowing taking place before peak stresses. Figure 19i shows the shear stress plots for interface test between HDPE type 2 and GCL type 2 (woven side) – Test 9C. Strain (%) 0 5 10 15 20 Shear Stress, τ (kN/m 2 ) 0 20 40 60 80 100 120 140 160 180 σn = 300 (kN/m2) σn = 200 (kN/m2) σn = 100 (kN/m2) Figure 19i : Test 9C – HDPE Type 2 and GCL Type 2 (woven side), Shear Stress, τ (kN/m2 ) Vs Strain (%)
- 24. 5.3 PVC interfacing with GCLs The performances of PVC with GCLs were relatively consistent with interface test results were within a narrow range of differences. The fictional contribution of PVC is between 15 to 18 degree, while cohesions were in the range of 10 to 24 kN/m2 . The performance of woven geotextile is much higher in term of frictional resistance as compared to non woven geotextils of the GCL type 2. Details of the test results are presented in Table 9 and Figure 20a to 20f respectively. Table 9 : Test results of PVC interfacing with GCLs Figure 20a : Summary of peak failure envelopes for PVC interfacing with GCLs For PVC (rear side) and GCL type 1 (bentonite side) interface, the peak shear stresses were reached within strain of 2 to 4 %. Adhesive failure of bentonite took place however it was not total failure. Continuous increment in shear stresses was observed beyond 6 % strain. The increment could be due to strong cohesive forces between PVC (rear side) and GCL type 1 (bentonite side). The sudden drop in shear stresses for normal loads of 200 and 300 kPa was due to adhesive failure of bentonite. In all normal stresses there were pre peaks or slippage and minor plowing taking place before peak stresses. Figure 20b shows the shear stress plots for interface test between PVC (rear side) and GCL type 1 (bentonite side) – Test 10A Strain (%) 0 5 10 15 20 Shear Stress, τ (kN/m 2 ) 0 20 40 60 80 100 120 140 160 σn = 300 (kN/m2) σn = 200 (kN/m2) σn = 100 (kN/m2) Figure 20b : Test 10A – PVC (rear side) and GCL Type 1 (bentonite side), Shear Stress, τ (kN/m2 ) Vs Strain (%) TEST 10C - PVC (Rear Side) & GCL TYPE 1 (HDPE Side) SHEAR STRESS, t (kN/m2) Vrs STRAIN (%) Strain (%) 0 5 10 15 20 Shear Stress, τ (kN/m 2 ) 0 20 40 60 80 100 120 140 160 σn = 300 (kN/m2) σn = 200 (kN/m2) σn = 100 (kN/m2) NORMAL STRESS, σn (kN/m2 ) 0 100 200 300 400 SHEAR STRESS, τ p (kN/m 2 ) 0 100 200 300 400 Test 10A, τp = 17.6 + σn tan (18.1) Test 10C, tp = 12.1 + sn tan (20.0) Test 10E, tp = sn tan (26.3) Test 10G, tp = sn tan (25.2) Test 11A, tp = 17.2 + sn tan (15.3) Test 11C, tp = 14.7 + sn tan (18.1) Test 11E, tp = 10.0 + sn tan (17.4) Test 11G, tp = 24.0 + sn tan (18.4)
- 25. Strain (%) 0 5 10 15 20 25 Shear Stress, τ (kN/m 2 ) 0 20 40 60 80 100 120 140 160 180 σn = 300 (kN/m2) σn = 200 (kN/m2) σn = 100 (kN/m2) TEST 10E - PVC (Front Side) & GCL TYPE 1 (Bentonite Side) SHEAR STRESS, t (kN/m2) Vrs STRAIN (%) Strain (%) 0 5 10 15 20 25 Shear Stress, τ (kN/m 2 ) 0 20 40 60 80 100 120 140 160 180 σn = 300 (kN/m2) σn = 200 (kN/m2) σn = 100 (kN/m2) TEST 10G - PVC (Front Side) & GCL TYPE 1 (HDPE Side) SHEAR STRESS, t (kN/m2) Vrs STRAIN (%) In the case of PVC (rear side) and GCL type 2 (non woven side) interfaces, the peak shear stresses were reached within strain of 4 to 6 %. Beyond peak stresses the residual shear stresses were maintain constant. The geotextiles were not torn during the test. In all normal stresses there were pre peaks or slippage and minor plowing taking place before peak stresses. Figure 20c shows the shear stress plots for interface test between PVC (rear side) and GCL type 2 (non woven side) – Test 11A. Strain (%) 0 5 10 15 20 Shear Stress, τ (kN/m 2 ) 0 20 40 60 80 100 120 140 σn = 300 (kN/m2) σn = 200 (kN/m2) σn = 100 (kN/m2) Figure 20c : Test 11A – PVC (rear side) and GCL Type 2 (non woven side), Shear Stress, τ (kN/m2 ) Vs Strain (%)
- 26. For PVC (rear side) and GCL type 2 (woven side) interface, the peak shear stresses were reached within strain of 3 to 6 %. Continuous increment in shear stresses was observed for normal load of 100 kPa. Residual shear stress trend various for higher normal loads of 200 and 300 kPa. The increment in shear stresses in the residual region was due to high cohesion forces. In all normal stresses there were no pre peaks, slippage or plowing taking place before peak stresses. Figure 20d shows the shear stress plots for interface test between PVC (rear side) and GCL type 2 (woven side) – Test 11C Strain (%) 0 5 10 15 20 Shear Stress, τ (kN/m 2 ) 0 20 40 60 80 100 120 140 σn = 300 (kN/m2) σn = 200 (kN/m2) σn = 100 (kN/m2) Figure 20d : Test 11C – PVC (rear side) and GCL Type 2 (woven side), Shear Stress, τ (kN/m2 ) Vs Strain (%) In the case of PVC (front side) and GCL type 2 (non woven side) interfaces, the peak shear stresses were reached within strain of 4 to 8 %. Beyond peak stresses constant reduction in shear stresses were observed and maintained constant in the residual region. In all normal stresses there were no pre peaks, slippage or plowing taking place before peak stresses. Figure 20e shows the shear stress plots for interface test between PVC (front side) and GCL type 2 (non woven side) – Test 11E. Strain (%) 0 5 10 15 20 Shear Stress, τ (kN/m 2 ) 0 20 40 60 80 100 120 140 σn = 300 (kN/m2) σn = 200 (kN/m2) σn = 100 (kN/m2) Figure 20e : Test 11E – PVC (front side) and GCL Type 2 (non woven side), Shear Stress, τ (kN/m2 ) Vs Strain (%) For PVC (front side) and GCL type 2 (woven side) interfaces, the peak shear stresses were reached within strain of 4 to 8 %. Beyond peak stresses constant reduction in shear stresses were observed and maintained constant in the residual region. The high and constant residual shear stresses could be due to cohesion contribution of bentonite in the GCL. In all normal stresses there were pre peaks taking place before peak stresses. Figure 20f shows the shear stress plots for interface test between PVC (front side) and GCL type 2 (woven side) – Test 11G. Strain (%) 0 5 10 15 20 Shear Stress, τ (kN/m 2 ) 0 20 40 60 80 100 120 140 σn = 300 (kN/m2) σn = 200 (kN/m2) σn = 100 (kN/m2) Figure 20f : Test 11G – PVC (front side) and GCL Type 2 (woven side), Shear Stress, τ (kN/m2 ) Vs Strain (%)
- 27. 5.4 Silt bentonite (100 : 10) interfacing with geosynthetics The performances of silt bentonite mixture (100 : 10) with geosynthetics were relatively consistent with interface test results were within a narrow range of differences. Only fictional contribution was exhibited without cohesions. The performance of geotextile and HDPE type 1 was the lowest with fiction angle of 15 degrees. HDPE type 2 and PVC provide high and relatively similar frictional resistance. Details of the test results are presented in Table 10 and Figure 21a to 21f respectively. Table 10 : Test results of silt bentonite (100 : 10) interfacing with geosynthetics Figure 21a : Summary of peak failure envelopes for Silt bentonite (100 : 10) interfacing with Geosnthetics For silt bentonite (100 : 10) and geotextile interface, the peak shear stresses were reached within strain of 5 to 6.5 %. There were spots of tearing and total internal failure of geotextile took place. Continuous reduction in the shear stresses was observed until constant residual shear stresses were obtained beyong 10% strain. In all normal stresses there were no pre peaks, slippage or plowing taking place before peak stresses. Figure 21b shows the shear stress plots for interface test between silt bentonite (100 : 10) and geotextile – Test 12A Strain (%) 0 5 10 15 20 Shear Stress, τ (kN/m 2 ) 0 20 40 60 80 100 120 σn = 300 (kN/m2) σn = 200 (kN/m2) σn = 100 (kN/m2) Figure 21b : Test 12A – Silt bentonite (100 : 10) and Geotextile, Shear Stress, τ (kN/m2 ) Vs Strain (%) In the case of interface between silt bentonite (100 : 10) and HDPE type 1, the peak shear stresses were reached within strain of 2 to 3%. Continuous reduction of shear stresses was observed beyond peak stresses before constant or minor increment in shear stresses was observed 10% strain onwards. No plowing kind of forces was observed, only in case with the normal load of 300 kPa minor plowing was observed beyond peak stresses. Figure 21c shows the shear stress plots for interface test between silt bentonite (100 : 10) and HDPE type 1 – Test 13A NORMAL STRESS, σn (kN/m2 ) 0 100 200 300 400 SHEAR STRESS, τ p (kN/m 2 ) 0 100 200 300 400 Test 12A, τp = σn tan (15.3) Test 13A, τp = σn tan (15.4) Test 14A, τp = σn tan (24.2) Test 15A, τp = σn tan (22.2) Test 15C, τp = σn tan (20.0)
- 28. Strain (%) 0 5 10 15 20 Shear Stress, τ (kN/m 2 ) 0 20 40 60 80 100 σn = 300 (kN/m2) σn = 200 (kN/m2) σn = 100 (kN/m2) Figure 21c : Test 13A – Silt bentonite (100 : 10) and HDPE type 1, Shear Stress, τ (kN/m2 ) Vs Strain (%) For silt bentonite (100 : 10) and HDPE type 2 interface, the peak shear stresses were reached within strain of 5 to 8 %. The texture of HDPE type 2 was not sheared. Continuous increment in shear stresses was observed for normal loads of 100 and 200 kPa in the residual region. In all normal stresses there were pre peaks or slippage and minor plowing taking place before peak stresses. Figure 21d shows the shear stress plots for interface test between silt bentonite (100 : 10) and HDPE type 2 – Test 14A Strain (%) 0 5 10 15 20 Shear Stress, τ (kN/m 2 ) 0 20 40 60 80 100 120 140 160 σn = 300 (kN/m2) σn = 200 (kN/m2) σn = 100 (kN/m2) Figure 21d : Test 14A – Silt bentonite (100 : 10) and HDPE type 2, Shear Stress, τ (kN/m2 ) Vs Strain (%) In the case of interface between silt bentonite (100 : 10) and PVC (rear side), the peak shear stresses were reached within strain of 5 to 8%. Continuous reduction of shear stresses was observed beyond peak stresses for normal loads of 200 and 300 kPa. However constant residual stresses were maintained for normal load of 100 kPa. No plowing kind of forces was observed, in the test. Pre peak stresses were clearly observed for normal load of 300 kPa only. Figure 21e shows the shear stress plots for interface test between silt bentonite (100 : 10) and PVC (rear side) – Test 15A Strain (%) 0 5 10 15 20 Shear Stress, τ (kN/m 2 ) 0 20 40 60 80 100 120 140 160 σn = 300 (kN/m2) σn = 200 (kN/m2) σn = 100 (kN/m2) Figure 21e : Test 15A – Silt bentonite (100 : 10) and PVC (rear side), Shear Stress, τ (kN/m2 ) Vs Strain (%) For silt bentonite (100 : 10) and PVC (front side) interface, the peak shear stresses were reached within strain of 4 to 8 %. Continuous reduction of shear stresses was observed beyond peak stresses for normal loads of 200 and 300 kPa. However constant residual stresses were maintained for normal load of 100 kPa. In all normal stresses there were pre peaks or slippage and minor plowing taking place before peak stresses. Figure 21f shows the shear stress plots for interface test between silt bentonite (100 : 10) and PVC (front side) – Test 15C Strain (%) 0 5 10 15 20 Shear Stress, τ (kN/m 2 ) 0 20 40 60 80 100 120 140 σn = 300 (kN/m2) σn = 200 (kN/m2) σn = 100 (kN/m2) Figure 21f : Test 15C – Silt bentonite (100 : 10) and PVC (front side), Shear Stress, τ (kN/m2 ) Vs Strain (%)
- 29. 5.5 Silt bentonite (100 : 10) interfacing with GCLs Type 1 and 2 The performances of silt bentonite mixture (100 : 10) with geosynthetics clay liners (GCL) were relatively consistent with interface test results within a narrow range of differences. Higher cohesion and lower frictional contribution was observed with GCL type 1 (bentonite side). Higher fiction was observed in the case of GCL type 1 (HDPE side) and GCL type 2 (woven side). In general both GCLs sides contributed high frictional resistance with silt bentonite (100 : 10). Details of the test results are presented in Table 11 and Figure 22a to 22e respectively. Table 11 : Test results of silt bentonite (100 : 10) interfacing with geosynthetics Figure 22a : Summary of peak failure envelopes for Silt bentonite (100 : 10) interfacing with GCLs For silt bentonite (100 : 10) and GCL type 1 (bentonite side) interface, the peak shear stresses were reached within strain of 5 to 6.5 %. Beyond peak the shear stresses were maintained constant in the residual region. The surface of bentonite was pressed and smoothed by the normal loads. In all normal stresses there were no pre peaks or slippage or plowing taking place before peak stresses. Figure 22b shows the shear stress plots for interface test between silt bentonite (100 : 10) and GCL type 1 (bentonite side) – Test 17A Strain (%) 0 5 10 15 20 Shear Stress, τ (kN/m 2 ) 0 20 40 60 80 100 120 140 σn = 300 (kN/m2) σn = 200 (kN/m2) σn = 100 (kN/m2) Figure 22b : Test 17A – Silt bentonite (100 : 10) and GCL type 1 (bentonite side), Shear Stress, τ (kN/m2 ) Vs Strain (%) In the case of interface between silt bentonite (100 : 10) and GCL type 1 (HDPE side), the peak shear stresses were reached within strain of 6 to 8%. Due to GCL elongation, plastic deformation occurred at clamp area. However texture of HDPE remains intact. Beyond peak the shear stresses were maintained constant in the residual region for normal loads of 100 and 200 kPa . For 300 kPa normal loads reduction in shear stresses beyond peak was observed before constant residual shear stresses reached. No plowing kind of forces was observed, in the test. Only minor slippage occurred. Figure 22c shows the shear stress plots for interface test between silt bentonite (100 : 10) and GCL type 1 (HDPE side) – Test 17C Strain (%) 0 5 10 15 20 Shear Stress, τ (kN/m 2 ) 0 20 40 60 80 100 120 140 σn = 300 (kN/m2) σn = 200 (kN/m2) σn = 100 (kN/m2) Figure 22c : Test 17C – Silt bentonite (100 : 10) and GCL type 1 (HDPE side), Shear Stress, τ (kN/m2 ) Vs Strain (%) NORMAL STRESS, σn (kN/m2 ) 0 100 200 300 400 SHEAR STRESS, τ p (kN/m 2 ) 0 100 200 300 400 Test 17A, τp = 13.9 + σn tan (17.0) Test 17C, τp = σn tan (22.6) Test 18A, τp = 6.3 + σn tan (20.8) Test 18C, τp = 1.4 + σn tan (21.4)
- 30. Silt bentonite (100 : 10) and GCL type 2 (non woven side) interface, the peak shear stresses were reached within strain of 6 to 8 %. Beyond peak stresses constant residual shear stresses were obtained for all normal loads. Fluctuation in shear stresses in the residual region for normal loads of 200 and 300 kPa were due to tearing of geotextile during the test. In all normal stresses there were no peaks or slippage or plowing taking place before peak stresses. Figure 22c shows the shear stress plots for interface test between silt bentonite (100 : 10) and GCL type 2 (non woven side) – Test 18A Strain (%) 0 5 10 15 20 Shear Stress, τ (kN/m 2 ) 0 20 40 60 80 100 120 140 σn = 300 (kN/m2) σn = 200 (kN/m2) σn = 100 (kN/m2) Figure 22d : Test 18A – Silt bentonite (100 : 10) and GCL type 2 (non woven side), Shear Stress, τ (kN/m2 ) Vs Strain (%) In the case of interface between silt bentonite (100 : 10) and GCL type 2 (woven side), the peak shear stresses were reached within strain of 6 to 8%. Beyond peak stresses constant residual shear stresses were obtained for all normal loads. Fluctuation in shear stresses in the residual region for normal load of 300 kPa was due to tearing of geotextile during the test. In all normal stresses there were minor slippages or plowing taking place before peak stresses. Figure 22d shows the shear stress plots for interface test between silt bentonite (100 : 10) and GCL type 2 (woven side) – Test 18C Strain (%) 0 5 10 15 20 Shear Stress, τ (kN/m 2 ) 0 20 40 60 80 100 120 140 σn = 300 (kN/m2) σn = 200 (kN/m2) σn = 100 (kN/m2) Figure 22e : Test 18C – Silt bentonite (100 : 10) and GCL type 2 (woven side), Shear Stress, τ (kN/m2 ) Vs Strain (%) 5.6 Sand bentonite (100 : 10) interfacing with geosynthetics The performances of sand bentonite mixture (100 : 10) with geosynthetics were covered in wide range of friction angle. Only fictional contribution was exhibited without cohesions. The performance of geotextile and HDPE type 1 were the lowest with fiction angle of 13 to 15 degrees. HDPE type 2 and PVC provide high and relatively similar frictional resistance. However friction angle of PVC front side was as low as geotextile friction angle. Details of the test results are presented in Table 12 and Figure 23a to 23f respectively. Table 12 : Test results of sand bentonite (100 : 10) interfacing with geosynthetics
- 31. Figure 23a : Summary of peak failure envelopes for Silt bentonite (100 : 10) interfacing with geosynthetics Sand bentonite (100 : 10) and geotextile interface, the peak shear stresses were reached within strain of 3 to 8 %. Continuous increment in shear stresses was observed beyond peak stresses into residual region. The geotextile was split into two during the tests. The residual shear stress behaviours were relatively similar for normal loads of 200 and 300 kPa.In all normal stresses there were no pre peaks or slippage or plowing taking place before peak stresses. Figure 22c shows the shear stress plots for interface test between silt bentonite (100 : 10) and geotextile – Test 19A Strain (%) 0 5 10 15 20 Shear Stress, τ (kN/m 2 ) 0 20 40 60 80 100 120 140 σn = 300 (kN/m2) σn = 200 (kN/m2) σn = 100 (kN/m2) Figure 23b : Test 19A – Sand bentonite (100 : 10) and geotexttile, Shear Stress, τ (kN/m2 ) Vs Strain (%) In the case of interface between sand bentonite (100 : 10) and HDPE type 1, the peak shear stresses were reached within strain of 1 to 2.5 %. Minor reduction of shear stresses was observed beyond peak stresses before constant shear stresses were observed in the residual region. The trends of shear stresses were similar for all tests. No plowing kind of forces was observed, in the tests. Figure 23c shows the shear stress plots for interface test between sand bentonite (100 : 10) and HDPE type 1 – Test 20A Strain (%) 0 5 10 15 20 Shear Stress, τ (kN/m 2 ) 0 20 40 60 80 100 σn = 300 (kN/m2) σn = 200 (kN/m2) σn = 100 (kN/m2) Figure 23c : Test 20A – Sand bentonite (100 : 10) and HDPE type 1, Shear Stress, τ (kN/m2 ) Vs Strain (%) For sand bentonite (100 : 10) and HDPE type 2 interface, the peak shear stresses were reached within strain of 7 to 8 %. The texture of HDPE type 2 was sheared partially to fully as the normal loads were increased. Constant increments in shear stresses were observed beyond peak stresses in the residual region. In all normal stresses there were pre peaks taking place before peak stresses. Figure 23d shows the shear stress plots for interface test between sand bentonite (100 : 10) and HDPE type 2 – Test 21A Strain (%) 0 5 10 15 20 Shear Stress, τ (kN/m 2 ) 0 20 40 60 80 100 120 140 160 σn = 300 (kN/m2) σn = 200 (kN/m2) σn = 100 (kN/m2) Figure 23d : Test 21A – Sand bentonite (100 : 10) and HDPE type 2, τ (kN/m2 ) Vs Strain (%) NORMAL STRESS, σn (kN/m2 ) 0 100 200 300 400 SHEAR STRESS, τ p (kN/m 2 ) 0 100 200 300 400 Test 19A, τp = σn tan (15.8) Test 20A, τp = σn tan (13.8) Test 21A, τp = σn tan (24.5) Test 22A, τp = σn tan (19.8) Test 22C, τp = σn tan (16.9)
- 32. Sand bentonite (100 : 10) and PVC (rear side) interface, the peak shear stresses were reached within strain of 6 to 8 %. Continuous increment in shear stresses was observed beyond peak stresses till constant residual stresses were reached into residual region for normal loads of 100 and 200 kPa. The trend shear stresses for normal loads of 300 kPa were much different then lower normal loads. There were minor pre peaks for normal loads of 200 and 300 kPa. Figure 23e shows the shear stress plots for interface test between sand bentonite (100 : 10) and PVC (rear side) – Test 22A Strain (%) 0 5 10 15 20 Shear Stress, τ (kN/m 2 ) 0 20 40 60 80 100 120 140 σn = 300 (kN/m2) σn = 200 (kN/m2) σn = 100 (kN/m2) Figure 23e : Test 22A – Sand bentonite (100 : 10) and PVC (rear side), τ (kN/m2 ) Vs Strain (%) In the case of interface between sand bentonite (100 : 10) and PVC (front side), the peak shear stresses were reached within strain of 2 to 8 %. Constant shear stresses were observed beyond peak stresses in the residual region. However in the case of normal load of 300 kPa, gradual reduction in shear stresses was observed before constant shear stresses were reached in the residual region. No plowing kind of forces was observed, only minor slippages in the tests. Figure 23f shows the shear stress plots for interface test between sand bentonite (100 : 10) and PVC (front side) – Test 22C Strain (%) 0 5 10 15 20 Shear Stress, τ (kN/m 2 ) 0 20 40 60 80 100 120 σn = 300 (kN/m2) σn = 200 (kN/m2) σn = 100 (kN/m2) Figure 23f : Test 22C – Sand bentonite (100 : 10) and PVC (front side), τ (kN/m2 ) Vs Strain (%) 5.7 Sand bentonite (100 : 10) interfacing with GCLs Type 1 and 2 The performances of sand bentonite mixture (100 : 10) with GCL type 1 and 2 were covered with narrow minimum and maximum range. Cohesion was not contributed in the case of GCL type 2 (non woven side). GCL type 1 (HDPE side) has the lowest friction angle. GCL type 1 (bentonite side) and GCL type 2 (woven side) frictional resistance was 17 degree, however GCL type 2 (woven side) contributed high cohesion. Details of the test results are presented in Table 13 and Figure 24a to 24e respectively. Table 13 : Test results of sand bentonite (100 : 10) interfacing with geosynthetics Figure 24a : Summary of peak failure envelopes for Sand bentonite (100 : 10) interfacing with GCLs Type 1 and 2 NORMAL STRESS, σn (kN/m2 ) 0 100 200 300 400 SHEAR STRESS, τ p (kN/m 2 ) 0 100 200 300 400 Test 24A, τp = 6.5 + σn tan (17.6) Test 24C, τp = 14.7 + σn tan (13.7) Test 25A, τp = σn tan (22.6) Test 25C, τp = 25.8 + σn tan (17.1)
- 33. For sand bentonite (100 : 10) and GCL type (bentonite side) interface, the peak shear stresses were reached within strain of 3 to 4.5 %. GCL bentonite surface was partially to fully sheared base on normal load. Constant shear stresses were observed beyond peak stresses in the residual region. However in the case of normal load of 300 kPa, gradual reduction in shear stresses was observed before constant shear stresses were reached in the residual region. No plowing kind of forces was observed. Figure 24b shows the shear stress plots for interface test between sand bentonite (100 : 10) and GCL type 1 (bentonite side) – Test 24C Strain (%) 0 5 10 15 20 Shear Stress, τ (kN/m 2 ) 0 20 40 60 80 100 120 140 σn = 300 (kN/m2) σn = 200 (kN/m2) σn = 100 (kN/m2) Figure 24b : Test 24A – Sand bentonite (100 : 10) and GCL type 1 (bentonite side), τ (kN/m2 ) Vs Strain (%) Sand bentonite (100 : 10) and GCL type 1 (HDPE side) interface, the peak shear stresses were reached within strain of 6 to 8 %. The surface of GCL HDPE was sheared smooth, and internal failure of bentonite took place. Continuous increment in shear stresses was observed beyond peak stresses in residual region for normal loads of 100 and 200 kPa. The trend shear stresses for normal loads of 300 kPa were much different then lower normal loads. There were continuos reductions in shear stresses in the residual region. Figure 24c shows the shear stress plots for interface test between sand bentonite (100 : 10) and GCL (HDPE side) – Test 24C Strain (%) 0 5 10 15 20 Shear Stress, τ (kN/m 2 ) 0 20 40 60 80 100 120 σn = 300 (kN/m2) σn = 200 (kN/m2) σn = 100 (kN/m2) Figure 24c : Test 24C – Sand bentonite (100 : 10) and GCL type 1 (HDPE side), τ (kN/m2 ) Vs Strain (%) Sand bentonite (100 : 10) and GCL type 2 (non woven side) interface, the peak shear stresses were reached within strain of 4 to 8 %. Beyond peak stresses constant residual shear stresses were obtained for all normal loads. Fluctuation in shear stresses in the residual region for normal loads of 200 and 300 kPa were due to tearing of geotextile during the test. Both non woven and woven geotextile were partially to fully torn as the normal loads increase. In all normal stresses there were no peaks or slippage or plowing taking place before peak stresses. Figure 24d shows the shear stress plots for interface test between sand bentonite (100 : 10) and GCL type 2 (non woven side) – Test 25A Strain (%) 0 5 10 15 20 Shear Stress, τ (kN/m 2 ) 0 20 40 60 80 100 120 140 σn = 300 (kN/m2) σn = 200 (kN/m2) σn = 100 (kN/m2) Figure 24d : Test 25A – Sand bentonite (100 : 10) and GCL type 2 (non woven side), τ (kN/m2 ) Vs Strain (%)
- 34. In the case of sand bentonite (100 : 10) and GCL type 2 (woven side) interface, the peak shear stresses were reached within strain of 6 to 8 %. Partial tearing of woven geotextile took place only of normal loads of 200 and 300 kPa. The pre peaks for 200 and 300 kPa normal loads could be due to tearing of woven geotextile. The trend of interface failure were also similar for 200 and 300 kPa normal loads where beyond peak, reduction in shear stresses occurred before constant residual shear stresses were obtained. For normal load of 100 kPa, heavy plowing force was observed, however the geotextile was not torn, only wavy stress path was observed on woven geotextile. Figure 24e shows the shear stress plots for interface test between sand bentonite (100 : 10) and GCL type 2 (woven side) – Test 25C Strain (%) 0 5 10 15 20 Shear Stress, τ (kN/m 2 ) 0 20 40 60 80 100 120 140 σn = 300 (kN/m2) σn = 200 (kN/m2) σn = 100 (kN/m2) Figure 24e : Test 25C – Sand bentonite (100 : 10) and GCL type 2 (woven side), τ (kN/m2 ) Vs Strain (%) 5.8 Native soil interfacing with geosynthetics and compacted clay liner The performances of native soil with geosynthetics were covered in wide range of friction angle. Only fictional contribution was exhibited without cohesions. The performance of geotextile, HDPE type 1 and PVC (rear side) were the lowest with fiction angle of 15 to 19 degrees. HDPE type 2 provides high frictional resistance. Details of the test results are presented in Table 13 and Figure 25a to 25g respectively. Table 13 : Test results of native soil interfacing with geosynthetics Figure 25a : Summary of peak failure envelopes for native soil interfacing with geosynthetics For native soil and geotextile interface, the peak shear stresses were reached within strain of 4 to 8 %. Geotextile was ripped apart for normal stresses of 300 kPa. In the case of 100 kPa no damage was observed on the geotextile. Constant shear stresses were observed beyond peak stresses in the residual region. However in the case of normal load of 300 kPa, gradual reduction in shear stresses was observed before constant shear stresses were reached in the residual region. No plowing kind of forces was observed, only minor slippage occurred. Figure 25b shows the shear stress plots for interface test between native soil and geotextile – Test 26A 18.7 0.0 PVC (Rear) & NATIVE SOIL TEST 29A 23.1 0.0 HDPE TYPE 2 & NATIVE SOIL TEST 28A 15.6 0.0 HDPE TYPE 1 & NATIVE SOIL TEST 27A 17.8 0.0 GEOTEXTILE & NATIVE SOIL TEST 26A 31.0 0.0 SAND BENTONITE (100 : 10) & NATIVE SOIL TEST 23A 28.3 10.3 SILT BENTONITE (100 : 10) & NATIVE SOIL TEST 16A Interface Parameters Between Geosynthetic and Native Soil (HW Granitic Soil) Friction Angle (O ) Cohesion (kN/m2 ) Interface Parameters Test 18.7 0.0 PVC (Rear) & NATIVE SOIL TEST 29A 23.1 0.0 HDPE TYPE 2 & NATIVE SOIL TEST 28A 15.6 0.0 HDPE TYPE 1 & NATIVE SOIL TEST 27A 17.8 0.0 GEOTEXTILE & NATIVE SOIL TEST 26A 31.0 0.0 SAND BENTONITE (100 : 10) & NATIVE SOIL TEST 23A 28.3 10.3 SILT BENTONITE (100 : 10) & NATIVE SOIL TEST 16A Interface Parameters Between Geosynthetic and Native Soil (HW Granitic Soil) Friction Angle (O ) Cohesion (kN/m2 ) Interface Parameters Test NORMAL STRESS, σn (kN/m2 ) 0 100 200 300 400 SHEAR STRESS, τ p (kN/m 2 ) 0 100 200 300 400 Test 26A, τp = σn tan (17.8) Test 27A, τp = σn tan (15.6) Test 28A, τp = σn tan (23.1) Test 29A, τp = σn tan (18.7) Test 16A, τp = 10.3 + σn tan (28.3) Test 23A, τp = σn tan (31.0)
- 35. Strain (%) 0 5 10 15 20 Shear Stress, τ (kN/m 2 ) 0 20 40 60 80 100 120 σn = 300 (kN/m2) σn = 200 (kN/m2) σn = 100 (kN/m2) Figure 25b : Test 26A – Native soil and geotextile, τ (kN/m2 ) Vs Strain (%) In the case of interface between native soil and HDPE type 1, the peak shear stresses were reached within strain of 1 to 3 %. Minor reduction of shear stresses was observed beyond peak stresses before constant shear stresses were observed in the residual region. The trends of shear stresses were similar for all tests. No plowing kind of forces was observed, in the tests. Figure 25c shows the shear stress plots for interface test between native soil and HDPE type 1 – Test 27A Strain (%) 0 5 10 15 20 Shear Stress, τ (kN/m 2 ) 0 20 40 60 80 100 σn = 300 (kN/m2) σn = 200 (kN/m2) σn = 100 (kN/m2) Figure 25c : Test 27A – Native soil and HDPE type 1, τ (kN/m2 ) Vs Strain (%) Interface between native soil and HDPE type 2, the peak shear stresses were reached within strain of 7 to 8 %. The surface of HDPE type 2 was partially to fully sheared during the test depending to the normal loads. Constant shear stresses were observed beyond peak stresses in the residual region. However in the case of normal load of 300 kPa, gradual reduction in shear stresses was observed before constant shear stresses were reached in the residual region. Minor pre peak and plowing kind of forces were observed. Figure 25d shows the shear stress plots for interface test between native soil and HDPE type 2 – Test 28A Strain (%) 0 5 10 15 20 Shear Stress, τ (kN/m 2 ) 0 20 40 60 80 100 120 140 160 σn = 300 (kN/m2) σn = 200 (kN/m2) σn = 100 (kN/m2) Figure 25d : Test 28A – Native soil and HDPE type 2, τ (kN/m2 ) Vs Strain (%) For interface between native soil and PVC (rear side), the peak shear stresses were reached within strain of 3 to 5.5 %. No damage was observed on the PVC surface. Constant shear stresses were observed beyond peak stresses in the residual region. However in the case of normal load of 300 kPa, gradual reduction in shear stresses was observed before constant shear stresses were reached in the residual region. Minor pre peak and plowing kind of forces were observed. Figure 25e shows the shear stress plots for interface test between native soil and PVC (rear side) – Test 29A
- 36. Strain (%) 0 5 10 15 20 Shear Stress, τ (kN/m 2 ) 0 20 40 60 80 100 120 140 σn = 300 (kN/m2) σn = 200 (kN/m2) σn = 100 (kN/m2) Figure 25e : Test 29A – Native soil and PVC (rear side), τ (kN/m2 ) Vs Strain (%) Strain (%) 0 5 10 15 20 Shear Stress, τ (kN/m 2 ) 0 50 100 150 200 σn = 300 (kN/m2) σn = 200 (kN/m2) σn = 100 (kN/m2) Figure 25f : Test 16A – Native soil and Silt Bentonite (100 : 10), τ (kN/m2 ) Vs Strain (%) Strain (%) 0 5 10 15 20 Shear Stress, τ (kN/m 2 ) 0 50 100 150 200 250 σn = 300 (kN/m2) σn = 200 (kN/m2) σn = 100 (kN/m2) Figure 25g : Test 23A – Native soil and Sand Bentonite (100 : 10), τ (kN/m2 ) Vs Strain (%) OVERALL SUMMARY OF FINDING IS PENDING
- 37. 6 CONVENTIONAL ANALYSIS APPROACH This section discuss about the conventional limit state design approach adopted for land fill liner stability assessment. Typical analysis model is shown in Figure 26 and typical liner configuration is shown in Figure 28. Table 13 list out the interface test configuration for liner shown in Figure 26. Figure 27 summarized the interface test results. As for stability analysis, compatible software was used to model the landfill slope with relevant input parameters obtained from laboratory test data. Limit equilibrium based software was used to analysis both static and seismic loading conditions. Following are the list of cases considered for analysis i) Interface failure within bottom liner, ii) Internal failure within bottom liner, iii) Interface failure within liner cover, iv) Internal failure within liner cover. Table 14 lists out the analysis cases considered. All cases are analyzed for as installed condition only. Figure 26 : Typical configuration of single composite liner Table 13 : List of the test configurations and interface test results Table 14 : Analyzing cases considered Figure 27 : Interface shear stress results for Test 1A, Test 1B, Test 19A and Test 26A NORMAL STRESS, σn (kN/m2 ) 0 100 200 300 400 SHEAR STRESS, τ p (kN/m 2 ) 0 100 200 300 400 Test 1A, τp = 1.8 + σn tan (6.9) TEST 1B, τp = σn tan (7.3) TEST 19A, τp = σn tan (15.8) TEST 26A, τp = σn tan (17.8) Compacted Clay Liner, Sand and Bentonite Mix (100 : 10) Non Woven Geotextile Geomembrane, HDPE Type 1 (smooth surface) Non Woven Geotextile Native Soil / Highly Decomposed Granite Soil
- 38. Figure 28 : Typical section of landfill which was used for stability analysis Figure 29 : Typical failure section within bottom liner for Case 1 to 5 Figure 30 : Typical failure section within landfill cover for Case 6 to 9 Figure 31 : Toe failure of waste - Case 10 Figure 32 : Overall landfill failure - Case 11 Figure 33 : Overall landfill base failure - Case 12 Figures 29, 30, 31, 32 and 33 shows the typical analysis results for the cases listed in Table 14. Seismic horizontal coefficient of 0.1, 0.15, 0.2 and 0.25 were introduced in the analysis to study the trend of liner interface performance under earthquake loading. Based on the analysis results presented in Figures 34, 35 and 36, critical cases are 5, 7 and 8, which shows the interface between HDPE Type 1 (smooth surface) and geotextile. This is however consistent with interface Test 1A and 1B which have the lowest coefficient of friction as shown in Figure 27. However in the case of landfill cover, interface between goetextile and cover soil (Case 6), has high potential of failure during seismic loading. Similar condition of Case 3 in bottom liner is much stable as compared to Case 6 of liner cover. In the case of internal and overall stability of landfill, the factor of safety (FOS) obtained are relatively stable under both static and seismic loading.