SlideShare a Scribd company logo
1 of 18
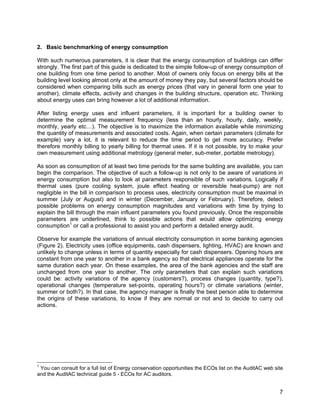
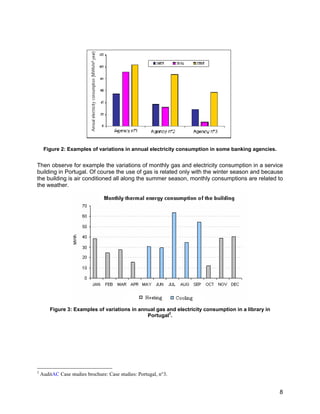
Download to read offline
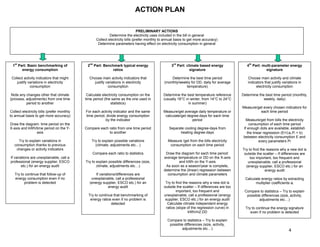
Technical guides for owner/manager of an air conditioning
                    system: volume 7


A benchmarking guide adapted to air
conditioning based on electricity bills


                                                            1
Team

                                  France (Project coordinator)
                                   Armines - Mines de Paris

                         Austria
                                                                        Slovenia
                 Austrian Energy Agency
                                                                  University of Ljubljana

                         Belgium                                            UK
                    Université de Liège                           Association of Building
                                                                       Engineers
                           Italy                                            BRE
                   Politecnico di Torino                            (Building Research
                                                                    Establishment Ltd)
                         Portugal
                     University of Porto                             Welsh School of
                                                                      Architecture

                               Eurovent-Certification


Authors of this volume
Jérôme ADNOT (Armines, France)
Daniela BORY (Armines, France)
Maxime DUPONT (Armines, France)
Roger HITCHIN (BRE, UK)


    The sole responsibility for the content of this publication lies with the authors. It does not
    represent the opinion of the European Communities. The European Commission is not
        responsible for any use that may be made of the information contained therein.


                                                                                                     2
Objectives of the guide

The objective of this guide is mainly to help building owners to detect changes in energy
consumption of their air conditioning plant as a first step in identifying and correcting faults. Even
in the absence of obvious faults , building owners should monitor energy consumption and be
alert for early signs of problems. This will enable them to react promptly through behavioral
changes, operational changes (system adjustments), investment in component replacement or
in extreme cases with a complete retrofit. When changes have been introduced, monitoring
allows the effectiveness and actual payback times to be assessed for future use.

In order to help the managers an action plan has been defined: a complete scheme of the plan is
reported in the next page and it is detailed all along the document.

Moreover, some example of ratios of energy consumption are presented in the annex as
indicative values that should be considered for their order of magnitude more than the value
itself.


                                                                                                    3
ACTION PLAN

                                                                               PRELIMINARY ACTIONS
                                                           Determine the electricity uses included in the bill in general
                                                  Collect electricity bills (prefer monthly to annual basis to get more accuracy)
                                                   Determine parameters having effect on electricity consumption in general


  1st Part: Basic benchmarking of            2nd Part: Benchmark typical energy                    3rd Part: climate based energy               4th Part: multi-parameter energy
        energy consumption                                  ratios                                             signature                                    signature

 Collect activity indicators that might       Choose main activity indicators that                Determine the best time period                Choose main activity and climate
    justify variations in electricity            justify variations in electricity            (monthly/weekly for DD, daily for average         indicators that justify variations in
             consumption                                  consumption                                      temperature)                              electricity consumption

 Note any changes other that climate         Calculate electricity consumption on the        Determine the best temperature reference        Determine the best time period (monthly,
(process, adjustments) from one time        time period (the same as the one used in         (usually 18°C in winter, from 14°C to 24°C                   weekly, daily)
          period to another                                 statistics)                                      in summer)
                                                                                                                                             Measure/get every chosen indicators for
Collect electricity bills (prefer monthly   For each activity indicator and the same         Measure/get average daily temperature or                  each time period
to annual basis to get more accuracy)       time period, divide energy consumption            calculate/get degree-days for each time
                                                        by the indicator                                       period                           Measure/get from bills the electricity
Draw the diagram: time period on the                                                                                                              consumption of each time period
X-axis and kWh/time period on the Y-        Compare each ratio from one time period              Separate cooling degree-days from            If enough dots are available, establish
               axis                                      to another                                    heating degree-days                       the linear regression (E=Σai.Pi + b)
                                                                                                                                              between electricity consumption E and
     Try to explain variations in               Try to explain possible variations              Measure /get from the bills electricity                  every parameters Pi
   consumption thanks to previous                 (climate, adjustments etc…)                    consumption on each time period
    changes or activity indicators                                                                                                           Try to find the reasons why a new dot is
                                                Compare each ratio to statistics               Draw the diagram for each time period:         outside the scatter – If differences are
If variations are unexplainable, call a                                                       average temperature or DD on the X-axis             too important, too frequent and
professional (energy supplier, ESCO         Try to explain possible differences (size,                 and kWh on the Y-axis                    unexplainable, call a professional
        etc.) for an energy audit                  climate, adjustments etc…)                  As soon as a season/year is complete,           (energy supplier, ESCO etc.) for an
                                                                                              determine the (linear) regression between                     energy audit
   Try to continue that follow-up of              If variations/differences are                 consumption and climate parameters
   energy consumption even if no               unexplainable, call a professional                                                              Calculate energy ratios by extracting
         problem is detected                  (energy supplier, ESCO etc.) for an              Try to find the reasons why a new dot is              multiplier coefficients ai
                                                           energy audit                       outside the scatter – If differences are too
                                                                                                      important, too frequent and             Compare to statistics – Try to explain
                                              Try to continue that benchmarking of            unexplainable, call a professional (energy       possible differences (size, activity,
                                               energy ratios even if no problem is             supplier, ESCO etc.) for an energy audit               adjustments etc…)
                                                            detected                            Calculate climate independent energy
                                                                                               ratios (slope of the regression curve) in       Try to continue the energy signature
                                                                                                              kWh/m2.DD                           even if no problem is detected

                                                                                                Compare to statistics – Try to explain
                                                                                                 possible differences (size, activity,
                                                                                                        adjustments etc…)                                                   4
1. Pre-requisite

Energy uses having effect on the electricity bill of a building

Any building owner must be aware that, for more accuracy, direct measurements on individual
items of equipment (chiller for example) or energy use (lighting for example) - which may need to
be organized by himself – are preferable overall utility energy bills. The latter combine energy
consumption by numerous end-uses and may relate to time periods that are not ideal for
monitoring purposes.

The total electricity bill mainly includes the consumption of lighting, ventilating and small power
appliances (kitchen or office equipments, HI-FI etc…) and sometimes process loads such as air
compressors, pumps, fans etc…Air conditioning, is included because non-electric cooling is rare.
Building heating and domestic water heating can also be provided by the Joule effect (direct
electric) or with a heat pump. However these two activities often use fossil fuels and are then
accounted in a separate bill.

Interpretation of electricity bills requires the listing of each type of electrical appliances whose
consumption is included in the energy bill. When possible, try to evaluate the electrical power
they absorb in operation by looking at their electrical plate or documentation (see Table 1).

       Appliances type       Number of      Electric unit   Operation hours      Energy (kWh)
                            equipments         power
         Computers              40               300              4380              13140
        Printers type A         10               400               500               2000
                                            (20 stand by)         1000               200
         Bulbs type X            50              60               5000              3000
         Bulbs type Y            10              100               5000              5000
         Neon type Z             70              40                1540              616
        Electric heaters         10             1200               2500             30000
              Etc.               ….               …                 …                  …
                                                            Total energy (kWh)        xxx
           Table 1 An example of listing the electric appliances and their nominal power.


It is important also to estimate the number of hours they operate during the period covered by
the meter readings.. Absorbed power and time of operation can be used to estimate the energy
consumption. The total amount of energy calculated should be compared to the actual
measured consumption in order to verify the consistency of the list and its exhaustiveness.

Keep in mind that the analysis of air conditioning performances using global energy bills will be
accurate only if the share of air conditioning energy consumption in the bill is significant. If
energy consumption for cooling is submerged by that from other uses, accurate estimation will
be impossible without sub-metering.

Parameters having effects on air conditioning energy consumption

Several parameters have effects on air conditioning energy consumption and more generally on
all thermal energy consumption. It is possible to distinguish four types:


                                                                                                  5
-   Building parameters are intrinsic to the construction of the building. The building shell
       thermal characteristics, the glazing surface, heated/cooled areas and their location are
       part of them. They were fixed by the first owner of the building and are difficult for
       following building owners to change because of the costs of retrofits and relatively long
       payback times.
   -   Policy parameters depend only on the current building owner’s decisions and his will to
       save energy. Equipment choices and investments, operational parameters such as
       temperature and humidity set points (if building centralized), the time of operation or
       maintenance and follow-up policies are among them. The sensitivity of energy
       consumption to these parameters is really important.
   -   Behavioral parameters depend on the occupants’ choices. Operational parameters such
       as temperature and humidity set points (if room localized) or the natural uneconomic
       behavior of occupants are part of them. Their influence on energy consumption can be
       large although the duration of the “good practice” behavior can be short.
   -   Activity parameters depend mostly on the use of each space . These are largely
       determined by the business needs of the organization. They have an important influence
       on energy consumption but a building owner or energy manager cannot usually change
       them.

Interpretation requires the identification of the most important parameters affecting each type of
energy consumption. Special attention must be paid to causes that might be improved by the
building owner.

These are then the preliminary actions to develop in order to begin the analysis of the energy
consumption of the building and are necessary to all the processes developed in the following
paragraphs.

                                     PRELIMINARY ACTIONS
                 Determine the electricity uses included in the bill in general
        Collect electricity bills (prefer monthly to annual basis to get more accuracy)
         Determine parameters having effect on electricity consumption in general

                           Figure 1: Preliminary part of ACTION PLAN


                                                                                                6
2. Basic benchmarking of energy consumption

With such numerous parameters, it is clear that the energy consumption of buildings can differ
strongly. The first part of this guide is dedicated to the simple follow-up of energy consumption of
one building from one time period to another. Most of owners only focus on energy bills at the
building level looking almost only at the amount of money they pay, but several factors should be
considered when comparing bills such as energy prices (that vary in general form one year to
another), climate effects, activity and changes in the building structure, operation etc. Thinking
about energy uses can bring however a lot of additional information.

After listing energy uses and influent parameters, it is important for a building owner to
determine the optimal measurement frequency (less than an hourly, hourly, daily, weekly,
monthly, yearly etc…). The objective is to maximize the information available while minimizing
the quantity of measurements and associated costs. Again, when certain parameters (climate for
example) vary a lot, it is relevant to reduce the time period to get more accuracy. Prefer
therefore monthly billing to yearly billing for thermal uses. If it is not possible, try to make your
own measurement using additional metrology (general meter, sub-meter, portable metrology).

As soon as consumption of at least two time periods for the same building are available, you can
begin the comparison. The objective of such a follow-up is not only to be aware of variations in
energy consumption but also to look at parameters responsible of such variations. Logically if
thermal uses (pure cooling system, joule effect heating or reversible heat-pump) are not
negligible in the bill in comparison to process uses, electricity consumption must be maximal in
summer (July or August) and in winter (December, January or February). Therefore, detect
possible problems on energy consumption magnitudes and variations with time by trying to
explain the bill through the main influent parameters you found previously. Once the responsible
parameters are underlined, think to possible actions that would allow optimizing energy
consumption1 or call a professional to assist you and perform a detailed energy audit.

Observe for example the variations of annual electricity consumption in some banking agencies
(Figure 2). Electricity uses (office equipments, cash dispensers, lighting, HVAC) are known and
unlikely to change unless in terms of quantity especially for cash dispensers. Opening hours are
constant from one year to another in a bank agency so that electrical appliances operate for the
same duration each year. On these examples, the area of the bank agencies and the staff are
unchanged from one year to another. The only parameters that can explain such variations
could be: activity variations of the agency (customers?), process changes (quantity, type?),
operational changes (temperature set-points, operating hours?) or climate variations (winter,
summer or both?). In that case, the agency manager is finally the best person able to determine
the origins of these variations, to know if they are normal or not and to decide to carry out
actions.


1
 You can consult for a full list of Energy conservation opportunities the ECOs list on the AuditAC web site
and the AuditAC technical guide 5 - ECOs for AC auditors.


                                                                                                         7
Figure 2: Examples of variations in annual electricity consumption in some banking agencies.


Then observe for example the variations of monthly gas and electricity consumption in a service
building in Portugal. Of course the use of gas is related only with the winter season and because
the building is air conditioned all along the summer season, monthly consumptions are related to
the weather.


        Figure 3: Examples of variations in annual gas and electricity consumption in a library in
                                               Portugal2.


2
    AuditAC Case studies brochure: Case studies: Portugal, n°3.


                                                                                                     8
1st Part: Basic benchmarking of energy consumption

            Collect activity indicators that might justify variations in electricity consumption

     Note any changes other that climate (process, adjustments) from one time period to another

             Collect electricity bills (prefer monthly to annual basis to get more accuracy)

           Draw the diagram: time period on the X-axis and kWh/time period on the Y-axis

       Try to explain variations in consumption thanks to previous changes or activity indicators

 If variations are unexplainable, call a professional (energy supplier, ESCO etc.) for an energy audit

         Try to continue that follow-up of energy consumption even if no problem is detected
                               Figure 4: First part of ACTION PLAN


3. Benchmark typical energy ratios

The lack of reference often leads us to think that everything is OK. The objectives of the second
part of that guide are to allow building owners to compare their energy consumption. Although it
is difficult, the idea of benchmarking is then to try to build “universal” indicators that can be
compared in the same activity sector whatever the building. To reach that independency from
the activity level, the best way is to calculate energy ratios (kWh/activity parameter/time period)
by dividing energy consumption of a system (building, energy use, equipment) during a certain
time period by one or more activity indicators.

The first task is to choose the best time period on which you will calculate energy ratios. Unless
you want to regularly follow-up your energy consumption because your activity parameters vary
strongly and frequently, it is useless to consider short time periods such as a week or a month.
Indeed, smaller is the reference more the climate dependence is relevant, so to choose monthly
reference allows to mitigate punctual peak or minimum of temperatures. Prefer typical time
periods such as a year or a season also in order to distinguish between heating and cooling
consumptions.

There exist an obvious relationship between the number of energy uses, their size and power
and the area of the building so that the most common indicator is the cooled area (in square-
meters). It can be used in every air-conditioned spaces especially buildings without specific
processes (office or residential buildings) where no other indicators are present.

Another obvious relationship exists between the area of the building and its occupancy
especially for constant occupancy buildings (no or limited numbers of external visitors) so that
the use of that indicator should then be equivalent to the use of square-meters. In practice, it is
not as clear (Figure 5) and the distinction between the two indicators allows sometimes to
maximize the information.


                                                                                                    9
30


                                                                                          25


                                                                   Permanent occupancy
                                                                                          20


                                                                                          15


                                                                                          10


                                                                                           5
                                                                                                                               Permanent occupancy = 0,0211 x Square-meters + 2,1101
                                                                                                                                                     2
                                                                                                                                                   R = 0,7038
                                                                                           0
                                                                                               0         100     200     300          400     500    600                               700       800   900   1000    1100   1200
                                                                                                                                                                                                 2
                                                                                                                                        Bank agency area (m )


                                         Figure 5: relationship between area and permanent occupancy in the banking sector.


Everybody knows that the more the activity level of a building, the higher its energy
consumption. Thermal uses are not an exception and energy consumption is correlated to
occupancy. For example, heat and humidity productions and inlets due to temporary occupancy
have to be fought against by air conditioning systems. As it is often difficult to count visitors of a
building during a time period, it is better use other indicators that are necessarily such as:
occupied beds in a hospitals, occupied bedrooms in hotels, students in schools, meals in
restaurants, tickets sold in museums or concert-halls etc… In case of variable occupancy, these
indicators should be used in addition to kWh/m2 ratios.

Keep in mind that benchmarking only provides valid results (Figure 6) for the same building on
several time periods or at least for the same category of buildings. Two buildings from the same
activity sector may have totally different energy ratios because of their different sizes. Indeed,
most processes, their intrinsic efficiencies and their control systems are often better in large-
scale buildings. Moreover, these ratios do not take into account the climate influence (outdoor
temperature, sun, wind etc…) on energy consumption so that comparisons of buildings in too
different locations may be analyzed carefully.


                               600                                                                                                                                                   50000

                               550
                                                                                                                                                                                     45000
                               500                                                         2003           2004         2005                                                                                            2003        2004        2005
                                                                                                                                                      Energy ratio (kWh/person.yr)
  Energy ratio (kWh/m2.year)


                                                                                                                                                                                     40000
                               450
                                                                                                                                                                                     35000
                               400

                               350                                                                                                                                                   30000

                               300                                                                                                                                                   25000
                               250
                                                                                                                                                                                     20000
                               200
                                                                                                                                                                                     15000
                               150

                               100                                                                                                                                                   10000

                                50                                                                                                                                                   5000

                                0
                                                                                                                                                                                        0
                                     0     100   200   300   400                         500       600   700     800   900     1000    1100   1200
                                                                                                                                                                                             0         5        10            15          20          25   30
                                                              Bank angency area (m2)                                                                                                                                   Agency staff


Figure 6: the kWh/m².year ratio decreases with the surface (left) and the staff (right) in the banking
                                             sector.


                                                                                                                                                                                                                                                            10
If your ratios (compare several ones) are lower than other building ratios or statistics, your
building seems energy-efficient and you have probably no action to carry out or investment to
make. Continue however to regularly follow-up your indicators to anticipate problems. In the
other case, you should probably contact a professional to consider some ways of improvements.


                               2nd Part: Benchmark typical energy ratios

           Choose main activity indicators that justify variations in electricity consumption

    Calculate electricity consumption on the time period (the same as the one used in statistics)

      For each activity indicator and the same time period, divide energy consumption by the
                                             indicator

                          Compare each ratio from one time period to another

                     Try to explain possible variations (climate, adjustments etc…)

                                      Compare each ratio to statistics

                 Try to explain possible differences (size, climate, adjustments etc…)

    If variations/differences are unexplainable, call a professional (energy supplier, ESCO etc.)
                                         for an energy audit

         Try to continue that benchmarking of energy ratios even if no problem is detected

              Figure 7 Second part of ACTION PLAN for benchmarking of energy ratios.


The EPlabel3 project has developed a simple software that records details of a building, its key
descriptors and its energy use and produces a summary of the measured annual energy
consumption and calculates Energy Performance indicators in units of total weighted energy per
m² of internal area. The software main idea is to label the building energy performance as
demanded in the European Energy Performance Building Directive, but it can be used to define
reference ratios (as built or operational rating) and visually describe the energy content of the
building.

4. Establish the climate based energy “signature” of the building

Previous energy ratios are climate dependent so that only statistical ranges are published.
Several climatic parameters (sun, wind, outdoor temperature, outdoor humidity) play an
important role in energy consumption of thermal uses. The objective of that paragraph is then to
determine the sensitivity of energy consumption to climate parameters. It is focused especially
on the outdoor temperature because that parameter is easier to feel and measure for a building
owner.

3
 EPLabel: A programme to deliver energy certificates based on measured energy consumption for display in Public
buildings across Europe within a harmonizing framework. http://www.eplabel.org/


                                                                                                            11
The particular interest of such a method is to distinguish between climate dependent energy
consumption (variable part) and them that are not (constant part). The building “signature” is
then a curve that describes in a unique way the behavior if the building as a function of a climatic
parameter. However, find a correlation between energy consumption and outdoor temperature
necessarily requires a representative dot scattering, in other words much more dots. Therefore,
monthly energy bills or weekly measurements should be preferred to annual energy bills. There
are three possibilities concerning the temperature: either measure it, or get free daily-averaged
measurements (can be found on the internet4) or pay for local hourly measurements (to national
weather institute).

Two climate indicators can be used in the energy signature. The first one is directly the averaged
outdoor temperature of the time period. As a consequence, the correlation function is growing for
cooling in summer and decreasing for heating in winter. The second indicator is degree-days
that can be calculated for heating (HDD) in winter and cooling (CDD) in summer. HDD
(respectively CDD) is the sum on the chosen time period (higher than a day) of the product of
“the number of days during the time period for which the outdoor temperature is lower
(respectively higher) than a reference value” by “the difference between the daily averaged
outdoor temperature and that reference value”. HDD (respectively CDD) represent how cold
(respectively hot) is a winter (respectively summer) time period.

The main difficulty of using degree-days is to choose the good reference temperature. In theory,
that value is the averaged temperature ensured only by the building shell without any additional
heating (or cooling) system. Logically, the balance temperature in winter is different from the one
in summer. For heating, the reference temperature is usually taken equal to 18°C in Europe. As
heat gains can contribute to about 3°C in buildings and due to the averaged decrease of building
shell thermal conductivity, the reference temperature for heating tends to rise. For cooling, the
same problem exist so that in large office buildings, air conditioning system may start for an
outdoor temperature of 14°C whereas in residential buildings, accounting less heat gains, the
reference temperature may reach 24°C. Observe that not knowing the "proper" base
temperature is, in practice, rarely a problem for detecting changes in consumption: energy
consumption correlates well with "wrong" degree-days - since degree-day values to different
base temperatures are strongly correlated with each other.

Once you got enough dots for your energy signature, you are able to detect rapidly drifts in
energy consumption due to some defaults compared to the past normal operation. It is thus
better to apply this method as soon as the start-up of a new thermal process in order to have
reference (without default) dots. The Figure 8 sums-up some of the typical defaults that can be
detected from an energy signature analysis.


4 For example, a French website centralizes several climate data in a lot of locations in the country
ahttp://www.meteociel.fr/climatologie/climato.php


                                                                                                  12
kWh/time unit
                kWh/time unit
                                  Reference                                  Tightness


                                     CDD/time unit                             CDD/time unit
                                 Problems on                               Default on
                kWh/time unit


                                                         kWh/time unit
                                  controls or                              the supply
                                thermal probes                              reduction
                                                                             system


                                     CDD/time unit                             CDD/time unit

                                Effects of                               Oversizing or
                kWh/time unit


                                                         kWh/time unit
                                                 Sun
                                  other                                  overcooling
                                 climate


                                                  Wind


                                     CDD/time unit                             CDD/time unit

Figure 8: Few problems that can be detected by the climate-based energy signature of a building.


That method works almost perfectly for heating and is often used in operation and maintenance
contracts with guarantee of results. However, it is not as accurate for cooling because of the
higher number and power of electrical auxiliaries, the stronger influence of humidity and solar
radiation on air conditioning and the non-uniformity of temperature and humidity set points in
buildings due to a lack of regulation.

Once the correlation between energy consumption and degree-days or average temperature is
established, climate independent energy ratios are directly available calculating the slope of the
curve. It is then possible to compare your building ratios with those from any other building
whatever their locations. Remember that measuring only the power absorbed by the considered
thermal use (an air conditioning system for example) allows to strongly limit the offset magnitude
of the curve and to better underline the effect of climate (slope) on energy consumption. Energy
bills are a mix of consumption from different uses attenuating the visibility of pure thermal uses.
Thus, always take care to the framework to compare ratios with statistics or between buildings.


                                                                                                13
3rd Part: climate based energy signature

       Determine the best time period (monthly/weekly for DD, daily for average temperature)

      Determine the best temperature reference (usually 18°C in winter, from 14°C to 24°C in
                                            summer)

     Measure/get average daily temperature or calculate/get degree-days for each time period

                      Separate cooling degree-days from heating degree-days

               Measure /get from the bills electricity consumption on each time period

     Draw the diagram for each time period: average temperature or DD on the X-axis and kWh
                                          on the Y-axis
         As soon as a season/year is complete, determine the (linear) regression between
                              consumption and climate parameters

         Try to find the reasons why a new dot is outside the scatter – If differences are too
     important, too frequent and unexplainable, call a professional (energy supplier, ESCO etc.)
                                         for an energy audit
     Calculate climate independent energy ratios (slope of the regression curve) in kWh/m2.DD

    Compare to statistics – Try to explain possible differences (size, activity, adjustments etc…)

                 Try to continue the energy signature even if no problem is detected

 Figure 9: Third part of ACTION PLAN for establishment and the use of the climate based energy
                                   signature of the building.


5. Establish the multi-parameter energy signature of the building

We showed that energy consumption were due to a lot of parameters and underlined especially
the influences of building parameters (area, staff), activity parameters (occupancy, production)
and climate. However, it is impossible to analyze one parameter independently of the others.
Concerning air conditioning for example, a more temperate climate than forecasts can be
compensated by a much higher occupancy than in normal conditions so that the only climate or
activity analysis will provide biased results. As all of these parameters have a common influence
on energy consumption, it is important to analyze their effects simultaneously. The idea of that
paragraph is then to find the energy signature of the building by considering not only the climate
but also main activity parameters (pure occupancy, indirect occupancy, production etc…).
Building parameters (surface, staff etc…) can be added in order to determine the energy
signature of several similar buildings of the same activity sector (see next example).

This method is exactly the same as the previous one but additional parameters are this time
included into the linear regression. As for climate parameters, building and activity parameters
must be measured precisely for each time period so that specific metrologies or procedures
should be set-up. Again, time periods must be short in order to get more dots and then accuracy.
Finally, to be able to find a correlation between consumption and all the parameters, you will


                                                                                               14
need at least as many time periods as parameters. For example, if the main parameters having
effects on your building energy consumption E are the degree-days DD and the occupancy O in
a supermarket, the regression method requires at least two time periods on which the
coordinates (E, DD, O) are distinct. However, to reach higher levels of representativeness, it is
better to scan a large range for every parameter.

For example, in the banking sector the information available for each agency is: area S, staff
Nwkr, the annual electricity consumption for three years and finally the location allowing to
calculate both cooling (CDD) and heating (HDD) annual degree-days. As building parameters
(area and staff) are constant for one agency in the time, they only intervene into the magnitude
of consumption but not in their variations with time. On the opposite, variations of cooling and
heating degree-days lead to variations in annual electricity consumption for one agency. As only
three dots were available for each agency, the results of each energy signature were neither
accurate nor representative. Although the approach is strictly the same, the energy signature
was applied not to each agency but to the whole banking sector including every agencies in
order to determine a general profile of electricity consumption. Several models were tested:
influence of the area (S), of the winter climate (HDD), of the summer climate (CDD), of both
winter and summer climates (H&CDD) depending on the type of heating system (joule or
reversible heat-pump), of the staff (Nwkr). The Table 2 presents both results and accuracy (R2)
obtained by such models. Obviously, the more the parameters, the more accurate but for
comparison purposes they cannot be all kept.

          Model (kWh/year)                    A            B              C             R²
            A.HDD.S+B                       0.101        11680                         0.67
         A.HDD.S+B.Nwkr+C                   0.047        3822           4652           0.77
            A.CDD.S+B                       0.411        27170                         0.27
         A.CDD.S+B.Nwkr+C                   0.139        4000           1766           0.64
  Heating by Joule effect (COP=1)
           A.H&CDD.S+B                      0.099        11481                         0.67
        A.H&CDD.S+B.Nwkr+C                 0.0461        3813           4700           0.77
  Heating by Heat Pump (COP=2.5)
           A.H&CDD.S+B                      0.099        11174                         0.68
        A.H&CDD.S+B.Nwkr+C                 0.0479        3700           4740           0.77
    Table 2: modeling of electricity consumption in the banking sector in France using a linear
                                         regression method


Once the multi-parameter energy signature of the building is established, drifts in energy
consumption generated by defaults may be detected as soon as new dots deviate from the
scatter. As for the simple climate base energy signature, energy ratios relative to each
parameter may be deduced from the correlation function calculated by extracting multiplier
coefficient before each variable.
Eventually, the DD regression not being be enough precise or of hard interpretation, it exists
other methods such as the CUSUM method5 that allow to reveal trends that are occurring in the
building energy performance that are not visible through the only regression method.


5 For more detail about the CUSUM method you can look at the: “CTG004- Degree days for energy
management — a practical introduction”, Carbon trust at http://www.carbontrust.co.uk/publications


                                                                                                  15
4th Part: multi-parameter energy signature

   Choose main activity and climate indicators that justify variations in electricity consumption

                     Determine the best time period (monthly, weekly, daily)

                    Measure/get every chosen indicators for each time period

            Measure/get from bills the electricity consumption of each time period
 If enough dots are available, establish the linear regression (E=Σai.Pi + b) between electricity
                            consumption E and every parameters Pi

Try to find the reasons why a new dot is outside the scatter – If differences are too important, too
frequent and unexplainable, call a professional (energy supplier, ESCO etc.) for an energy audit

                  Calculate energy ratios by extracting multiplier coefficients ai

  Compare to statistics – Try to explain possible differences (size, activity, adjustments etc…)

               Try to continue the energy signature even if no problem is detected

   Figure 10: fourth part of ACTION PLAN for establishment and the use of the multi-parameter
                                 energy signature of the building.


                                                                                                    16
Annex
1) Some EECCAC (Energy Efficiency and Certification of Central Air Conditioners - FINAL
                              REPORT - APRIL 2003)

       Ratios of total consumptions for EU 15 countries weighted all sectors and systems
                                                (kWh/m².year)
                                 Cooling       Heating       Cooling & Heating
                  Austria         26,1          147,1                173,2
                 Belgium          19,5          135,6                155,0
                Denmark           14,1          170,4                184,5
                 Finland          15,0          192,1                207,1
                  France          32,6          114,6                147,3
                Germany           22,8          152,6                175,3
                 Greece           48,3           97,2                145,4
                  Ireland         19,5          119,4                139,0
                    Italy         50,1           94,5                144,7
              Luxembourg          19,1          135,9                155,1
              Netherlands         17,7          136,0                153,7
                Portugal          49,7           96,0                145,7
                   Spain          81,5           28,5                110,0
                 Sweden           14,9          192,1                207,0
                     UK           19,7          119,5                139,2

Electricity consumption for cooling (system and auxiliaries) in offices buildings for CAV (Constant
                       Air Volume system) and RAC (room air conditioner)

                                            AC consumption (kWh/m2.year)
            Seville-CAV                               99,26
            London-CAV                                32,77
             Milan-CAV                                70,49
            Seville-RAC                               58,52
            London-RAC                                 8,39
             Milan-RAC                                28,53

         Some indicative ratios for air conditioning consumptions for UK different sectors
      (All ratios are based on         AC (kWh/m²)          AC (kWh/m²)          Ventilation
      based on cooled area)          Central systems      Packaged systems        (kWh/m²)
        Hospitals (all health
                                            94                   170                  71
                sector)
       Hotels/restaurant/bar                94                   170                  71
     Offices (commercial only)              49                   270                 117
             Commercial
                                           144                   123                  52
       establishments (retail)
         Collective housing
      Schools (all education)               94                   170                  71
                Leisure                     94                   170                  71
       Government buildings                 94                   170                  71
            Warehouses                      94                   170                  71


                                                                                                17
2) Some indicative ratios for French offices from an internal study of the Ecole de Mines:

                     Use                Additional remarks             Ratios
              All consumptions     The ratio take into account the      240
                                         climate correction
                                            kWh/m².year
            Heating and cooling    The ratio take into account the    150 - 170
                                         climate correction
                                            kWh/m².year
                  Cooling          The ratio take into account the     25 -50
                                         climate correction
                                            kWh/m².year
                   DHW                         kWh/m3                70 (electric)
                                                                      100-150
                  Lighting                 kWh/m².year                 40 - 65
                     Lift               As % of total energy              2
                                           consumption


                                                                                        18

More Related Content

Viewers also liked

Tg 2 auditing of acs and epbd
Tg 2 auditing of acs and epbdTg 2 auditing of acs and epbd
Tg 2 auditing of acs and epbdRoyal Mail
 
Phil Evans CV April 2012
Phil Evans CV April 2012Phil Evans CV April 2012
Phil Evans CV April 2012Royal Mail
 
Audit ac tech guide for owner manager of acs vol 1 are you sure you are not p...
Audit ac tech guide for owner manager of acs vol 1 are you sure you are not p...Audit ac tech guide for owner manager of acs vol 1 are you sure you are not p...
Audit ac tech guide for owner manager of acs vol 1 are you sure you are not p...Royal Mail
 
Retailer x distribution centre walkround energy survey april 2010
Retailer x distribution centre walkround energy survey april 2010Retailer x distribution centre walkround energy survey april 2010
Retailer x distribution centre walkround energy survey april 2010Royal Mail
 
Auditac tg 5 energy conservation opportunities
Auditac  tg 5 energy conservation opportunitiesAuditac  tg 5 energy conservation opportunities
Auditac tg 5 energy conservation opportunitiesRoyal Mail
 
Personal best simplified knsv
Personal best simplified knsvPersonal best simplified knsv
Personal best simplified knsvThai Le
 

Viewers also liked (6)

Tg 2 auditing of acs and epbd
Tg 2 auditing of acs and epbdTg 2 auditing of acs and epbd
Tg 2 auditing of acs and epbd
 
Phil Evans CV April 2012
Phil Evans CV April 2012Phil Evans CV April 2012
Phil Evans CV April 2012
 
Audit ac tech guide for owner manager of acs vol 1 are you sure you are not p...
Audit ac tech guide for owner manager of acs vol 1 are you sure you are not p...Audit ac tech guide for owner manager of acs vol 1 are you sure you are not p...
Audit ac tech guide for owner manager of acs vol 1 are you sure you are not p...
 
Retailer x distribution centre walkround energy survey april 2010
Retailer x distribution centre walkround energy survey april 2010Retailer x distribution centre walkround energy survey april 2010
Retailer x distribution centre walkround energy survey april 2010
 
Auditac tg 5 energy conservation opportunities
Auditac  tg 5 energy conservation opportunitiesAuditac  tg 5 energy conservation opportunities
Auditac tg 5 energy conservation opportunities
 
Personal best simplified knsv
Personal best simplified knsvPersonal best simplified knsv
Personal best simplified knsv
 

Similar to Benchmarking air conditioning energy use

2012 Critical Issues Summit Energy Panel, Part I
2012 Critical Issues Summit Energy Panel, Part I2012 Critical Issues Summit Energy Panel, Part I
2012 Critical Issues Summit Energy Panel, Part ISFMI
 
Generating, Cataloging and Applying Energy Efficiency Performance Standards
Generating, Cataloging and Applying Energy  Efficiency Performance StandardsGenerating, Cataloging and Applying Energy  Efficiency Performance Standards
Generating, Cataloging and Applying Energy Efficiency Performance StandardsMark Miller, P.E.
 
2012 Critical Issues Summit Energy Panel, Part I
2012 Critical Issues Summit Energy Panel, Part I2012 Critical Issues Summit Energy Panel, Part I
2012 Critical Issues Summit Energy Panel, Part ISFMI
 
Auditac tg4 prelim audit methodology for ac
Auditac tg4 prelim audit methodology for acAuditac tg4 prelim audit methodology for ac
Auditac tg4 prelim audit methodology for acRoyal Mail
 
Energy Saving Ideas Shakti Singh Chauhan
Energy Saving Ideas Shakti Singh ChauhanEnergy Saving Ideas Shakti Singh Chauhan
Energy Saving Ideas Shakti Singh ChauhanShakti Chauhan,MRICS
 
Lessons Learned from Meter Calibrated Energy Simulations of Multi-Unit Reside...
Lessons Learned from Meter Calibrated Energy Simulations of Multi-Unit Reside...Lessons Learned from Meter Calibrated Energy Simulations of Multi-Unit Reside...
Lessons Learned from Meter Calibrated Energy Simulations of Multi-Unit Reside...RDH Building Science
 
Multi-agent Control of Thermal Systems in Buildings
Multi-agent Control of Thermal Systems in BuildingsMulti-agent Control of Thermal Systems in Buildings
Multi-agent Control of Thermal Systems in BuildingsBenoit Lacroix
 
3.1-General-energy-efficiency-measures-in-buildings-rev.pptx
3.1-General-energy-efficiency-measures-in-buildings-rev.pptx3.1-General-energy-efficiency-measures-in-buildings-rev.pptx
3.1-General-energy-efficiency-measures-in-buildings-rev.pptxMekarMeina
 
Making Sense of Metering Data
Making Sense of Metering DataMaking Sense of Metering Data
Making Sense of Metering DataCharles Simchick
 
Numerical simulation of Hybrid Generation System: a case study
Numerical simulation of Hybrid Generation System: a case studyNumerical simulation of Hybrid Generation System: a case study
Numerical simulation of Hybrid Generation System: a case studyIRJET Journal
 
Energy planing and auditing
Energy planing and auditingEnergy planing and auditing
Energy planing and auditingprabinshrestha77
 
Introduction to ee measures evaluation
Introduction to ee measures evaluationIntroduction to ee measures evaluation
Introduction to ee measures evaluationRCREEE
 
Use of a Weather Generator for analysis of projections of future daily temper...
Use of a Weather Generator for analysis of projections of future daily temper...Use of a Weather Generator for analysis of projections of future daily temper...
Use of a Weather Generator for analysis of projections of future daily temper...Emanuele Cordano
 
Operational and Embodied Energy in three houses
Operational and Embodied Energy in three housesOperational and Embodied Energy in three houses
Operational and Embodied Energy in three housesjpcardenas
 
Human Habits and Energy Consumption in Residential Buildings
Human Habits and Energy Consumption in Residential BuildingsHuman Habits and Energy Consumption in Residential Buildings
Human Habits and Energy Consumption in Residential BuildingsLeonardo ENERGY
 
C lorenzo energies_04114'20
C lorenzo energies_04114'20C lorenzo energies_04114'20
C lorenzo energies_04114'20Regina Schwald
 

Similar to Benchmarking air conditioning energy use (20)

2012 Critical Issues Summit Energy Panel, Part I
2012 Critical Issues Summit Energy Panel, Part I2012 Critical Issues Summit Energy Panel, Part I
2012 Critical Issues Summit Energy Panel, Part I
 
Generating, Cataloging and Applying Energy Efficiency Performance Standards
Generating, Cataloging and Applying Energy  Efficiency Performance StandardsGenerating, Cataloging and Applying Energy  Efficiency Performance Standards
Generating, Cataloging and Applying Energy Efficiency Performance Standards
 
2012 Critical Issues Summit Energy Panel, Part I
2012 Critical Issues Summit Energy Panel, Part I2012 Critical Issues Summit Energy Panel, Part I
2012 Critical Issues Summit Energy Panel, Part I
 
Auditac tg4 prelim audit methodology for ac
Auditac tg4 prelim audit methodology for acAuditac tg4 prelim audit methodology for ac
Auditac tg4 prelim audit methodology for ac
 
Energy Saving Ideas Shakti Singh Chauhan
Energy Saving Ideas Shakti Singh ChauhanEnergy Saving Ideas Shakti Singh Chauhan
Energy Saving Ideas Shakti Singh Chauhan
 
Energy Auditing 101
Energy Auditing 101Energy Auditing 101
Energy Auditing 101
 
Energy audit
Energy auditEnergy audit
Energy audit
 
Lessons Learned from Meter Calibrated Energy Simulations of Multi-Unit Reside...
Lessons Learned from Meter Calibrated Energy Simulations of Multi-Unit Reside...Lessons Learned from Meter Calibrated Energy Simulations of Multi-Unit Reside...
Lessons Learned from Meter Calibrated Energy Simulations of Multi-Unit Reside...
 
Multi-agent Control of Thermal Systems in Buildings
Multi-agent Control of Thermal Systems in BuildingsMulti-agent Control of Thermal Systems in Buildings
Multi-agent Control of Thermal Systems in Buildings
 
3.1-General-energy-efficiency-measures-in-buildings-rev.pptx
3.1-General-energy-efficiency-measures-in-buildings-rev.pptx3.1-General-energy-efficiency-measures-in-buildings-rev.pptx
3.1-General-energy-efficiency-measures-in-buildings-rev.pptx
 
Making Sense of Metering Data
Making Sense of Metering DataMaking Sense of Metering Data
Making Sense of Metering Data
 
UNIT 1.pptx
UNIT 1.pptxUNIT 1.pptx
UNIT 1.pptx
 
Numerical simulation of Hybrid Generation System: a case study
Numerical simulation of Hybrid Generation System: a case studyNumerical simulation of Hybrid Generation System: a case study
Numerical simulation of Hybrid Generation System: a case study
 
ENEA My Activities
ENEA My ActivitiesENEA My Activities
ENEA My Activities
 
Energy planing and auditing
Energy planing and auditingEnergy planing and auditing
Energy planing and auditing
 
Introduction to ee measures evaluation
Introduction to ee measures evaluationIntroduction to ee measures evaluation
Introduction to ee measures evaluation
 
Use of a Weather Generator for analysis of projections of future daily temper...
Use of a Weather Generator for analysis of projections of future daily temper...Use of a Weather Generator for analysis of projections of future daily temper...
Use of a Weather Generator for analysis of projections of future daily temper...
 
Operational and Embodied Energy in three houses
Operational and Embodied Energy in three housesOperational and Embodied Energy in three houses
Operational and Embodied Energy in three houses
 
Human Habits and Energy Consumption in Residential Buildings
Human Habits and Energy Consumption in Residential BuildingsHuman Habits and Energy Consumption in Residential Buildings
Human Habits and Energy Consumption in Residential Buildings
 
C lorenzo energies_04114'20
C lorenzo energies_04114'20C lorenzo energies_04114'20
C lorenzo energies_04114'20
 

More from Royal Mail

Sample energy survey overview
Sample energy survey overviewSample energy survey overview
Sample energy survey overviewRoyal Mail
 
Managing energy consumption to improve forecasting checklist
Managing energy consumption to improve forecasting checklistManaging energy consumption to improve forecasting checklist
Managing energy consumption to improve forecasting checklistRoyal Mail
 
Comfortable energy reduction checklist
Comfortable energy reduction checklistComfortable energy reduction checklist
Comfortable energy reduction checklistRoyal Mail
 
Best practice checklist
Best practice checklistBest practice checklist
Best practice checklistRoyal Mail
 
Carbon footprinting checklist
Carbon footprinting checklistCarbon footprinting checklist
Carbon footprinting checklistRoyal Mail
 
Marcus evans workshop presentation
Marcus evans workshop presentationMarcus evans workshop presentation
Marcus evans workshop presentationRoyal Mail
 
Luxury flats energy survey report
Luxury flats energy survey reportLuxury flats energy survey report
Luxury flats energy survey reportRoyal Mail
 
Purpose pyramid sept 2011
Purpose pyramid sept 2011Purpose pyramid sept 2011
Purpose pyramid sept 2011Royal Mail
 
Sample building energy performance proposal jan 2012
Sample building energy performance proposal jan 2012Sample building energy performance proposal jan 2012
Sample building energy performance proposal jan 2012Royal Mail
 
Phil Evans CV January 2012
Phil Evans CV January 2012Phil Evans CV January 2012
Phil Evans CV January 2012Royal Mail
 
Auditac tg 5 energy conservation opportunities
Auditac  tg 5 energy conservation opportunitiesAuditac  tg 5 energy conservation opportunities
Auditac tg 5 energy conservation opportunitiesRoyal Mail
 
Auditac tg 6 how to benefit from eurovent cert database and retrieve past eq...
Auditac  tg 6 how to benefit from eurovent cert database and retrieve past eq...Auditac  tg 6 how to benefit from eurovent cert database and retrieve past eq...
Auditac tg 6 how to benefit from eurovent cert database and retrieve past eq...Royal Mail
 
Auditac tg8 how manufacturers could help auditors
Auditac tg8 how manufacturers could help auditorsAuditac tg8 how manufacturers could help auditors
Auditac tg8 how manufacturers could help auditorsRoyal Mail
 
Auditac tg 9 how to integrate eneff and aci with full benefit in the structur...
Auditac tg 9 how to integrate eneff and aci with full benefit in the structur...Auditac tg 9 how to integrate eneff and aci with full benefit in the structur...
Auditac tg 9 how to integrate eneff and aci with full benefit in the structur...Royal Mail
 
Auditac tg10 case studies
Auditac  tg10 case studiesAuditac  tg10 case studies
Auditac tg10 case studiesRoyal Mail
 
Auditac carbon and cooling in uk office environments dunn knight
Auditac carbon and cooling in uk office environments dunn knightAuditac carbon and cooling in uk office environments dunn knight
Auditac carbon and cooling in uk office environments dunn knightRoyal Mail
 
Sample energy saving proposal
Sample energy saving proposalSample energy saving proposal
Sample energy saving proposalRoyal Mail
 
Retailer x distribution centre walkround energy survey april 2010
Retailer x distribution centre walkround energy survey april 2010Retailer x distribution centre walkround energy survey april 2010
Retailer x distribution centre walkround energy survey april 2010Royal Mail
 

More from Royal Mail (18)

Sample energy survey overview
Sample energy survey overviewSample energy survey overview
Sample energy survey overview
 
Managing energy consumption to improve forecasting checklist
Managing energy consumption to improve forecasting checklistManaging energy consumption to improve forecasting checklist
Managing energy consumption to improve forecasting checklist
 
Comfortable energy reduction checklist
Comfortable energy reduction checklistComfortable energy reduction checklist
Comfortable energy reduction checklist
 
Best practice checklist
Best practice checklistBest practice checklist
Best practice checklist
 
Carbon footprinting checklist
Carbon footprinting checklistCarbon footprinting checklist
Carbon footprinting checklist
 
Marcus evans workshop presentation
Marcus evans workshop presentationMarcus evans workshop presentation
Marcus evans workshop presentation
 
Luxury flats energy survey report
Luxury flats energy survey reportLuxury flats energy survey report
Luxury flats energy survey report
 
Purpose pyramid sept 2011
Purpose pyramid sept 2011Purpose pyramid sept 2011
Purpose pyramid sept 2011
 
Sample building energy performance proposal jan 2012
Sample building energy performance proposal jan 2012Sample building energy performance proposal jan 2012
Sample building energy performance proposal jan 2012
 
Phil Evans CV January 2012
Phil Evans CV January 2012Phil Evans CV January 2012
Phil Evans CV January 2012
 
Auditac tg 5 energy conservation opportunities
Auditac  tg 5 energy conservation opportunitiesAuditac  tg 5 energy conservation opportunities
Auditac tg 5 energy conservation opportunities
 
Auditac tg 6 how to benefit from eurovent cert database and retrieve past eq...
Auditac  tg 6 how to benefit from eurovent cert database and retrieve past eq...Auditac  tg 6 how to benefit from eurovent cert database and retrieve past eq...
Auditac tg 6 how to benefit from eurovent cert database and retrieve past eq...
 
Auditac tg8 how manufacturers could help auditors
Auditac tg8 how manufacturers could help auditorsAuditac tg8 how manufacturers could help auditors
Auditac tg8 how manufacturers could help auditors
 
Auditac tg 9 how to integrate eneff and aci with full benefit in the structur...
Auditac tg 9 how to integrate eneff and aci with full benefit in the structur...Auditac tg 9 how to integrate eneff and aci with full benefit in the structur...
Auditac tg 9 how to integrate eneff and aci with full benefit in the structur...
 
Auditac tg10 case studies
Auditac  tg10 case studiesAuditac  tg10 case studies
Auditac tg10 case studies
 
Auditac carbon and cooling in uk office environments dunn knight
Auditac carbon and cooling in uk office environments dunn knightAuditac carbon and cooling in uk office environments dunn knight
Auditac carbon and cooling in uk office environments dunn knight
 
Sample energy saving proposal
Sample energy saving proposalSample energy saving proposal
Sample energy saving proposal
 
Retailer x distribution centre walkround energy survey april 2010
Retailer x distribution centre walkround energy survey april 2010Retailer x distribution centre walkround energy survey april 2010
Retailer x distribution centre walkround energy survey april 2010
 

Recently uploaded

08448380779 Call Girls In Diplomatic Enclave Women Seeking Men
08448380779 Call Girls In Diplomatic Enclave Women Seeking Men08448380779 Call Girls In Diplomatic Enclave Women Seeking Men
08448380779 Call Girls In Diplomatic Enclave Women Seeking MenDelhi Call girls
 
#StandardsGoals for 2024: What’s new for BISAC - Tech Forum 2024
#StandardsGoals for 2024: What’s new for BISAC - Tech Forum 2024#StandardsGoals for 2024: What’s new for BISAC - Tech Forum 2024
#StandardsGoals for 2024: What’s new for BISAC - Tech Forum 2024BookNet Canada
 
New from BookNet Canada for 2024: BNC BiblioShare - Tech Forum 2024
New from BookNet Canada for 2024: BNC BiblioShare - Tech Forum 2024New from BookNet Canada for 2024: BNC BiblioShare - Tech Forum 2024
New from BookNet Canada for 2024: BNC BiblioShare - Tech Forum 2024BookNet Canada
 
Enhancing Worker Digital Experience: A Hands-on Workshop for Partners
Enhancing Worker Digital Experience: A Hands-on Workshop for PartnersEnhancing Worker Digital Experience: A Hands-on Workshop for Partners
Enhancing Worker Digital Experience: A Hands-on Workshop for PartnersThousandEyes
 
Unblocking The Main Thread Solving ANRs and Frozen Frames
Unblocking The Main Thread Solving ANRs and Frozen FramesUnblocking The Main Thread Solving ANRs and Frozen Frames
Unblocking The Main Thread Solving ANRs and Frozen FramesSinan KOZAK
 
Pigging Solutions Piggable Sweeping Elbows
Pigging Solutions Piggable Sweeping ElbowsPigging Solutions Piggable Sweeping Elbows
Pigging Solutions Piggable Sweeping ElbowsPigging Solutions
 
Breaking the Kubernetes Kill Chain: Host Path Mount
Breaking the Kubernetes Kill Chain: Host Path MountBreaking the Kubernetes Kill Chain: Host Path Mount
Breaking the Kubernetes Kill Chain: Host Path MountPuma Security, LLC
 
Injustice - Developers Among Us (SciFiDevCon 2024)
Injustice - Developers Among Us (SciFiDevCon 2024)Injustice - Developers Among Us (SciFiDevCon 2024)
Injustice - Developers Among Us (SciFiDevCon 2024)Allon Mureinik
 
My Hashitalk Indonesia April 2024 Presentation
My Hashitalk Indonesia April 2024 PresentationMy Hashitalk Indonesia April 2024 Presentation
My Hashitalk Indonesia April 2024 PresentationRidwan Fadjar
 
Tech-Forward - Achieving Business Readiness For Copilot in Microsoft 365
Tech-Forward - Achieving Business Readiness For Copilot in Microsoft 365Tech-Forward - Achieving Business Readiness For Copilot in Microsoft 365
Tech-Forward - Achieving Business Readiness For Copilot in Microsoft 3652toLead Limited
 
Kotlin Multiplatform & Compose Multiplatform - Starter kit for pragmatics
Kotlin Multiplatform & Compose Multiplatform - Starter kit for pragmaticsKotlin Multiplatform & Compose Multiplatform - Starter kit for pragmatics
Kotlin Multiplatform & Compose Multiplatform - Starter kit for pragmaticscarlostorres15106
 
FULL ENJOY 🔝 8264348440 🔝 Call Girls in Diplomatic Enclave | Delhi
FULL ENJOY 🔝 8264348440 🔝 Call Girls in Diplomatic Enclave | DelhiFULL ENJOY 🔝 8264348440 🔝 Call Girls in Diplomatic Enclave | Delhi
FULL ENJOY 🔝 8264348440 🔝 Call Girls in Diplomatic Enclave | Delhisoniya singh
 
The Codex of Business Writing Software for Real-World Solutions 2.pptx
The Codex of Business Writing Software for Real-World Solutions 2.pptxThe Codex of Business Writing Software for Real-World Solutions 2.pptx
The Codex of Business Writing Software for Real-World Solutions 2.pptxMalak Abu Hammad
 
Unlocking the Potential of the Cloud for IBM Power Systems
Unlocking the Potential of the Cloud for IBM Power SystemsUnlocking the Potential of the Cloud for IBM Power Systems
Unlocking the Potential of the Cloud for IBM Power SystemsPrecisely
 
Swan(sea) Song – personal research during my six years at Swansea ... and bey...
Swan(sea) Song – personal research during my six years at Swansea ... and bey...Swan(sea) Song – personal research during my six years at Swansea ... and bey...
Swan(sea) Song – personal research during my six years at Swansea ... and bey...Alan Dix
 
Are Multi-Cloud and Serverless Good or Bad?
Are Multi-Cloud and Serverless Good or Bad?Are Multi-Cloud and Serverless Good or Bad?
Are Multi-Cloud and Serverless Good or Bad?Mattias Andersson
 
Pigging Solutions in Pet Food Manufacturing
Pigging Solutions in Pet Food ManufacturingPigging Solutions in Pet Food Manufacturing
Pigging Solutions in Pet Food ManufacturingPigging Solutions
 
Presentation on how to chat with PDF using ChatGPT code interpreter
Presentation on how to chat with PDF using ChatGPT code interpreterPresentation on how to chat with PDF using ChatGPT code interpreter
Presentation on how to chat with PDF using ChatGPT code interpreternaman860154
 
Understanding the Laravel MVC Architecture
Understanding the Laravel MVC ArchitectureUnderstanding the Laravel MVC Architecture
Understanding the Laravel MVC ArchitecturePixlogix Infotech
 

Recently uploaded (20)

08448380779 Call Girls In Diplomatic Enclave Women Seeking Men
08448380779 Call Girls In Diplomatic Enclave Women Seeking Men08448380779 Call Girls In Diplomatic Enclave Women Seeking Men
08448380779 Call Girls In Diplomatic Enclave Women Seeking Men
 
#StandardsGoals for 2024: What’s new for BISAC - Tech Forum 2024
#StandardsGoals for 2024: What’s new for BISAC - Tech Forum 2024#StandardsGoals for 2024: What’s new for BISAC - Tech Forum 2024
#StandardsGoals for 2024: What’s new for BISAC - Tech Forum 2024
 
New from BookNet Canada for 2024: BNC BiblioShare - Tech Forum 2024
New from BookNet Canada for 2024: BNC BiblioShare - Tech Forum 2024New from BookNet Canada for 2024: BNC BiblioShare - Tech Forum 2024
New from BookNet Canada for 2024: BNC BiblioShare - Tech Forum 2024
 
Enhancing Worker Digital Experience: A Hands-on Workshop for Partners
Enhancing Worker Digital Experience: A Hands-on Workshop for PartnersEnhancing Worker Digital Experience: A Hands-on Workshop for Partners
Enhancing Worker Digital Experience: A Hands-on Workshop for Partners
 
Unblocking The Main Thread Solving ANRs and Frozen Frames
Unblocking The Main Thread Solving ANRs and Frozen FramesUnblocking The Main Thread Solving ANRs and Frozen Frames
Unblocking The Main Thread Solving ANRs and Frozen Frames
 
Pigging Solutions Piggable Sweeping Elbows
Pigging Solutions Piggable Sweeping ElbowsPigging Solutions Piggable Sweeping Elbows
Pigging Solutions Piggable Sweeping Elbows
 
Breaking the Kubernetes Kill Chain: Host Path Mount
Breaking the Kubernetes Kill Chain: Host Path MountBreaking the Kubernetes Kill Chain: Host Path Mount
Breaking the Kubernetes Kill Chain: Host Path Mount
 
Injustice - Developers Among Us (SciFiDevCon 2024)
Injustice - Developers Among Us (SciFiDevCon 2024)Injustice - Developers Among Us (SciFiDevCon 2024)
Injustice - Developers Among Us (SciFiDevCon 2024)
 
My Hashitalk Indonesia April 2024 Presentation
My Hashitalk Indonesia April 2024 PresentationMy Hashitalk Indonesia April 2024 Presentation
My Hashitalk Indonesia April 2024 Presentation
 
Tech-Forward - Achieving Business Readiness For Copilot in Microsoft 365
Tech-Forward - Achieving Business Readiness For Copilot in Microsoft 365Tech-Forward - Achieving Business Readiness For Copilot in Microsoft 365
Tech-Forward - Achieving Business Readiness For Copilot in Microsoft 365
 
Kotlin Multiplatform & Compose Multiplatform - Starter kit for pragmatics
Kotlin Multiplatform & Compose Multiplatform - Starter kit for pragmaticsKotlin Multiplatform & Compose Multiplatform - Starter kit for pragmatics
Kotlin Multiplatform & Compose Multiplatform - Starter kit for pragmatics
 
Vulnerability_Management_GRC_by Sohang Sengupta.pptx
Vulnerability_Management_GRC_by Sohang Sengupta.pptxVulnerability_Management_GRC_by Sohang Sengupta.pptx
Vulnerability_Management_GRC_by Sohang Sengupta.pptx
 
FULL ENJOY 🔝 8264348440 🔝 Call Girls in Diplomatic Enclave | Delhi
FULL ENJOY 🔝 8264348440 🔝 Call Girls in Diplomatic Enclave | DelhiFULL ENJOY 🔝 8264348440 🔝 Call Girls in Diplomatic Enclave | Delhi
FULL ENJOY 🔝 8264348440 🔝 Call Girls in Diplomatic Enclave | Delhi
 
The Codex of Business Writing Software for Real-World Solutions 2.pptx
The Codex of Business Writing Software for Real-World Solutions 2.pptxThe Codex of Business Writing Software for Real-World Solutions 2.pptx
The Codex of Business Writing Software for Real-World Solutions 2.pptx
 
Unlocking the Potential of the Cloud for IBM Power Systems
Unlocking the Potential of the Cloud for IBM Power SystemsUnlocking the Potential of the Cloud for IBM Power Systems
Unlocking the Potential of the Cloud for IBM Power Systems
 
Swan(sea) Song – personal research during my six years at Swansea ... and bey...
Swan(sea) Song – personal research during my six years at Swansea ... and bey...Swan(sea) Song – personal research during my six years at Swansea ... and bey...
Swan(sea) Song – personal research during my six years at Swansea ... and bey...
 
Are Multi-Cloud and Serverless Good or Bad?
Are Multi-Cloud and Serverless Good or Bad?Are Multi-Cloud and Serverless Good or Bad?
Are Multi-Cloud and Serverless Good or Bad?
 
Pigging Solutions in Pet Food Manufacturing
Pigging Solutions in Pet Food ManufacturingPigging Solutions in Pet Food Manufacturing
Pigging Solutions in Pet Food Manufacturing
 
Presentation on how to chat with PDF using ChatGPT code interpreter
Presentation on how to chat with PDF using ChatGPT code interpreterPresentation on how to chat with PDF using ChatGPT code interpreter
Presentation on how to chat with PDF using ChatGPT code interpreter
 
Understanding the Laravel MVC Architecture
Understanding the Laravel MVC ArchitectureUnderstanding the Laravel MVC Architecture
Understanding the Laravel MVC Architecture
 

Benchmarking air conditioning energy use

  • 1. Technical guides for owner/manager of an air conditioning system: volume 7 A benchmarking guide adapted to air conditioning based on electricity bills 1
  • 2. Team France (Project coordinator) Armines - Mines de Paris Austria Slovenia Austrian Energy Agency University of Ljubljana Belgium UK Université de Liège Association of Building Engineers Italy BRE Politecnico di Torino (Building Research Establishment Ltd) Portugal University of Porto Welsh School of Architecture Eurovent-Certification Authors of this volume Jérôme ADNOT (Armines, France) Daniela BORY (Armines, France) Maxime DUPONT (Armines, France) Roger HITCHIN (BRE, UK) The sole responsibility for the content of this publication lies with the authors. It does not represent the opinion of the European Communities. The European Commission is not responsible for any use that may be made of the information contained therein. 2
  • 3. Objectives of the guide The objective of this guide is mainly to help building owners to detect changes in energy consumption of their air conditioning plant as a first step in identifying and correcting faults. Even in the absence of obvious faults , building owners should monitor energy consumption and be alert for early signs of problems. This will enable them to react promptly through behavioral changes, operational changes (system adjustments), investment in component replacement or in extreme cases with a complete retrofit. When changes have been introduced, monitoring allows the effectiveness and actual payback times to be assessed for future use. In order to help the managers an action plan has been defined: a complete scheme of the plan is reported in the next page and it is detailed all along the document. Moreover, some example of ratios of energy consumption are presented in the annex as indicative values that should be considered for their order of magnitude more than the value itself. 3
  • 4. ACTION PLAN PRELIMINARY ACTIONS Determine the electricity uses included in the bill in general Collect electricity bills (prefer monthly to annual basis to get more accuracy) Determine parameters having effect on electricity consumption in general 1st Part: Basic benchmarking of 2nd Part: Benchmark typical energy 3rd Part: climate based energy 4th Part: multi-parameter energy energy consumption ratios signature signature Collect activity indicators that might Choose main activity indicators that Determine the best time period Choose main activity and climate justify variations in electricity justify variations in electricity (monthly/weekly for DD, daily for average indicators that justify variations in consumption consumption temperature) electricity consumption Note any changes other that climate Calculate electricity consumption on the Determine the best temperature reference Determine the best time period (monthly, (process, adjustments) from one time time period (the same as the one used in (usually 18°C in winter, from 14°C to 24°C weekly, daily) period to another statistics) in summer) Measure/get every chosen indicators for Collect electricity bills (prefer monthly For each activity indicator and the same Measure/get average daily temperature or each time period to annual basis to get more accuracy) time period, divide energy consumption calculate/get degree-days for each time by the indicator period Measure/get from bills the electricity Draw the diagram: time period on the consumption of each time period X-axis and kWh/time period on the Y- Compare each ratio from one time period Separate cooling degree-days from If enough dots are available, establish axis to another heating degree-days the linear regression (E=Σai.Pi + b) between electricity consumption E and Try to explain variations in Try to explain possible variations Measure /get from the bills electricity every parameters Pi consumption thanks to previous (climate, adjustments etc…) consumption on each time period changes or activity indicators Try to find the reasons why a new dot is Compare each ratio to statistics Draw the diagram for each time period: outside the scatter – If differences are If variations are unexplainable, call a average temperature or DD on the X-axis too important, too frequent and professional (energy supplier, ESCO Try to explain possible differences (size, and kWh on the Y-axis unexplainable, call a professional etc.) for an energy audit climate, adjustments etc…) As soon as a season/year is complete, (energy supplier, ESCO etc.) for an determine the (linear) regression between energy audit Try to continue that follow-up of If variations/differences are consumption and climate parameters energy consumption even if no unexplainable, call a professional Calculate energy ratios by extracting problem is detected (energy supplier, ESCO etc.) for an Try to find the reasons why a new dot is multiplier coefficients ai energy audit outside the scatter – If differences are too important, too frequent and Compare to statistics – Try to explain Try to continue that benchmarking of unexplainable, call a professional (energy possible differences (size, activity, energy ratios even if no problem is supplier, ESCO etc.) for an energy audit adjustments etc…) detected Calculate climate independent energy ratios (slope of the regression curve) in Try to continue the energy signature kWh/m2.DD even if no problem is detected Compare to statistics – Try to explain possible differences (size, activity, adjustments etc…) 4
  • 5. 1. Pre-requisite Energy uses having effect on the electricity bill of a building Any building owner must be aware that, for more accuracy, direct measurements on individual items of equipment (chiller for example) or energy use (lighting for example) - which may need to be organized by himself – are preferable overall utility energy bills. The latter combine energy consumption by numerous end-uses and may relate to time periods that are not ideal for monitoring purposes. The total electricity bill mainly includes the consumption of lighting, ventilating and small power appliances (kitchen or office equipments, HI-FI etc…) and sometimes process loads such as air compressors, pumps, fans etc…Air conditioning, is included because non-electric cooling is rare. Building heating and domestic water heating can also be provided by the Joule effect (direct electric) or with a heat pump. However these two activities often use fossil fuels and are then accounted in a separate bill. Interpretation of electricity bills requires the listing of each type of electrical appliances whose consumption is included in the energy bill. When possible, try to evaluate the electrical power they absorb in operation by looking at their electrical plate or documentation (see Table 1). Appliances type Number of Electric unit Operation hours Energy (kWh) equipments power Computers 40 300 4380 13140 Printers type A 10 400 500 2000 (20 stand by) 1000 200 Bulbs type X 50 60 5000 3000 Bulbs type Y 10 100 5000 5000 Neon type Z 70 40 1540 616 Electric heaters 10 1200 2500 30000 Etc. …. … … … Total energy (kWh) xxx Table 1 An example of listing the electric appliances and their nominal power. It is important also to estimate the number of hours they operate during the period covered by the meter readings.. Absorbed power and time of operation can be used to estimate the energy consumption. The total amount of energy calculated should be compared to the actual measured consumption in order to verify the consistency of the list and its exhaustiveness. Keep in mind that the analysis of air conditioning performances using global energy bills will be accurate only if the share of air conditioning energy consumption in the bill is significant. If energy consumption for cooling is submerged by that from other uses, accurate estimation will be impossible without sub-metering. Parameters having effects on air conditioning energy consumption Several parameters have effects on air conditioning energy consumption and more generally on all thermal energy consumption. It is possible to distinguish four types: 5
  • 6. - Building parameters are intrinsic to the construction of the building. The building shell thermal characteristics, the glazing surface, heated/cooled areas and their location are part of them. They were fixed by the first owner of the building and are difficult for following building owners to change because of the costs of retrofits and relatively long payback times. - Policy parameters depend only on the current building owner’s decisions and his will to save energy. Equipment choices and investments, operational parameters such as temperature and humidity set points (if building centralized), the time of operation or maintenance and follow-up policies are among them. The sensitivity of energy consumption to these parameters is really important. - Behavioral parameters depend on the occupants’ choices. Operational parameters such as temperature and humidity set points (if room localized) or the natural uneconomic behavior of occupants are part of them. Their influence on energy consumption can be large although the duration of the “good practice” behavior can be short. - Activity parameters depend mostly on the use of each space . These are largely determined by the business needs of the organization. They have an important influence on energy consumption but a building owner or energy manager cannot usually change them. Interpretation requires the identification of the most important parameters affecting each type of energy consumption. Special attention must be paid to causes that might be improved by the building owner. These are then the preliminary actions to develop in order to begin the analysis of the energy consumption of the building and are necessary to all the processes developed in the following paragraphs. PRELIMINARY ACTIONS Determine the electricity uses included in the bill in general Collect electricity bills (prefer monthly to annual basis to get more accuracy) Determine parameters having effect on electricity consumption in general Figure 1: Preliminary part of ACTION PLAN 6
  • 7. 2. Basic benchmarking of energy consumption With such numerous parameters, it is clear that the energy consumption of buildings can differ strongly. The first part of this guide is dedicated to the simple follow-up of energy consumption of one building from one time period to another. Most of owners only focus on energy bills at the building level looking almost only at the amount of money they pay, but several factors should be considered when comparing bills such as energy prices (that vary in general form one year to another), climate effects, activity and changes in the building structure, operation etc. Thinking about energy uses can bring however a lot of additional information. After listing energy uses and influent parameters, it is important for a building owner to determine the optimal measurement frequency (less than an hourly, hourly, daily, weekly, monthly, yearly etc…). The objective is to maximize the information available while minimizing the quantity of measurements and associated costs. Again, when certain parameters (climate for example) vary a lot, it is relevant to reduce the time period to get more accuracy. Prefer therefore monthly billing to yearly billing for thermal uses. If it is not possible, try to make your own measurement using additional metrology (general meter, sub-meter, portable metrology). As soon as consumption of at least two time periods for the same building are available, you can begin the comparison. The objective of such a follow-up is not only to be aware of variations in energy consumption but also to look at parameters responsible of such variations. Logically if thermal uses (pure cooling system, joule effect heating or reversible heat-pump) are not negligible in the bill in comparison to process uses, electricity consumption must be maximal in summer (July or August) and in winter (December, January or February). Therefore, detect possible problems on energy consumption magnitudes and variations with time by trying to explain the bill through the main influent parameters you found previously. Once the responsible parameters are underlined, think to possible actions that would allow optimizing energy consumption1 or call a professional to assist you and perform a detailed energy audit. Observe for example the variations of annual electricity consumption in some banking agencies (Figure 2). Electricity uses (office equipments, cash dispensers, lighting, HVAC) are known and unlikely to change unless in terms of quantity especially for cash dispensers. Opening hours are constant from one year to another in a bank agency so that electrical appliances operate for the same duration each year. On these examples, the area of the bank agencies and the staff are unchanged from one year to another. The only parameters that can explain such variations could be: activity variations of the agency (customers?), process changes (quantity, type?), operational changes (temperature set-points, operating hours?) or climate variations (winter, summer or both?). In that case, the agency manager is finally the best person able to determine the origins of these variations, to know if they are normal or not and to decide to carry out actions. 1 You can consult for a full list of Energy conservation opportunities the ECOs list on the AuditAC web site and the AuditAC technical guide 5 - ECOs for AC auditors. 7
  • 8. Figure 2: Examples of variations in annual electricity consumption in some banking agencies. Then observe for example the variations of monthly gas and electricity consumption in a service building in Portugal. Of course the use of gas is related only with the winter season and because the building is air conditioned all along the summer season, monthly consumptions are related to the weather. Figure 3: Examples of variations in annual gas and electricity consumption in a library in Portugal2. 2 AuditAC Case studies brochure: Case studies: Portugal, n°3. 8
  • 9. 1st Part: Basic benchmarking of energy consumption Collect activity indicators that might justify variations in electricity consumption Note any changes other that climate (process, adjustments) from one time period to another Collect electricity bills (prefer monthly to annual basis to get more accuracy) Draw the diagram: time period on the X-axis and kWh/time period on the Y-axis Try to explain variations in consumption thanks to previous changes or activity indicators If variations are unexplainable, call a professional (energy supplier, ESCO etc.) for an energy audit Try to continue that follow-up of energy consumption even if no problem is detected Figure 4: First part of ACTION PLAN 3. Benchmark typical energy ratios The lack of reference often leads us to think that everything is OK. The objectives of the second part of that guide are to allow building owners to compare their energy consumption. Although it is difficult, the idea of benchmarking is then to try to build “universal” indicators that can be compared in the same activity sector whatever the building. To reach that independency from the activity level, the best way is to calculate energy ratios (kWh/activity parameter/time period) by dividing energy consumption of a system (building, energy use, equipment) during a certain time period by one or more activity indicators. The first task is to choose the best time period on which you will calculate energy ratios. Unless you want to regularly follow-up your energy consumption because your activity parameters vary strongly and frequently, it is useless to consider short time periods such as a week or a month. Indeed, smaller is the reference more the climate dependence is relevant, so to choose monthly reference allows to mitigate punctual peak or minimum of temperatures. Prefer typical time periods such as a year or a season also in order to distinguish between heating and cooling consumptions. There exist an obvious relationship between the number of energy uses, their size and power and the area of the building so that the most common indicator is the cooled area (in square- meters). It can be used in every air-conditioned spaces especially buildings without specific processes (office or residential buildings) where no other indicators are present. Another obvious relationship exists between the area of the building and its occupancy especially for constant occupancy buildings (no or limited numbers of external visitors) so that the use of that indicator should then be equivalent to the use of square-meters. In practice, it is not as clear (Figure 5) and the distinction between the two indicators allows sometimes to maximize the information. 9
  • 10. 30 25 Permanent occupancy 20 15 10 5 Permanent occupancy = 0,0211 x Square-meters + 2,1101 2 R = 0,7038 0 0 100 200 300 400 500 600 700 800 900 1000 1100 1200 2 Bank agency area (m ) Figure 5: relationship between area and permanent occupancy in the banking sector. Everybody knows that the more the activity level of a building, the higher its energy consumption. Thermal uses are not an exception and energy consumption is correlated to occupancy. For example, heat and humidity productions and inlets due to temporary occupancy have to be fought against by air conditioning systems. As it is often difficult to count visitors of a building during a time period, it is better use other indicators that are necessarily such as: occupied beds in a hospitals, occupied bedrooms in hotels, students in schools, meals in restaurants, tickets sold in museums or concert-halls etc… In case of variable occupancy, these indicators should be used in addition to kWh/m2 ratios. Keep in mind that benchmarking only provides valid results (Figure 6) for the same building on several time periods or at least for the same category of buildings. Two buildings from the same activity sector may have totally different energy ratios because of their different sizes. Indeed, most processes, their intrinsic efficiencies and their control systems are often better in large- scale buildings. Moreover, these ratios do not take into account the climate influence (outdoor temperature, sun, wind etc…) on energy consumption so that comparisons of buildings in too different locations may be analyzed carefully. 600 50000 550 45000 500 2003 2004 2005 2003 2004 2005 Energy ratio (kWh/person.yr) Energy ratio (kWh/m2.year) 40000 450 35000 400 350 30000 300 25000 250 20000 200 15000 150 100 10000 50 5000 0 0 0 100 200 300 400 500 600 700 800 900 1000 1100 1200 0 5 10 15 20 25 30 Bank angency area (m2) Agency staff Figure 6: the kWh/m².year ratio decreases with the surface (left) and the staff (right) in the banking sector. 10
  • 11. If your ratios (compare several ones) are lower than other building ratios or statistics, your building seems energy-efficient and you have probably no action to carry out or investment to make. Continue however to regularly follow-up your indicators to anticipate problems. In the other case, you should probably contact a professional to consider some ways of improvements. 2nd Part: Benchmark typical energy ratios Choose main activity indicators that justify variations in electricity consumption Calculate electricity consumption on the time period (the same as the one used in statistics) For each activity indicator and the same time period, divide energy consumption by the indicator Compare each ratio from one time period to another Try to explain possible variations (climate, adjustments etc…) Compare each ratio to statistics Try to explain possible differences (size, climate, adjustments etc…) If variations/differences are unexplainable, call a professional (energy supplier, ESCO etc.) for an energy audit Try to continue that benchmarking of energy ratios even if no problem is detected Figure 7 Second part of ACTION PLAN for benchmarking of energy ratios. The EPlabel3 project has developed a simple software that records details of a building, its key descriptors and its energy use and produces a summary of the measured annual energy consumption and calculates Energy Performance indicators in units of total weighted energy per m² of internal area. The software main idea is to label the building energy performance as demanded in the European Energy Performance Building Directive, but it can be used to define reference ratios (as built or operational rating) and visually describe the energy content of the building. 4. Establish the climate based energy “signature” of the building Previous energy ratios are climate dependent so that only statistical ranges are published. Several climatic parameters (sun, wind, outdoor temperature, outdoor humidity) play an important role in energy consumption of thermal uses. The objective of that paragraph is then to determine the sensitivity of energy consumption to climate parameters. It is focused especially on the outdoor temperature because that parameter is easier to feel and measure for a building owner. 3 EPLabel: A programme to deliver energy certificates based on measured energy consumption for display in Public buildings across Europe within a harmonizing framework. http://www.eplabel.org/ 11
  • 12. The particular interest of such a method is to distinguish between climate dependent energy consumption (variable part) and them that are not (constant part). The building “signature” is then a curve that describes in a unique way the behavior if the building as a function of a climatic parameter. However, find a correlation between energy consumption and outdoor temperature necessarily requires a representative dot scattering, in other words much more dots. Therefore, monthly energy bills or weekly measurements should be preferred to annual energy bills. There are three possibilities concerning the temperature: either measure it, or get free daily-averaged measurements (can be found on the internet4) or pay for local hourly measurements (to national weather institute). Two climate indicators can be used in the energy signature. The first one is directly the averaged outdoor temperature of the time period. As a consequence, the correlation function is growing for cooling in summer and decreasing for heating in winter. The second indicator is degree-days that can be calculated for heating (HDD) in winter and cooling (CDD) in summer. HDD (respectively CDD) is the sum on the chosen time period (higher than a day) of the product of “the number of days during the time period for which the outdoor temperature is lower (respectively higher) than a reference value” by “the difference between the daily averaged outdoor temperature and that reference value”. HDD (respectively CDD) represent how cold (respectively hot) is a winter (respectively summer) time period. The main difficulty of using degree-days is to choose the good reference temperature. In theory, that value is the averaged temperature ensured only by the building shell without any additional heating (or cooling) system. Logically, the balance temperature in winter is different from the one in summer. For heating, the reference temperature is usually taken equal to 18°C in Europe. As heat gains can contribute to about 3°C in buildings and due to the averaged decrease of building shell thermal conductivity, the reference temperature for heating tends to rise. For cooling, the same problem exist so that in large office buildings, air conditioning system may start for an outdoor temperature of 14°C whereas in residential buildings, accounting less heat gains, the reference temperature may reach 24°C. Observe that not knowing the "proper" base temperature is, in practice, rarely a problem for detecting changes in consumption: energy consumption correlates well with "wrong" degree-days - since degree-day values to different base temperatures are strongly correlated with each other. Once you got enough dots for your energy signature, you are able to detect rapidly drifts in energy consumption due to some defaults compared to the past normal operation. It is thus better to apply this method as soon as the start-up of a new thermal process in order to have reference (without default) dots. The Figure 8 sums-up some of the typical defaults that can be detected from an energy signature analysis. 4 For example, a French website centralizes several climate data in a lot of locations in the country ahttp://www.meteociel.fr/climatologie/climato.php 12
  • 13. kWh/time unit kWh/time unit Reference Tightness CDD/time unit CDD/time unit Problems on Default on kWh/time unit kWh/time unit controls or the supply thermal probes reduction system CDD/time unit CDD/time unit Effects of Oversizing or kWh/time unit kWh/time unit Sun other overcooling climate Wind CDD/time unit CDD/time unit Figure 8: Few problems that can be detected by the climate-based energy signature of a building. That method works almost perfectly for heating and is often used in operation and maintenance contracts with guarantee of results. However, it is not as accurate for cooling because of the higher number and power of electrical auxiliaries, the stronger influence of humidity and solar radiation on air conditioning and the non-uniformity of temperature and humidity set points in buildings due to a lack of regulation. Once the correlation between energy consumption and degree-days or average temperature is established, climate independent energy ratios are directly available calculating the slope of the curve. It is then possible to compare your building ratios with those from any other building whatever their locations. Remember that measuring only the power absorbed by the considered thermal use (an air conditioning system for example) allows to strongly limit the offset magnitude of the curve and to better underline the effect of climate (slope) on energy consumption. Energy bills are a mix of consumption from different uses attenuating the visibility of pure thermal uses. Thus, always take care to the framework to compare ratios with statistics or between buildings. 13
  • 14. 3rd Part: climate based energy signature Determine the best time period (monthly/weekly for DD, daily for average temperature) Determine the best temperature reference (usually 18°C in winter, from 14°C to 24°C in summer) Measure/get average daily temperature or calculate/get degree-days for each time period Separate cooling degree-days from heating degree-days Measure /get from the bills electricity consumption on each time period Draw the diagram for each time period: average temperature or DD on the X-axis and kWh on the Y-axis As soon as a season/year is complete, determine the (linear) regression between consumption and climate parameters Try to find the reasons why a new dot is outside the scatter – If differences are too important, too frequent and unexplainable, call a professional (energy supplier, ESCO etc.) for an energy audit Calculate climate independent energy ratios (slope of the regression curve) in kWh/m2.DD Compare to statistics – Try to explain possible differences (size, activity, adjustments etc…) Try to continue the energy signature even if no problem is detected Figure 9: Third part of ACTION PLAN for establishment and the use of the climate based energy signature of the building. 5. Establish the multi-parameter energy signature of the building We showed that energy consumption were due to a lot of parameters and underlined especially the influences of building parameters (area, staff), activity parameters (occupancy, production) and climate. However, it is impossible to analyze one parameter independently of the others. Concerning air conditioning for example, a more temperate climate than forecasts can be compensated by a much higher occupancy than in normal conditions so that the only climate or activity analysis will provide biased results. As all of these parameters have a common influence on energy consumption, it is important to analyze their effects simultaneously. The idea of that paragraph is then to find the energy signature of the building by considering not only the climate but also main activity parameters (pure occupancy, indirect occupancy, production etc…). Building parameters (surface, staff etc…) can be added in order to determine the energy signature of several similar buildings of the same activity sector (see next example). This method is exactly the same as the previous one but additional parameters are this time included into the linear regression. As for climate parameters, building and activity parameters must be measured precisely for each time period so that specific metrologies or procedures should be set-up. Again, time periods must be short in order to get more dots and then accuracy. Finally, to be able to find a correlation between consumption and all the parameters, you will 14
  • 15. need at least as many time periods as parameters. For example, if the main parameters having effects on your building energy consumption E are the degree-days DD and the occupancy O in a supermarket, the regression method requires at least two time periods on which the coordinates (E, DD, O) are distinct. However, to reach higher levels of representativeness, it is better to scan a large range for every parameter. For example, in the banking sector the information available for each agency is: area S, staff Nwkr, the annual electricity consumption for three years and finally the location allowing to calculate both cooling (CDD) and heating (HDD) annual degree-days. As building parameters (area and staff) are constant for one agency in the time, they only intervene into the magnitude of consumption but not in their variations with time. On the opposite, variations of cooling and heating degree-days lead to variations in annual electricity consumption for one agency. As only three dots were available for each agency, the results of each energy signature were neither accurate nor representative. Although the approach is strictly the same, the energy signature was applied not to each agency but to the whole banking sector including every agencies in order to determine a general profile of electricity consumption. Several models were tested: influence of the area (S), of the winter climate (HDD), of the summer climate (CDD), of both winter and summer climates (H&CDD) depending on the type of heating system (joule or reversible heat-pump), of the staff (Nwkr). The Table 2 presents both results and accuracy (R2) obtained by such models. Obviously, the more the parameters, the more accurate but for comparison purposes they cannot be all kept. Model (kWh/year) A B C R² A.HDD.S+B 0.101 11680 0.67 A.HDD.S+B.Nwkr+C 0.047 3822 4652 0.77 A.CDD.S+B 0.411 27170 0.27 A.CDD.S+B.Nwkr+C 0.139 4000 1766 0.64 Heating by Joule effect (COP=1) A.H&CDD.S+B 0.099 11481 0.67 A.H&CDD.S+B.Nwkr+C 0.0461 3813 4700 0.77 Heating by Heat Pump (COP=2.5) A.H&CDD.S+B 0.099 11174 0.68 A.H&CDD.S+B.Nwkr+C 0.0479 3700 4740 0.77 Table 2: modeling of electricity consumption in the banking sector in France using a linear regression method Once the multi-parameter energy signature of the building is established, drifts in energy consumption generated by defaults may be detected as soon as new dots deviate from the scatter. As for the simple climate base energy signature, energy ratios relative to each parameter may be deduced from the correlation function calculated by extracting multiplier coefficient before each variable. Eventually, the DD regression not being be enough precise or of hard interpretation, it exists other methods such as the CUSUM method5 that allow to reveal trends that are occurring in the building energy performance that are not visible through the only regression method. 5 For more detail about the CUSUM method you can look at the: “CTG004- Degree days for energy management — a practical introduction”, Carbon trust at http://www.carbontrust.co.uk/publications 15
  • 16. 4th Part: multi-parameter energy signature Choose main activity and climate indicators that justify variations in electricity consumption Determine the best time period (monthly, weekly, daily) Measure/get every chosen indicators for each time period Measure/get from bills the electricity consumption of each time period If enough dots are available, establish the linear regression (E=Σai.Pi + b) between electricity consumption E and every parameters Pi Try to find the reasons why a new dot is outside the scatter – If differences are too important, too frequent and unexplainable, call a professional (energy supplier, ESCO etc.) for an energy audit Calculate energy ratios by extracting multiplier coefficients ai Compare to statistics – Try to explain possible differences (size, activity, adjustments etc…) Try to continue the energy signature even if no problem is detected Figure 10: fourth part of ACTION PLAN for establishment and the use of the multi-parameter energy signature of the building. 16
  • 17. Annex 1) Some EECCAC (Energy Efficiency and Certification of Central Air Conditioners - FINAL REPORT - APRIL 2003) Ratios of total consumptions for EU 15 countries weighted all sectors and systems (kWh/m².year) Cooling Heating Cooling & Heating Austria 26,1 147,1 173,2 Belgium 19,5 135,6 155,0 Denmark 14,1 170,4 184,5 Finland 15,0 192,1 207,1 France 32,6 114,6 147,3 Germany 22,8 152,6 175,3 Greece 48,3 97,2 145,4 Ireland 19,5 119,4 139,0 Italy 50,1 94,5 144,7 Luxembourg 19,1 135,9 155,1 Netherlands 17,7 136,0 153,7 Portugal 49,7 96,0 145,7 Spain 81,5 28,5 110,0 Sweden 14,9 192,1 207,0 UK 19,7 119,5 139,2 Electricity consumption for cooling (system and auxiliaries) in offices buildings for CAV (Constant Air Volume system) and RAC (room air conditioner) AC consumption (kWh/m2.year) Seville-CAV 99,26 London-CAV 32,77 Milan-CAV 70,49 Seville-RAC 58,52 London-RAC 8,39 Milan-RAC 28,53 Some indicative ratios for air conditioning consumptions for UK different sectors (All ratios are based on AC (kWh/m²) AC (kWh/m²) Ventilation based on cooled area) Central systems Packaged systems (kWh/m²) Hospitals (all health 94 170 71 sector) Hotels/restaurant/bar 94 170 71 Offices (commercial only) 49 270 117 Commercial 144 123 52 establishments (retail) Collective housing Schools (all education) 94 170 71 Leisure 94 170 71 Government buildings 94 170 71 Warehouses 94 170 71 17
  • 18. 2) Some indicative ratios for French offices from an internal study of the Ecole de Mines: Use Additional remarks Ratios All consumptions The ratio take into account the 240 climate correction kWh/m².year Heating and cooling The ratio take into account the 150 - 170 climate correction kWh/m².year Cooling The ratio take into account the 25 -50 climate correction kWh/m².year DHW kWh/m3 70 (electric) 100-150 Lighting kWh/m².year 40 - 65 Lift As % of total energy 2 consumption 18