SlideShare a Scribd company logo
19Gold Demand Trends  |  First quarter 2016
Gold demand statistics
Table 2: Gold demand (tonnes)	
2014 2015 Q2’14 Q3’14 Q4’14 Q1’15 Q2’15 Q3’15 Q4’15 Q1’16
Q1’16
vs
Q1’15
% change
Jewellery 2,482.0 2,397.5 589.5 591.5 686.0 596.9 513.7 623.7 663.2 481.9 		 -19
Technology 348.5 333.8 86.6 89.5 89.4 83.3 83.5 82.9 84.1 80.9 		 -3
	Electronics 277.6 264.3 68.6 71.6 71.8 66.3 65.8 65.5 66.8 63.9 		 -3
	 Other industrial 51.0 50.6 13.1 13.0 12.8 12.3 13.0 12.7 12.7 12.4 		 1
	Dentistry 19.9 18.9 4.9 4.9 4.8 4.7 4.8 4.7 4.6 4.5 		 -4
Investment 822.0 895.6 200.1 182.4 169.4 277.9 182.3 230.3 205.2 617.6 		122
	 Total bar and coin demand 1,005.6 1,023.9 238.1 223.3 261.5 252.2 205.3 293.7 272.7 253.9 		 1
		 Physical bar demand 726.5 739.8 170.8 166.9 186.9 186.6 151.2 199.8 202.2 183.4 		 -2
		Official coin 202.9 212.4 48.8 35.7 54.5 50.2 40.1 72.6 49.5 58.7 		 17
		Medals/imitation coin 76.2 71.7 18.6 20.8 20.1 15.4 14.0 21.3 21.0 11.8 		 -24
	 ETFs and similar products* -183.6 -128.3 -38.0 -40.9 -92.1 25.6 -23.0 -63.4 -67.6 363.7 	 	>300
Central banks and other inst. 583.9 566.3 157.2 174.9 133.9 112.3 127.2 167.9 158.8 109.4 		 -3
Gold demand 4,236.4 4,193.1 1,033.5 1,038.3 1,078.7 1,070.4 906.7 1,104.7 1,111.3 1,289.8 		 21
LBMA Gold Price, US$/oz 1,266.4 1,160.1 1,288.4 1,281.9 1,201.4 1,218.5 1,192.4 1,124.3 1,106.5 1,182.6 		 -3
*For a listing of the Exchange Traded Funds and similar products, please see the Notes and definitions.	
Source: Metals Focus; GFMS, Thomson Reuters; ICE Benchmark Administration; World Gold Council
Table 3: Gold demand (US$mn)	
2014 2015 Q2’14 Q3’14 Q4’14 Q1’15 Q2’15 Q3’15 Q4’15 Q1’16
Q1’16
vs
Q1’15
% change
Jewellery 101,054.9 89,417.2 24,419.8 24,378.3 26,495.7 23,383.0 19,693.0 22,543.7 23,591.5 18,322.3 		 -22
Technology 14,188.6 12,450.2 3,588.7 3,688.2 3,453.5 3,263.0 3,201.5 2,996.0 2,992.5 3,074.1 		 -6
	Electronics 11,301.4 9,858.3 2,843.4 2,950.4 2,771.6 2,595.4 2,521.2 2,366.4 2,377.4 2,430.9 		 -6
	 Other industrial 2,076.3 1,888.4 542.6 536.6 495.8 482.3 497.7 458.6 450.0 471.2 		 -2
	Dentistry 811.0 703.5 202.7 201.2 186.0 185.2 182.6 171.0 165.1 172.0 		 -7
Investment 33,469.7 33,402.3 8,290.1 7,518.9 6,543.0 10,885.7 6,986.7 8,323.4 7,299.0 23,482.7 		116
	 Total bar and coin demand 40,944.2 38,189.1 9,864.1 9,204.7 10,099.6 9,881.1 7,869.7 10,614.9 9,702.3 9,654.6 		 -2
		 Physical bar demand 29,581.5 27,590.9 7,074.9 6,877.4 7,218.3 7,311.4 5,795.5 7,221.1 7,192.2 6,973.9 		 -5
		Official coin 8,260.2 7,923.6 2,019.8 1,470.3 2,104.8 1,965.8 1,538.5 2,623.9 1,762.5 2,232.9 		 14
		Medals/imitation coin 3,102.6 2,674.5 769.4 857.0 776.5 604.0 535.7 770.0 747.6 447.8 		 -26
	 ETFs and similar products* -7,474.5 -4,786.8 -1,574.0 -1,685.8 -3,556.6 1,004.6 -883.0 -2,291.5 -2,403.3 13,828.1 	 	>300
Central banks and other inst. 23,774.0 21,121.3 6,511.7 7,206.5 5,173.5 4,400.5 4,877.9 6,069.2 5,649.8 4,161.2 		 -5
Gold demand 172,487.2 156,390.9 42,810.3 42,792.0 41,665.6 41,932.2 34,759.1 39,932.4 39,532.8 49,040.2 		 17
*For a listing of the Exchange Traded Funds and similar products, please see the Notes and definitions.	
Source: Metals Focus; GFMS, Thomson Reuters; ICE Benchmark Administration; World Gold Council
20Gold Demand Trends  |  First quarter 2016
Table 4: Gold supply and demand World Gold Council presentation	
2014 2015 Q2’14 Q3’14 Q4’14 Q1’15 Q2’15 Q3’15 Q4’15 Q1’16
Q1’16
vs
Q1’15
% change
Supply
		Mine production 3,153.1 3,211.4 759.6 831.2 845.1 729.4 787.7 847.8 846.4 734.0 		 1
		 Net producer hedging 106.5 9.2 50.0 -9.2 51.9 -11.6 -6.9 14.9 13.0 40.0 	 -	 -
	 Total mine supply 3,259.6 3,220.6 809.6 822.0 897.0 717.7 780.8 862.7 859.4 774.0 		 8
	 Recycled gold 1,202.1 1,127.0 279.9 274.4 270.0 363.2 266.8 261.5 235.5 360.9 		 -1
Total supply 4,461.7 4,347.6 1,089.5 1,096.4 1,167.1 1,081.0 1,047.6 1,124.2 1,094.9 1,134.9 		 5
Demand
		 Fabrication – Jewellery1
2,502.7 2,438.5 610.2 639.5 648.6 608.0 542.5 662.6 625.3 478.5 		 -21
		 Fabrication – Technology 348.5 333.8 86.6 89.5 89.4 83.3 83.5 82.9 84.1 80.9 		 -3
	 Sub-total above fabrication 2,851.1 2,772.3 696.8 729.0 738.0 691.3 626.1 745.5 709.5 559.4 	 	-19
	 Total bar and coin demand 1,005.6 1,023.9 238.1 223.3 261.5 252.2 205.3 293.7 272.7 253.9 		 1
	 ETFs and similar products2
-183.6 -128.3 -38.0 -40.9 -92.1 25.6 -23.0 -63.4 -67.6 363.7 		>300
	 Central banks and other inst.3
583.9 566.3 157.2 174.9 133.9 112.3 127.2 167.9 158.8 109.4 		 -3
	 Gold demand 4,257.1 4,234.2 1,054.2 1,086.3 1,041.3 1,081.5 935.6 1,143.7 1,073.5 1,286.5 		 19
	Surplus/Deficit4
204.6 113.4 35.3 10.1 125.8 -0.6 112.1 -19.5 21.4 -151.5 	 -	 -
Total demand 4,461.7 4,347.6 1,089.5 1,096.4 1,167.1 1,081.0 1,047.6 1,124.2 1,094.9 1,134.9 		 5
LBMA Gold Price, US$/oz 1,266.4 1,160.1 1,288.4 1,281.9 1,201.4 1,218.5 1,192.4 1,124.3 1,106.5 1,182.6 		 -3
1	 For an explanation of jewellery fabrication, please see the Notes and definitions.								
2	 For a listing of the Exchange Traded Funds and similar products, please see the Notes and definitions.						
3	Excluding any delta hedging of central bank options.										
4	 For an explanation of Surplus/Deficit, please see the Notes and definitions.						
Source: Metals Focus; GFMS, Thomson Reuters; ICE Benchmark Administration; World Gold Council		
Table 5: Quarterly average price	
2015 Q1'15 Q2'15 Q3'15 Q4'15 Q1'16
Q1’16
vs
Q1’15
% change
US$/oz 1,160.1 1,218.5 1,192.4 1,124.3 1,106.5 1,182.6 	 	 -3
€/oz 1,045.3 1,083.1 1,078.0 1,011.5 1,010.1 1,072.3 	 	 -1
£/oz 759.0 804.9 777.7 726.0 728.6 826.9 	 	 3
CHF/kg 35,863.3 37,292.5 36,082.7 34,875.9 35,230.2 37,774.4 	 	1
¥/g 4,513.8 4,666.8 4,656.4 4,416.2 4,320.4 4,374.5 	 	 -6
Rs/10g 23,903.2 24,377.9 24,332.8 23,476.1 23,446.0 25,677.0 	 	 5
RMB/g 234.2 244.3 237.8 227.8 227.2 248.7 	 	 2
TL/g 101.4 96.5 102.3 103.1 103.4 111.9 	 	 16
Source: ICE Benchmark Administration; Thomson Reuters Datastream; World Gold Council
21Gold Demand Trends  |  First quarter 2016
Table 6: Jewellery demand in selected countries (tonnes)				
2015 Q1'15 Q2'15 Q3'15 Q4'15 Q1'16
Q1’16
vs
Q1’15
% change
India 668.5 150.8 122.1 215.1 180.4 88.4 	 	-41
Pakistan 23.2 5.3 5.4 5.9 6.6 6.0 	 	 13
Sri Lanka 6.8 1.7 2.0 1.3 1.7 1.5 	 	 -14
Greater China 811.9 231.7 181.0 196.0 203.1 191.6 	 	 -17
	China 753.4 216.3 169.0 180.6 187.6 179.4 	 	 -17
	 Hong Kong 51.4 13.6 10.5 13.7 13.6 10.2 	 	-25
	Taiwan 7.0 1.8 1.6 1.7 2.0 1.9 	 	 6
Japan 16.5 3.2 3.8 4.4 5.1 3.5 	 	 10
Indonesia 38.9 12.1 8.5 9.3 9.0 10.8 	 	 -10
Malaysia 8.4 2.8 1.7 2.0 1.9 2.2 	 	-23
Singapore 12.2 3.4 2.7 3.0 3.1 3.3 	 	 -3
South Korea 14.1 3.7 2.9 3.7 3.9 3.9 	 	 8
Thailand 12.2 3.4 2.8 2.9 3.1 3.2 	 	 -4
Vietnam 15.6 4.4 3.7 3.5 3.9 4.7 	 	 6
Middle East 230.3 63.0 57.7 56.0 53.6 56.5 	 	 -10
	 Saudi Arabia 71.1 17.4 18.8 16.6 18.4 15.3 	 	 -12
	UAE 51.4 16.3 14.9 10.0 10.2 14.0 	 	 -14
	Kuwait 12.7 3.6 3.1 2.3 3.7 3.1 	 	 -15
	Egypt 38.2 9.3 8.9 11.8 8.1 7.7 	 	 -18
	Iran 37.2 9.0 7.2 11.4 9.5 9.9 	 	 10
	 Other Middle East 19.7 7.3 4.8 3.9 3.7 6.5 	 	 -11
Turkey 49.0 10.4 11.6 12.1 15.0 8.5 	 	 -18
Russia 41.1 9.2 9.1 12.5 10.3 7.7 	 	 -17
Americas 170.5 32.5 39.1 38.2 60.8 32.9 	 	 1
	 United States 119.8 22.1 25.6 26.5 45.6 22.6 	 	 2
	Canada 14.2 2.7 3.5 2.7 5.3 2.6 	 	 -3
	Mexico 16.6 4.0 4.2 4.4 4.1 4.1 	 	 4
	Brazil 19.9 3.8 5.8 4.7 5.7 3.5 	 	 -6
Europe ex CIS 75.9 12.8 14.5 12.8 35.8 12.7 	 	 -1
	France 13.6 2.8 2.6 2.0 6.3 2.7 	 	 -2
	Germany 10.2 1.7 2.1 1.2 5.2 1.7 	 	 -1
	Italy 18.0 2.5 3.6 2.8 9.0 2.4 	 	 -3
	Spain 8.3 1.8 2.1 1.9 2.5 1.9 	 	 3
	 United Kingdom 25.9 4.0 4.1 4.9 12.9 4.0 	 	 1
	Switzerland - - - - - - 	 -	 -
	Austria - - - - - - 	 -	 -
	 Other Europe - - - - - - 	 -	-
Total above 2,195.1 550.5 468.5 578.7 597.3 437.5 	 	 -21
Other and stock change 202.4 46.4 45.2 44.9 65.9 44.4 	 	 -4
World total 2,397.5 596.9 513.7 623.7 663.2 481.9 	 	 -19
Source: Metals Focus; World Gold Council
22Gold Demand Trends  |  First quarter 2016
Table 7: Total bar and coin demand in selected countries (tonnes)				
2015 Q1'15 Q2'15 Q3'15 Q4'15 Q1'16
Q1’16
vs
Q1’15
% change
India 195.8 40.9 37.7 57.0 60.2 28.0 	 	 -31
Pakistan 14.5 3.1 3.8 3.7 4.0 3.4 	 	 11
Sri Lanka - - - - - - 	 -	-
Greater China 211.1 61.2 43.3 54.3 52.3 63.7 	 	 4
	China 203.3 59.1 41.6 52.3 50.3 61.9 	 	 5
	 Hong Kong 1.5 0.4 0.3 0.5 0.3 0.4 	 	 -3
	Taiwan 6.4 1.7 1.4 1.5 1.7 1.4 	 	 -17
Japan 16.2 -3.2 -0.2 10.8 8.9 3.3 	 -	-
Indonesia 20.1 5.7 4.5 4.6 5.3 5.2 	 	 -8
Malaysia 7.3 2.5 1.5 1.7 1.6 1.5 	 	-40
Singapore 5.9 1.6 1.2 1.5 1.6 1.2 	 	 -27
South Korea 7.5 1.7 1.3 2.2 2.4 1.2 	 	 -26
Thailand 78.0 19.5 16.4 20.5 21.5 22.4 	 	 15
Vietnam 47.8 14.4 10.8 11.5 11.1 11.5 	 	 -21
Middle East 62.4 23.9 14.5 13.1 10.9 22.9 	 	 -4
	 Saudi Arabia 15.2 4.8 3.2 3.4 3.9 3.9 	 	 -19
	UAE 8.7 2.9 2.3 1.8 1.8 2.5 	 	 -15
	Kuwait 0.8 0.2 0.2 0.2 0.2 0.2 	 	 -17
	Egypt 4.9 1.1 1.2 1.4 1.2 0.9 	 	 -22
	Iran 30.1 14.2 7.0 5.8 3.1 14.9 	 	 5
	 Other Middle East 2.6 0.8 0.6 0.6 0.6 0.6 	 	 -17
Turkey 23.1 5.2 4.5 9.2 4.2 5.0 	 	 -5
Russia 4.8 1.3 1.3 1.2 1.1 1.0 	 	 -22
Americas 78.0 13.4 13.6 32.7 18.4 20.2 	 	 51
	 United States 71.5 11.8 12.3 30.8 16.6 18.3 	 	 55
	Canada 2.9 0.7 0.5 0.9 0.8 1.0 	 	 42
	Mexico 2.2 0.5 0.4 0.7 0.6 0.6 	 	 4
	Brazil 1.4 0.4 0.4 0.4 0.4 0.3 	 	 -10
Europe ex CIS 222.1 58.1 45.3 59.9 58.8 58.4 	 	 0
	France 1.6 1.0 -0.3 0.4 0.5 0.8 	 	 -21
	Germany 116.0 30.9 23.1 30.2 31.7 31.1 	 	 1
	Italy - - - - - - 	 -	-
	Spain - - - - - - 	 -	-
	 United Kingdom 9.4 2.0 1.8 2.7 2.9 3.2 	 	 61
	Switzerland 49.2 13.6 10.7 13.3 11.6 12.7 	 	 -7
	Austria 12.2 3.0 2.5 3.5 3.2 2.9 	 	 -1
	 Other Europe 33.7 7.7 7.5 9.7 8.9 7.7 	 	 0
Total above 994.6 249.2 199.4 283.9 262.1 248.8 	 	 0
Other and stock change 29.3 3.0 5.9 9.8 10.6 5.1 	 	 71
World total 1,023.9 252.2 205.3 293.7 272.7 253.9 	 	 1
Source: Metals Focus; World Gold Council
23Gold Demand Trends  |  First quarter 2016
Table 8: Consumer demand in selected countries (tonnes)				
2015 Q1'15 Q2'15 Q3'15 Q4'15 Q1'16
Q1’16
vs
Q1’15
% change
India 864.3 191.7 159.8 272.1 240.6 116.5 	 	 -39
Pakistan 37.6 8.4 9.2 9.6 10.5 9.4 	 	 13
Sri Lanka 6.8 1.7 2.0 1.3 1.7 1.5 	 	 -14
Greater China 1,023.0 292.9 224.3 250.3 255.4 255.3 	 	 -13
	China 956.7 275.4 210.6 232.9 237.8 241.3 	 	 -12
	 Hong Kong 52.8 14.0 10.8 14.2 13.9 10.6 	 	 -24
	Taiwan 13.4 3.6 2.9 3.2 3.7 3.4 	 	 -5
Japan 32.8 0.0 3.6 15.2 14.0 6.8 	 	>300
Indonesia 59.0 17.8 13.0 14.0 14.3 16.1 	 	 -10
Malaysia 15.7 5.3 3.2 3.7 3.5 3.7 	 	 -31
Singapore 18.1 5.0 3.9 4.5 4.7 4.5 	 	 -11
South Korea 21.6 5.3 4.2 5.9 6.2 5.2 	 	 -3
Thailand 90.2 22.9 19.2 23.5 24.6 25.7 	 	 12
Vietnam 63.4 18.9 14.5 15.0 15.0 16.2 	 	 -14
Middle East 292.7 86.9 72.2 69.1 64.5 79.3 	 	 -9
	 Saudi Arabia 86.3 22.1 22.0 19.9 22.3 19.1 	 	 -14
	UAE 60.1 19.2 17.2 11.8 12.0 16.5 	 	 -14
	Kuwait 13.6 3.9 3.3 2.5 3.9 3.3 	 	 -15
	Egypt 43.1 10.4 10.1 13.3 9.4 8.5 	 	 -18
	Iran 67.3 23.2 14.3 17.2 12.6 24.7 	 	 7
	 Other Middle East 22.3 8.1 5.4 4.4 4.3 7.2 	 	 -12
Turkey 72.1 15.6 16.1 21.2 19.2 13.5 	 	 -14
Russia 45.9 10.5 10.3 13.7 11.4 8.7 	 	 -18
Americas 248.5 45.9 52.6 70.9 79.1 53.0 	 	 16
	 United States 191.3 33.9 38.0 57.3 62.2 40.9 	 	 21
	Canada 17.1 3.4 4.0 3.6 6.1 3.6 	 	 6
	Mexico 18.8 4.5 4.5 5.0 4.7 4.7 	 	 4
	Brazil 21.3 4.1 6.1 5.0 6.0 3.8 	 	 -7
Europe ex CIS 298.1 70.9 59.8 72.7 94.7 71.1 	 	 0
	France 15.2 3.8 2.3 2.3 6.8 3.5 	 	 -7
	Germany 126.1 32.7 25.2 31.4 36.9 32.8 	 	 1
	Italy 18.0 2.5 3.6 2.8 9.0 2.4 	 	 -3
	Spain 8.3 1.8 2.1 1.9 2.5 1.9 	 	 3
	 United Kingdom 35.3 6.0 6.0 7.6 15.8 7.2 	 	 21
	Switzerland 49.2 13.6 10.7 13.3 11.6 12.7 	 	 -7
	Austria 12.2 3.0 2.5 3.5 3.2 2.9 	 	 -1
	 Other Europe 33.7 7.7 7.5 9.7 8.9 7.7 	 	 0
Total above 3,189.7 799.8 667.9 862.6 859.4 686.3 	 	 -14
Other and stock change 231.7 49.4 51.1 54.7 76.5 49.6 	 	 0
World total 3,421.4 849.1 719.0 917.3 935.9 735.8 	 	 -13
Source: Metals Focus; World Gold Council
24Gold Demand Trends  |  First quarter 2016
Table 9: Indian supply estimates (tonnes)		
2015 Q1'15 Q2'15 Q3'15 Q4'15 Q1'16
Q1’16
vs
Q1’15
% change
Supply
	 Gross bullion imports 1,065.0 249.2 235.9 304.8 275.1 151.4 	 	-39
		 of which doré1
229.0 38.6 56.7 67.3 66.5 34.8 	 	 -10
	 Net bullion imports 913.6 220.2 202.9 262.9 227.6 134.4 	 	-39
	Scrap 80.2 18.0 24.0 18.2 20.0 14.0 	 	-22
	 Domestic supply from other sources2
9.2 2.4 2.5 2.2 2.1 3.3 	 	 38
	 Total supply3
1,003.0 240.6 229.4 283.3 249.7 151.7 	 	-37
1 	 Volume of fine gold material contained in the doré.
2 	 Domestic supply from local mine production, recovery from imported copper concentrates and disinvestment.
3 	 This supply can be consumed across the three sectors – jewellery, investment and technology. Consequently, the total supply figure in the table will
not add to jewellery plus investment demand for India.
Source: Metals Focus; World Gold Council 							
Table 11: Physically-backed gold ETF AuM by region in tonnes				
Q1'15 Q2'15 Q3'15 Q4'15 Q1'16
Q1’16
vs Q1’15
tonnage
change
Q1’16
vs
Q1’15
% change
North America 1,068.6 1,044.8 1,012.3 955.9 1,186.9 	 	 118.3 	 	 11
Europe 612.0 618.6 583.9 570.2 690.5 	 	 78.5 	 	 13
Asia 43.3 41.0 42.9 46.0 54.1 	 	 10.8 	 	 25
Other 40.6 37.0 39.1 38.4 42.8 	 	 2.2 	 	 5
Global total 1,764.5 1,741.5 1,678.1 1,610.6 1,974.3 	 	 209.7 	 	 12
Source: Respective ETP providers; Bloomberg; ICE Benchmark Administration; World Gold Council		
Table 10: Top 10 physically-backed gold ETFs by AuM in tonnes				
Fund Country
Holdings
as of end
March
Q1’16
vs
Q1’15
% change
	1 SPDR Gold Shares United States 819.3 	 	 11
	2 iShares Gold Trust United States 186.3 	 	 13
	3 ZKB Gold ETF Switzerland 137.7 	 	 -1
	4 ETFS Physical Gold United Kingdom 113.9 	 	 2
	5 Gold Bullion Securities United Kingdom 92.3 	 	 8
	6 Source Physical Gold United Kingdom 73.7 	 	 51
	7 Xetra-Gold Germany 70.7 	 	 28
	8 Sprott Physical Gold Trust United States 54.8 	 	 39
	9 Central Fund of Canada Ltd Canada 52.7 	 	 0
	10 Julius Baer Physical Gold Fund Switzerland 44.2 	 	 -10
Global total 1,974.3 	 	 12
Source: Respective ETP providers; Bloomberg; ICE Benchmark Administration; World Gold Council
25Gold Demand Trends  |  First quarter 2016
Tonnes % of reserves
21 Venezuela 272.9 66%
22 Kazakhstan 228.3 32%
23 Belgium 227.4 36%
24 Philippines 195.9 10%
25 Algeria 173.6 5%
26 Thailand 152.4 3%
27 Singapore 127.4 2%
28 Sweden 125.7 8%
29 South Africa 125.2 11%
30 Mexico 121.1 3%
31 Libya 116.6 6%
32 Greece 112.7 59%
33 BIS 108.0 -
34 Korea 104.4 1%
35 Romania 103.7 10%
36 Poland 102.9 4%
37 Iraq 89.8 7%
38 Australia 79.9 6%
39 Kuwait 79.0 9%
40 Indonesia 78.1 3%
Tonnes % of reserves
1 United States 8,133.5 75%
2 Germany 3,381.0 69%
3 IMF 2,814.0 -
4 Italy 2,451.8 68%
5 France 2,435.7 63%
6 China 1,797.5 2%
7 Russia 1,460.4 15%
8 Switzerland 1,040.0 7%
9 Japan 765.2 2%
10 Netherlands 612.5 61%
11 India 557.7 6%
12 ECB 504.8 27%
13 Turkey 479.3 17%
14 Taiwan 422.7 4%
15 Portugal 382.5 71%
16 Saudi Arabia 322.9 2%
17 United Kingdom 310.3 9%
18 Lebanon 286.8 23%
19 Spain 281.6 21%
20 Austria 280.0 45%
Table 12: Top 40 reported official gold holdings (as at March 2016)
For information on the methodology behind this data, as well as footnotes for specific countries, please see our table of Latest World Official Gold Reserves,
at http://www.gold.org/government-affairs/gold-reserves
Source: IMF IFS; World Gold Council
Table 13: Historical data for gold demand	
Tonnes
Jewellery
Total bar and coin
investment
ETFs and
similar* Technology Central banks Total
2006 2,301.4 429.8 258.7 471.7 -365.4 3,096.2
2007 2,424.9 437.5 259.6 477.7 -483.8 3,116.0
2008 2,306.2 917.9 325.0 464.7 -235.4 3,778.3
2009 1,816.3 832.3 644.6 414.4 -33.6 3,674.0
2010 2,051.6 1,201.2 420.8 460.5 79.2 4,213.2
2011 2,091.6 1,491.9 236.9 428.5 480.8 4,729.8
2012 2,130.4 1,297.5 306.6 381.4 569.3 4,685.1
2013 2,678.8 1,705.1 -914.1 356.0 623.8 4,449.6
2014 2,482.0 1,005.6 -183.6 348.5 583.9 4,236.4
2015 2,397.5 1,023.9 -128.3 333.8 566.3 4,193.1
Q2'14 589.5 238.1 -38.0 86.6 157.2 1,033.5
Q3'14 591.5 223.3 -40.9 89.5 174.9 1,038.3
Q4'14 686.0 261.5 -92.1 89.4 133.9 1,078.7
Q1'15 596.9 252.2 25.6 83.3 112.3 1,070.4
Q2'15 513.7 205.3 -23.0 83.5 127.2 906.7
Q3'15 623.7 293.7 -63.4 82.9 167.9 1,104.7
Q4'15 663.2 272.7 -67.6 84.1 158.8 1,111.3
Q1'16 481.9 253.9 363.7 80.9 109.4 1,289.8
*For a listing of the Exchange Traded Funds and similar products, please see the Notes and definitions.					
Source: Metals Focus; GFMS, Thomson Reuters; World Gold Council

More Related Content

What's hot

EPIC RESEARCH SINGAPORE - Daily SGX Singapore report of 06 April 2016
EPIC RESEARCH SINGAPORE - Daily SGX Singapore report of 06 April 2016EPIC RESEARCH SINGAPORE - Daily SGX Singapore report of 06 April 2016
EPIC RESEARCH SINGAPORE - Daily SGX Singapore report of 06 April 2016
epicresearchsgmy
 
Technical analysis of stocks listed on BSE- (with datalinks to Google Drive)
Technical analysis of stocks listed on BSE- (with datalinks to Google Drive)Technical analysis of stocks listed on BSE- (with datalinks to Google Drive)
Technical analysis of stocks listed on BSE- (with datalinks to Google Drive)
Yugantar Khanduri
 
Venture-backed IPO & Acquisitions Q4 05
Venture-backed IPO & Acquisitions Q4 05 Venture-backed IPO & Acquisitions Q4 05
Venture-backed IPO & Acquisitions Q4 05 mensa25
 
Daily sgx report by epic research 30 august 2016
Daily sgx report by epic research 30 august 2016Daily sgx report by epic research 30 august 2016
Daily sgx report by epic research 30 august 2016
epicresearchsgmy
 
EPIC RESEARCH SINGAPORE - Daily SGX Singapore report of 18 May 2016
EPIC RESEARCH SINGAPORE - Daily SGX Singapore report of 18 May 2016EPIC RESEARCH SINGAPORE - Daily SGX Singapore report of 18 May 2016
EPIC RESEARCH SINGAPORE - Daily SGX Singapore report of 18 May 2016
Nicole Chan
 
Derivative 21 October 2013 By Mansukh Investment and Trading Solution
Derivative 21 October 2013  By Mansukh Investment and Trading SolutionDerivative 21 October 2013  By Mansukh Investment and Trading Solution
Derivative 21 October 2013 By Mansukh Investment and Trading Solution
Mansukh Investment & Trading Solutions
 
EPIC RESEARCH SINGAPORE - Daily SGX Singapore report of 20 May 2016
EPIC RESEARCH SINGAPORE - Daily SGX Singapore report of 20 May 2016EPIC RESEARCH SINGAPORE - Daily SGX Singapore report of 20 May 2016
EPIC RESEARCH SINGAPORE - Daily SGX Singapore report of 20 May 2016
Nicole Chan
 
Venture-Backed Exits Q3 07
Venture-Backed Exits Q3 07  Venture-Backed Exits Q3 07
Venture-Backed Exits Q3 07 mensa25
 
Obe sheet
Obe sheetObe sheet
Obe sheet
shabdrang
 
Vista gold announces updated mt todd preliminary feasibility study showing st...
Vista gold announces updated mt todd preliminary feasibility study showing st...Vista gold announces updated mt todd preliminary feasibility study showing st...
Vista gold announces updated mt todd preliminary feasibility study showing st...
Chris Helweg
 
2013 statistics tables (1)
2013 statistics tables (1)2013 statistics tables (1)
2013 statistics tables (1)
Ochä MegaSukma
 
Daily sgx report by epic research 29 august 2016
Daily sgx report by epic research 29 august 2016Daily sgx report by epic research 29 august 2016
Daily sgx report by epic research 29 august 2016
epicresearchsgmy
 
Venture Backed Exits - Q4 2008
 	Venture Backed Exits - Q4 2008  	Venture Backed Exits - Q4 2008
Venture Backed Exits - Q4 2008 mensa25
 
Daily sgx report by epic research 31 august 2016
Daily sgx report by epic research 31 august 2016Daily sgx report by epic research 31 august 2016
Daily sgx report by epic research 31 august 2016
epicresearchsgmy
 

What's hot (14)

EPIC RESEARCH SINGAPORE - Daily SGX Singapore report of 06 April 2016
EPIC RESEARCH SINGAPORE - Daily SGX Singapore report of 06 April 2016EPIC RESEARCH SINGAPORE - Daily SGX Singapore report of 06 April 2016
EPIC RESEARCH SINGAPORE - Daily SGX Singapore report of 06 April 2016
 
Technical analysis of stocks listed on BSE- (with datalinks to Google Drive)
Technical analysis of stocks listed on BSE- (with datalinks to Google Drive)Technical analysis of stocks listed on BSE- (with datalinks to Google Drive)
Technical analysis of stocks listed on BSE- (with datalinks to Google Drive)
 
Venture-backed IPO & Acquisitions Q4 05
Venture-backed IPO & Acquisitions Q4 05 Venture-backed IPO & Acquisitions Q4 05
Venture-backed IPO & Acquisitions Q4 05
 
Daily sgx report by epic research 30 august 2016
Daily sgx report by epic research 30 august 2016Daily sgx report by epic research 30 august 2016
Daily sgx report by epic research 30 august 2016
 
EPIC RESEARCH SINGAPORE - Daily SGX Singapore report of 18 May 2016
EPIC RESEARCH SINGAPORE - Daily SGX Singapore report of 18 May 2016EPIC RESEARCH SINGAPORE - Daily SGX Singapore report of 18 May 2016
EPIC RESEARCH SINGAPORE - Daily SGX Singapore report of 18 May 2016
 
Derivative 21 October 2013 By Mansukh Investment and Trading Solution
Derivative 21 October 2013  By Mansukh Investment and Trading SolutionDerivative 21 October 2013  By Mansukh Investment and Trading Solution
Derivative 21 October 2013 By Mansukh Investment and Trading Solution
 
EPIC RESEARCH SINGAPORE - Daily SGX Singapore report of 20 May 2016
EPIC RESEARCH SINGAPORE - Daily SGX Singapore report of 20 May 2016EPIC RESEARCH SINGAPORE - Daily SGX Singapore report of 20 May 2016
EPIC RESEARCH SINGAPORE - Daily SGX Singapore report of 20 May 2016
 
Venture-Backed Exits Q3 07
Venture-Backed Exits Q3 07  Venture-Backed Exits Q3 07
Venture-Backed Exits Q3 07
 
Obe sheet
Obe sheetObe sheet
Obe sheet
 
Vista gold announces updated mt todd preliminary feasibility study showing st...
Vista gold announces updated mt todd preliminary feasibility study showing st...Vista gold announces updated mt todd preliminary feasibility study showing st...
Vista gold announces updated mt todd preliminary feasibility study showing st...
 
2013 statistics tables (1)
2013 statistics tables (1)2013 statistics tables (1)
2013 statistics tables (1)
 
Daily sgx report by epic research 29 august 2016
Daily sgx report by epic research 29 august 2016Daily sgx report by epic research 29 august 2016
Daily sgx report by epic research 29 august 2016
 
Venture Backed Exits - Q4 2008
 	Venture Backed Exits - Q4 2008  	Venture Backed Exits - Q4 2008
Venture Backed Exits - Q4 2008
 
Daily sgx report by epic research 31 august 2016
Daily sgx report by epic research 31 august 2016Daily sgx report by epic research 31 august 2016
Daily sgx report by epic research 31 august 2016
 

Viewers also liked

Health Impact Assessments to Promote Healthy Neighborhoods
Health Impact Assessments to Promote Healthy NeighborhoodsHealth Impact Assessments to Promote Healthy Neighborhoods
Health Impact Assessments to Promote Healthy Neighborhoods
VDH, Office of Minority Health and Public Health Policy
 
Hydraulic Cylinders & Power Packs
Hydraulic Cylinders & Power PacksHydraulic Cylinders & Power Packs
Hydraulic Cylinders & Power PacksRaminder Kanda
 
Fernando Sampedro Espejel
Fernando Sampedro EspejelFernando Sampedro Espejel
Fernando Sampedro Espejelsampedros
 
Variantes según estado de la demanda.marketing turistico
Variantes según estado de la demanda.marketing turisticoVariantes según estado de la demanda.marketing turistico
Variantes según estado de la demanda.marketing turistico
ninadavila
 
Metodologia del diseño 1, 2, 3 capitulo
Metodologia del diseño 1, 2, 3 capituloMetodologia del diseño 1, 2, 3 capitulo
Metodologia del diseño 1, 2, 3 capitulolong2493
 
IDCC 2717 Avenant 13
IDCC 2717 Avenant 13IDCC 2717 Avenant 13
IDCC 2717 Avenant 13
Société Tripalio
 
Shell Nigeria participate Shell Eco-Marathon
Shell Nigeria participate Shell Eco-Marathon Shell Nigeria participate Shell Eco-Marathon
Shell Nigeria participate Shell Eco-Marathon Ravi Kampattu
 
יד אליהו מפגש הצגת פרויקטים 18092016
יד אליהו מפגש הצגת פרויקטים 18092016יד אליהו מפגש הצגת פרויקטים 18092016
יד אליהו מפגש הצגת פרויקטים 18092016
noaregev
 
Interoperability & Crowdsourcing: Can these improve the management of ANC pro...
Interoperability & Crowdsourcing: Can these improve the management of ANC pro...Interoperability & Crowdsourcing: Can these improve the management of ANC pro...
Interoperability & Crowdsourcing: Can these improve the management of ANC pro...
MEASURE Evaluation
 
Microbiological safety of milk and processing and consumption behaviour in pa...
Microbiological safety of milk and processing and consumption behaviour in pa...Microbiological safety of milk and processing and consumption behaviour in pa...
Microbiological safety of milk and processing and consumption behaviour in pa...
ILRI
 
Augmentation des Barêmes de salaires en Côte d'Ivoire
Augmentation des Barêmes de salaires en Côte d'IvoireAugmentation des Barêmes de salaires en Côte d'Ivoire
Augmentation des Barêmes de salaires en Côte d'Ivoire
Romuald N'TAKPE
 

Viewers also liked (15)

íNdex unitat 2.divisibilitat
íNdex unitat 2.divisibilitatíNdex unitat 2.divisibilitat
íNdex unitat 2.divisibilitat
 
Documento
DocumentoDocumento
Documento
 
recomendation0001
recomendation0001recomendation0001
recomendation0001
 
Health Impact Assessments to Promote Healthy Neighborhoods
Health Impact Assessments to Promote Healthy NeighborhoodsHealth Impact Assessments to Promote Healthy Neighborhoods
Health Impact Assessments to Promote Healthy Neighborhoods
 
Hydraulic Cylinders & Power Packs
Hydraulic Cylinders & Power PacksHydraulic Cylinders & Power Packs
Hydraulic Cylinders & Power Packs
 
Fernando Sampedro Espejel
Fernando Sampedro EspejelFernando Sampedro Espejel
Fernando Sampedro Espejel
 
Variantes según estado de la demanda.marketing turistico
Variantes según estado de la demanda.marketing turisticoVariantes según estado de la demanda.marketing turistico
Variantes según estado de la demanda.marketing turistico
 
Metodologia del diseño 1, 2, 3 capitulo
Metodologia del diseño 1, 2, 3 capituloMetodologia del diseño 1, 2, 3 capitulo
Metodologia del diseño 1, 2, 3 capitulo
 
IDCC 2717 Avenant 13
IDCC 2717 Avenant 13IDCC 2717 Avenant 13
IDCC 2717 Avenant 13
 
Shell Nigeria participate Shell Eco-Marathon
Shell Nigeria participate Shell Eco-Marathon Shell Nigeria participate Shell Eco-Marathon
Shell Nigeria participate Shell Eco-Marathon
 
יד אליהו מפגש הצגת פרויקטים 18092016
יד אליהו מפגש הצגת פרויקטים 18092016יד אליהו מפגש הצגת פרויקטים 18092016
יד אליהו מפגש הצגת פרויקטים 18092016
 
Interoperability & Crowdsourcing: Can these improve the management of ANC pro...
Interoperability & Crowdsourcing: Can these improve the management of ANC pro...Interoperability & Crowdsourcing: Can these improve the management of ANC pro...
Interoperability & Crowdsourcing: Can these improve the management of ANC pro...
 
Test
TestTest
Test
 
Microbiological safety of milk and processing and consumption behaviour in pa...
Microbiological safety of milk and processing and consumption behaviour in pa...Microbiological safety of milk and processing and consumption behaviour in pa...
Microbiological safety of milk and processing and consumption behaviour in pa...
 
Augmentation des Barêmes de salaires en Côte d'Ivoire
Augmentation des Barêmes de salaires en Côte d'IvoireAugmentation des Barêmes de salaires en Côte d'Ivoire
Augmentation des Barêmes de salaires en Côte d'Ivoire
 

Similar to Au demand stats - gdt q1 2016_gold_demand_statistics

Gold Demand Trends FY 2016 data table
Gold Demand Trends FY 2016 data tableGold Demand Trends FY 2016 data table
Gold Demand Trends FY 2016 data table
World Gold Council
 
Cambodia tourism statistics - May 2012
Cambodia tourism statistics - May 2012Cambodia tourism statistics - May 2012
Cambodia tourism statistics - May 2012
Chau Duong
 
4 q2014stats
4 q2014stats4 q2014stats
4 q2014stats
David Usta
 
Key+tyre+industry+figures+2012
Key+tyre+industry+figures+2012Key+tyre+industry+figures+2012
Key+tyre+industry+figures+2012Vladimir Kolev
 
Climate change and nrcs practices chambers
Climate change and nrcs practices   chambersClimate change and nrcs practices   chambers
Climate change and nrcs practices chambers
Soil and Water Conservation Society
 
April 2015 - Export Statistics of Turkish Citrus
April 2015 - Export Statistics of Turkish CitrusApril 2015 - Export Statistics of Turkish Citrus
April 2015 - Export Statistics of Turkish Citrus
Turkish Citrus Promotion Group
 
QNBFS Daily Market Report March 10, 2019
QNBFS Daily Market Report March 10, 2019QNBFS Daily Market Report March 10, 2019
QNBFS Daily Market Report March 10, 2019
QNB Group
 
World Transformer Markets
World Transformer MarketsWorld Transformer Markets
World Transformer Markets
Leonardo ENERGY
 
11.11.2015 macro risk outlook ankhbayar mandal- eng (1)
11.11.2015 macro risk outlook   ankhbayar mandal- eng (1)11.11.2015 macro risk outlook   ankhbayar mandal- eng (1)
11.11.2015 macro risk outlook ankhbayar mandal- eng (1)
The Business Council of Mongolia
 
FDI in Georgia by Economic Sectors
FDI in Georgia by Economic SectorsFDI in Georgia by Economic Sectors
FDI in Georgia by Economic Sectors
Giorgi Vashakidze
 
5 December Daily Market Report
5 December Daily Market Report5 December Daily Market Report
5 December Daily Market ReportQNB Group
 
Steel statistical-yearbook-2014
Steel statistical-yearbook-2014Steel statistical-yearbook-2014
Steel statistical-yearbook-2014
Aditya Kansal
 
Coparticipación marzo-2015
Coparticipación marzo-2015Coparticipación marzo-2015
Coparticipación marzo-2015
Eduardo Nelson German
 
Opportunity Cost to Your Operation
Opportunity Cost to Your OperationOpportunity Cost to Your Operation
Opportunity Cost to Your Operation
National Pork Board
 
January - November 2015 - Export Statistics of Turkish Citrus
January - November 2015 - Export Statistics of Turkish CitrusJanuary - November 2015 - Export Statistics of Turkish Citrus
January - November 2015 - Export Statistics of Turkish Citrus
Turkish Citrus Promotion Group
 
Apac Countries in the Global Knowledge Economy
Apac Countries in the Global Knowledge EconomyApac Countries in the Global Knowledge Economy
Apac Countries in the Global Knowledge Economy
Mohamed Bouanane
 
World Transformer Markets 2002 to 2012
World Transformer Markets 2002 to 2012World Transformer Markets 2002 to 2012
World Transformer Markets 2002 to 2012guest32b4468
 
'United Kingdom Commercial Radio: Q4 2007' by Grant Goddard
'United Kingdom Commercial Radio: Q4 2007' by Grant Goddard'United Kingdom Commercial Radio: Q4 2007' by Grant Goddard
'United Kingdom Commercial Radio: Q4 2007' by Grant Goddard
Grant Goddard
 

Similar to Au demand stats - gdt q1 2016_gold_demand_statistics (20)

Gold Demand Trends FY 2016 data table
Gold Demand Trends FY 2016 data tableGold Demand Trends FY 2016 data table
Gold Demand Trends FY 2016 data table
 
Cambodia tourism statistics - May 2012
Cambodia tourism statistics - May 2012Cambodia tourism statistics - May 2012
Cambodia tourism statistics - May 2012
 
4 q2014stats
4 q2014stats4 q2014stats
4 q2014stats
 
Key+tyre+industry+figures+2012
Key+tyre+industry+figures+2012Key+tyre+industry+figures+2012
Key+tyre+industry+figures+2012
 
Climate change and nrcs practices chambers
Climate change and nrcs practices   chambersClimate change and nrcs practices   chambers
Climate change and nrcs practices chambers
 
April 2015 - Export Statistics of Turkish Citrus
April 2015 - Export Statistics of Turkish CitrusApril 2015 - Export Statistics of Turkish Citrus
April 2015 - Export Statistics of Turkish Citrus
 
QNBFS Daily Market Report March 10, 2019
QNBFS Daily Market Report March 10, 2019QNBFS Daily Market Report March 10, 2019
QNBFS Daily Market Report March 10, 2019
 
Survey 1
Survey 1Survey 1
Survey 1
 
World Transformer Markets
World Transformer MarketsWorld Transformer Markets
World Transformer Markets
 
11.11.2015 macro risk outlook ankhbayar mandal- eng (1)
11.11.2015 macro risk outlook   ankhbayar mandal- eng (1)11.11.2015 macro risk outlook   ankhbayar mandal- eng (1)
11.11.2015 macro risk outlook ankhbayar mandal- eng (1)
 
Call 2 t13_eng
Call 2 t13_engCall 2 t13_eng
Call 2 t13_eng
 
FDI in Georgia by Economic Sectors
FDI in Georgia by Economic SectorsFDI in Georgia by Economic Sectors
FDI in Georgia by Economic Sectors
 
5 December Daily Market Report
5 December Daily Market Report5 December Daily Market Report
5 December Daily Market Report
 
Steel statistical-yearbook-2014
Steel statistical-yearbook-2014Steel statistical-yearbook-2014
Steel statistical-yearbook-2014
 
Coparticipación marzo-2015
Coparticipación marzo-2015Coparticipación marzo-2015
Coparticipación marzo-2015
 
Opportunity Cost to Your Operation
Opportunity Cost to Your OperationOpportunity Cost to Your Operation
Opportunity Cost to Your Operation
 
January - November 2015 - Export Statistics of Turkish Citrus
January - November 2015 - Export Statistics of Turkish CitrusJanuary - November 2015 - Export Statistics of Turkish Citrus
January - November 2015 - Export Statistics of Turkish Citrus
 
Apac Countries in the Global Knowledge Economy
Apac Countries in the Global Knowledge EconomyApac Countries in the Global Knowledge Economy
Apac Countries in the Global Knowledge Economy
 
World Transformer Markets 2002 to 2012
World Transformer Markets 2002 to 2012World Transformer Markets 2002 to 2012
World Transformer Markets 2002 to 2012
 
'United Kingdom Commercial Radio: Q4 2007' by Grant Goddard
'United Kingdom Commercial Radio: Q4 2007' by Grant Goddard'United Kingdom Commercial Radio: Q4 2007' by Grant Goddard
'United Kingdom Commercial Radio: Q4 2007' by Grant Goddard
 

More from John M Riggs

Alch18.01 precious metalsintegritylbma financialcrimebrochure
Alch18.01 precious metalsintegritylbma financialcrimebrochureAlch18.01 precious metalsintegritylbma financialcrimebrochure
Alch18.01 precious metalsintegritylbma financialcrimebrochure
John M Riggs
 
World directory of lbma accredited refineries (summer edition, 2018) (1)
World directory of lbma accredited refineries (summer edition, 2018) (1)World directory of lbma accredited refineries (summer edition, 2018) (1)
World directory of lbma accredited refineries (summer edition, 2018) (1)
John M Riggs
 
Alch18.01 precious metals integrity lbma financial crime brochure
Alch18.01 precious metals integrity lbma financial crime brochureAlch18.01 precious metals integrity lbma financial crime brochure
Alch18.01 precious metals integrity lbma financial crime brochure
John M Riggs
 
Gold hong kong hkma facts and procedures
Gold  hong kong    hkma facts and proceduresGold  hong kong    hkma facts and procedures
Gold hong kong hkma facts and procedures
John M Riggs
 
Aaa pmc 2018
Aaa pmc 2018Aaa pmc 2018
Aaa pmc 2018
John M Riggs
 
Aaa good delivery
Aaa good deliveryAaa good delivery
Aaa good delivery
John M Riggs
 
Aaa global precious metals code (1)
Aaa global precious metals code (1)Aaa global precious metals code (1)
Aaa global precious metals code (1)
John M Riggs
 
Aaa gd rules 2013 july
Aaa gd rules  2013 julyAaa gd rules  2013 july
Aaa gd rules 2013 july
John M Riggs
 
Aaa alch18.01 precious metals integrity lbma financial crime brochure (1)
Aaa alch18.01 precious metals integrity lbma financial crime brochure (1)Aaa alch18.01 precious metals integrity lbma financial crime brochure (1)
Aaa alch18.01 precious metals integrity lbma financial crime brochure (1)
John M Riggs
 
All gold deals were regulated by the BIS
All gold deals were regulated by the BISAll gold deals were regulated by the BIS
All gold deals were regulated by the BIS
John M Riggs
 
Arch guide (1) Guide to the BIS archives
Arch guide (1) Guide to the BIS archivesArch guide (1) Guide to the BIS archives
Arch guide (1) Guide to the BIS archives
John M Riggs
 
Steuerbefreiung bei der einfuhr / Tax exemptions on importation
Steuerbefreiung bei der einfuhr / Tax exemptions on importationSteuerbefreiung bei der einfuhr / Tax exemptions on importation
Steuerbefreiung bei der einfuhr / Tax exemptions on importation
John M Riggs
 
Lbma changes in the price governance (1)
Lbma changes in the price governance (1)Lbma changes in the price governance (1)
Lbma changes in the price governance (1)
John M Riggs
 
Raventech & University of North West presentation - emperors - 9 nov 2016-...
Raventech & University of  North West   presentation - emperors - 9 nov 2016-...Raventech & University of  North West   presentation - emperors - 9 nov 2016-...
Raventech & University of North West presentation - emperors - 9 nov 2016-...
John M Riggs
 
Elgin Country Estate Project Summary as on 20160606
Elgin Country Estate Project Summary as on 20160606 Elgin Country Estate Project Summary as on 20160606
Elgin Country Estate Project Summary as on 20160606
John M Riggs
 
Capepartymanifesto on 2011 110315061455-
Capepartymanifesto on 2011 110315061455-Capepartymanifesto on 2011 110315061455-
Capepartymanifesto on 2011 110315061455-
John M Riggs
 
5 wear check naf-tech diesel - sans 342 report
5 wear check naf-tech diesel - sans 342 report5 wear check naf-tech diesel - sans 342 report
5 wear check naf-tech diesel - sans 342 report
John M Riggs
 
4 diesel electric serv - test report 090827
4 diesel electric serv - test report 0908274 diesel electric serv - test report 090827
4 diesel electric serv - test report 090827
John M Riggs
 
3 cummins gensets naf-tech tests 09 11 20
3 cummins gensets naf-tech tests 09 11 203 cummins gensets naf-tech tests 09 11 20
3 cummins gensets naf-tech tests 09 11 20
John M Riggs
 
Improve fuel consumption with Nanotechnology
Improve fuel consumption with Nanotechnology Improve fuel consumption with Nanotechnology
Improve fuel consumption with Nanotechnology
John M Riggs
 

More from John M Riggs (20)

Alch18.01 precious metalsintegritylbma financialcrimebrochure
Alch18.01 precious metalsintegritylbma financialcrimebrochureAlch18.01 precious metalsintegritylbma financialcrimebrochure
Alch18.01 precious metalsintegritylbma financialcrimebrochure
 
World directory of lbma accredited refineries (summer edition, 2018) (1)
World directory of lbma accredited refineries (summer edition, 2018) (1)World directory of lbma accredited refineries (summer edition, 2018) (1)
World directory of lbma accredited refineries (summer edition, 2018) (1)
 
Alch18.01 precious metals integrity lbma financial crime brochure
Alch18.01 precious metals integrity lbma financial crime brochureAlch18.01 precious metals integrity lbma financial crime brochure
Alch18.01 precious metals integrity lbma financial crime brochure
 
Gold hong kong hkma facts and procedures
Gold  hong kong    hkma facts and proceduresGold  hong kong    hkma facts and procedures
Gold hong kong hkma facts and procedures
 
Aaa pmc 2018
Aaa pmc 2018Aaa pmc 2018
Aaa pmc 2018
 
Aaa good delivery
Aaa good deliveryAaa good delivery
Aaa good delivery
 
Aaa global precious metals code (1)
Aaa global precious metals code (1)Aaa global precious metals code (1)
Aaa global precious metals code (1)
 
Aaa gd rules 2013 july
Aaa gd rules  2013 julyAaa gd rules  2013 july
Aaa gd rules 2013 july
 
Aaa alch18.01 precious metals integrity lbma financial crime brochure (1)
Aaa alch18.01 precious metals integrity lbma financial crime brochure (1)Aaa alch18.01 precious metals integrity lbma financial crime brochure (1)
Aaa alch18.01 precious metals integrity lbma financial crime brochure (1)
 
All gold deals were regulated by the BIS
All gold deals were regulated by the BISAll gold deals were regulated by the BIS
All gold deals were regulated by the BIS
 
Arch guide (1) Guide to the BIS archives
Arch guide (1) Guide to the BIS archivesArch guide (1) Guide to the BIS archives
Arch guide (1) Guide to the BIS archives
 
Steuerbefreiung bei der einfuhr / Tax exemptions on importation
Steuerbefreiung bei der einfuhr / Tax exemptions on importationSteuerbefreiung bei der einfuhr / Tax exemptions on importation
Steuerbefreiung bei der einfuhr / Tax exemptions on importation
 
Lbma changes in the price governance (1)
Lbma changes in the price governance (1)Lbma changes in the price governance (1)
Lbma changes in the price governance (1)
 
Raventech & University of North West presentation - emperors - 9 nov 2016-...
Raventech & University of  North West   presentation - emperors - 9 nov 2016-...Raventech & University of  North West   presentation - emperors - 9 nov 2016-...
Raventech & University of North West presentation - emperors - 9 nov 2016-...
 
Elgin Country Estate Project Summary as on 20160606
Elgin Country Estate Project Summary as on 20160606 Elgin Country Estate Project Summary as on 20160606
Elgin Country Estate Project Summary as on 20160606
 
Capepartymanifesto on 2011 110315061455-
Capepartymanifesto on 2011 110315061455-Capepartymanifesto on 2011 110315061455-
Capepartymanifesto on 2011 110315061455-
 
5 wear check naf-tech diesel - sans 342 report
5 wear check naf-tech diesel - sans 342 report5 wear check naf-tech diesel - sans 342 report
5 wear check naf-tech diesel - sans 342 report
 
4 diesel electric serv - test report 090827
4 diesel electric serv - test report 0908274 diesel electric serv - test report 090827
4 diesel electric serv - test report 090827
 
3 cummins gensets naf-tech tests 09 11 20
3 cummins gensets naf-tech tests 09 11 203 cummins gensets naf-tech tests 09 11 20
3 cummins gensets naf-tech tests 09 11 20
 
Improve fuel consumption with Nanotechnology
Improve fuel consumption with Nanotechnology Improve fuel consumption with Nanotechnology
Improve fuel consumption with Nanotechnology
 

Recently uploaded

ModelingMarketingStrategiesMKS.CollumbiaUniversitypdf
ModelingMarketingStrategiesMKS.CollumbiaUniversitypdfModelingMarketingStrategiesMKS.CollumbiaUniversitypdf
ModelingMarketingStrategiesMKS.CollumbiaUniversitypdf
fisherameliaisabella
 
Affordable Stationery Printing Services in Jaipur | Navpack n Print
Affordable Stationery Printing Services in Jaipur | Navpack n PrintAffordable Stationery Printing Services in Jaipur | Navpack n Print
Affordable Stationery Printing Services in Jaipur | Navpack n Print
Navpack & Print
 
Cracking the Workplace Discipline Code Main.pptx
Cracking the Workplace Discipline Code Main.pptxCracking the Workplace Discipline Code Main.pptx
Cracking the Workplace Discipline Code Main.pptx
Workforce Group
 
BeMetals Presentation_May_22_2024 .pdf
BeMetals Presentation_May_22_2024   .pdfBeMetals Presentation_May_22_2024   .pdf
BeMetals Presentation_May_22_2024 .pdf
DerekIwanaka1
 
Improving profitability for small business
Improving profitability for small businessImproving profitability for small business
Improving profitability for small business
Ben Wann
 
Buy Verified PayPal Account | Buy Google 5 Star Reviews
Buy Verified PayPal Account | Buy Google 5 Star ReviewsBuy Verified PayPal Account | Buy Google 5 Star Reviews
Buy Verified PayPal Account | Buy Google 5 Star Reviews
usawebmarket
 
Tata Group Dials Taiwan for Its Chipmaking Ambition in Gujarat’s Dholera
Tata Group Dials Taiwan for Its Chipmaking Ambition in Gujarat’s DholeraTata Group Dials Taiwan for Its Chipmaking Ambition in Gujarat’s Dholera
Tata Group Dials Taiwan for Its Chipmaking Ambition in Gujarat’s Dholera
Avirahi City Dholera
 
Business Valuation Principles for Entrepreneurs
Business Valuation Principles for EntrepreneursBusiness Valuation Principles for Entrepreneurs
Business Valuation Principles for Entrepreneurs
Ben Wann
 
Meas_Dylan_DMBS_PB1_2024-05XX_Revised.pdf
Meas_Dylan_DMBS_PB1_2024-05XX_Revised.pdfMeas_Dylan_DMBS_PB1_2024-05XX_Revised.pdf
Meas_Dylan_DMBS_PB1_2024-05XX_Revised.pdf
dylandmeas
 
Introduction to Amazon company 111111111111
Introduction to Amazon company 111111111111Introduction to Amazon company 111111111111
Introduction to Amazon company 111111111111
zoyaansari11365
 
Attending a job Interview for B1 and B2 Englsih learners
Attending a job Interview for B1 and B2 Englsih learnersAttending a job Interview for B1 and B2 Englsih learners
Attending a job Interview for B1 and B2 Englsih learners
Erika906060
 
ENTREPRENEURSHIP TRAINING.ppt for graduating class (1).ppt
ENTREPRENEURSHIP TRAINING.ppt for graduating class (1).pptENTREPRENEURSHIP TRAINING.ppt for graduating class (1).ppt
ENTREPRENEURSHIP TRAINING.ppt for graduating class (1).ppt
zechu97
 
Putting the SPARK into Virtual Training.pptx
Putting the SPARK into Virtual Training.pptxPutting the SPARK into Virtual Training.pptx
Putting the SPARK into Virtual Training.pptx
Cynthia Clay
 
Digital Transformation and IT Strategy Toolkit and Templates
Digital Transformation and IT Strategy Toolkit and TemplatesDigital Transformation and IT Strategy Toolkit and Templates
Digital Transformation and IT Strategy Toolkit and Templates
Aurelien Domont, MBA
 
Discover the innovative and creative projects that highlight my journey throu...
Discover the innovative and creative projects that highlight my journey throu...Discover the innovative and creative projects that highlight my journey throu...
Discover the innovative and creative projects that highlight my journey throu...
dylandmeas
 
RMD24 | Retail media: hoe zet je dit in als je geen AH of Unilever bent? Heid...
RMD24 | Retail media: hoe zet je dit in als je geen AH of Unilever bent? Heid...RMD24 | Retail media: hoe zet je dit in als je geen AH of Unilever bent? Heid...
RMD24 | Retail media: hoe zet je dit in als je geen AH of Unilever bent? Heid...
BBPMedia1
 
anas about venice for grade 6f about venice
anas about venice for grade 6f about veniceanas about venice for grade 6f about venice
anas about venice for grade 6f about venice
anasabutalha2013
 
Maksym Vyshnivetskyi: PMO Quality Management (UA)
Maksym Vyshnivetskyi: PMO Quality Management (UA)Maksym Vyshnivetskyi: PMO Quality Management (UA)
Maksym Vyshnivetskyi: PMO Quality Management (UA)
Lviv Startup Club
 
Brand Analysis for an artist named Struan
Brand Analysis for an artist named StruanBrand Analysis for an artist named Struan
Brand Analysis for an artist named Struan
sarahvanessa51503
 
3.0 Project 2_ Developing My Brand Identity Kit.pptx
3.0 Project 2_ Developing My Brand Identity Kit.pptx3.0 Project 2_ Developing My Brand Identity Kit.pptx
3.0 Project 2_ Developing My Brand Identity Kit.pptx
tanyjahb
 

Recently uploaded (20)

ModelingMarketingStrategiesMKS.CollumbiaUniversitypdf
ModelingMarketingStrategiesMKS.CollumbiaUniversitypdfModelingMarketingStrategiesMKS.CollumbiaUniversitypdf
ModelingMarketingStrategiesMKS.CollumbiaUniversitypdf
 
Affordable Stationery Printing Services in Jaipur | Navpack n Print
Affordable Stationery Printing Services in Jaipur | Navpack n PrintAffordable Stationery Printing Services in Jaipur | Navpack n Print
Affordable Stationery Printing Services in Jaipur | Navpack n Print
 
Cracking the Workplace Discipline Code Main.pptx
Cracking the Workplace Discipline Code Main.pptxCracking the Workplace Discipline Code Main.pptx
Cracking the Workplace Discipline Code Main.pptx
 
BeMetals Presentation_May_22_2024 .pdf
BeMetals Presentation_May_22_2024   .pdfBeMetals Presentation_May_22_2024   .pdf
BeMetals Presentation_May_22_2024 .pdf
 
Improving profitability for small business
Improving profitability for small businessImproving profitability for small business
Improving profitability for small business
 
Buy Verified PayPal Account | Buy Google 5 Star Reviews
Buy Verified PayPal Account | Buy Google 5 Star ReviewsBuy Verified PayPal Account | Buy Google 5 Star Reviews
Buy Verified PayPal Account | Buy Google 5 Star Reviews
 
Tata Group Dials Taiwan for Its Chipmaking Ambition in Gujarat’s Dholera
Tata Group Dials Taiwan for Its Chipmaking Ambition in Gujarat’s DholeraTata Group Dials Taiwan for Its Chipmaking Ambition in Gujarat’s Dholera
Tata Group Dials Taiwan for Its Chipmaking Ambition in Gujarat’s Dholera
 
Business Valuation Principles for Entrepreneurs
Business Valuation Principles for EntrepreneursBusiness Valuation Principles for Entrepreneurs
Business Valuation Principles for Entrepreneurs
 
Meas_Dylan_DMBS_PB1_2024-05XX_Revised.pdf
Meas_Dylan_DMBS_PB1_2024-05XX_Revised.pdfMeas_Dylan_DMBS_PB1_2024-05XX_Revised.pdf
Meas_Dylan_DMBS_PB1_2024-05XX_Revised.pdf
 
Introduction to Amazon company 111111111111
Introduction to Amazon company 111111111111Introduction to Amazon company 111111111111
Introduction to Amazon company 111111111111
 
Attending a job Interview for B1 and B2 Englsih learners
Attending a job Interview for B1 and B2 Englsih learnersAttending a job Interview for B1 and B2 Englsih learners
Attending a job Interview for B1 and B2 Englsih learners
 
ENTREPRENEURSHIP TRAINING.ppt for graduating class (1).ppt
ENTREPRENEURSHIP TRAINING.ppt for graduating class (1).pptENTREPRENEURSHIP TRAINING.ppt for graduating class (1).ppt
ENTREPRENEURSHIP TRAINING.ppt for graduating class (1).ppt
 
Putting the SPARK into Virtual Training.pptx
Putting the SPARK into Virtual Training.pptxPutting the SPARK into Virtual Training.pptx
Putting the SPARK into Virtual Training.pptx
 
Digital Transformation and IT Strategy Toolkit and Templates
Digital Transformation and IT Strategy Toolkit and TemplatesDigital Transformation and IT Strategy Toolkit and Templates
Digital Transformation and IT Strategy Toolkit and Templates
 
Discover the innovative and creative projects that highlight my journey throu...
Discover the innovative and creative projects that highlight my journey throu...Discover the innovative and creative projects that highlight my journey throu...
Discover the innovative and creative projects that highlight my journey throu...
 
RMD24 | Retail media: hoe zet je dit in als je geen AH of Unilever bent? Heid...
RMD24 | Retail media: hoe zet je dit in als je geen AH of Unilever bent? Heid...RMD24 | Retail media: hoe zet je dit in als je geen AH of Unilever bent? Heid...
RMD24 | Retail media: hoe zet je dit in als je geen AH of Unilever bent? Heid...
 
anas about venice for grade 6f about venice
anas about venice for grade 6f about veniceanas about venice for grade 6f about venice
anas about venice for grade 6f about venice
 
Maksym Vyshnivetskyi: PMO Quality Management (UA)
Maksym Vyshnivetskyi: PMO Quality Management (UA)Maksym Vyshnivetskyi: PMO Quality Management (UA)
Maksym Vyshnivetskyi: PMO Quality Management (UA)
 
Brand Analysis for an artist named Struan
Brand Analysis for an artist named StruanBrand Analysis for an artist named Struan
Brand Analysis for an artist named Struan
 
3.0 Project 2_ Developing My Brand Identity Kit.pptx
3.0 Project 2_ Developing My Brand Identity Kit.pptx3.0 Project 2_ Developing My Brand Identity Kit.pptx
3.0 Project 2_ Developing My Brand Identity Kit.pptx
 

Au demand stats - gdt q1 2016_gold_demand_statistics

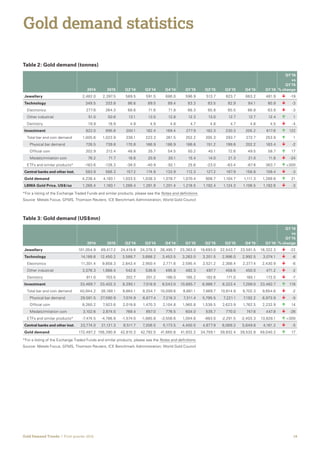
  • 1. 19Gold Demand Trends  |  First quarter 2016 Gold demand statistics Table 2: Gold demand (tonnes) 2014 2015 Q2’14 Q3’14 Q4’14 Q1’15 Q2’15 Q3’15 Q4’15 Q1’16 Q1’16 vs Q1’15 % change Jewellery 2,482.0 2,397.5 589.5 591.5 686.0 596.9 513.7 623.7 663.2 481.9  -19 Technology 348.5 333.8 86.6 89.5 89.4 83.3 83.5 82.9 84.1 80.9  -3 Electronics 277.6 264.3 68.6 71.6 71.8 66.3 65.8 65.5 66.8 63.9  -3 Other industrial 51.0 50.6 13.1 13.0 12.8 12.3 13.0 12.7 12.7 12.4  1 Dentistry 19.9 18.9 4.9 4.9 4.8 4.7 4.8 4.7 4.6 4.5  -4 Investment 822.0 895.6 200.1 182.4 169.4 277.9 182.3 230.3 205.2 617.6  122 Total bar and coin demand 1,005.6 1,023.9 238.1 223.3 261.5 252.2 205.3 293.7 272.7 253.9  1 Physical bar demand 726.5 739.8 170.8 166.9 186.9 186.6 151.2 199.8 202.2 183.4  -2 Official coin 202.9 212.4 48.8 35.7 54.5 50.2 40.1 72.6 49.5 58.7  17 Medals/imitation coin 76.2 71.7 18.6 20.8 20.1 15.4 14.0 21.3 21.0 11.8  -24 ETFs and similar products* -183.6 -128.3 -38.0 -40.9 -92.1 25.6 -23.0 -63.4 -67.6 363.7  >300 Central banks and other inst. 583.9 566.3 157.2 174.9 133.9 112.3 127.2 167.9 158.8 109.4  -3 Gold demand 4,236.4 4,193.1 1,033.5 1,038.3 1,078.7 1,070.4 906.7 1,104.7 1,111.3 1,289.8  21 LBMA Gold Price, US$/oz 1,266.4 1,160.1 1,288.4 1,281.9 1,201.4 1,218.5 1,192.4 1,124.3 1,106.5 1,182.6  -3 *For a listing of the Exchange Traded Funds and similar products, please see the Notes and definitions. Source: Metals Focus; GFMS, Thomson Reuters; ICE Benchmark Administration; World Gold Council Table 3: Gold demand (US$mn) 2014 2015 Q2’14 Q3’14 Q4’14 Q1’15 Q2’15 Q3’15 Q4’15 Q1’16 Q1’16 vs Q1’15 % change Jewellery 101,054.9 89,417.2 24,419.8 24,378.3 26,495.7 23,383.0 19,693.0 22,543.7 23,591.5 18,322.3  -22 Technology 14,188.6 12,450.2 3,588.7 3,688.2 3,453.5 3,263.0 3,201.5 2,996.0 2,992.5 3,074.1  -6 Electronics 11,301.4 9,858.3 2,843.4 2,950.4 2,771.6 2,595.4 2,521.2 2,366.4 2,377.4 2,430.9  -6 Other industrial 2,076.3 1,888.4 542.6 536.6 495.8 482.3 497.7 458.6 450.0 471.2  -2 Dentistry 811.0 703.5 202.7 201.2 186.0 185.2 182.6 171.0 165.1 172.0  -7 Investment 33,469.7 33,402.3 8,290.1 7,518.9 6,543.0 10,885.7 6,986.7 8,323.4 7,299.0 23,482.7  116 Total bar and coin demand 40,944.2 38,189.1 9,864.1 9,204.7 10,099.6 9,881.1 7,869.7 10,614.9 9,702.3 9,654.6  -2 Physical bar demand 29,581.5 27,590.9 7,074.9 6,877.4 7,218.3 7,311.4 5,795.5 7,221.1 7,192.2 6,973.9  -5 Official coin 8,260.2 7,923.6 2,019.8 1,470.3 2,104.8 1,965.8 1,538.5 2,623.9 1,762.5 2,232.9  14 Medals/imitation coin 3,102.6 2,674.5 769.4 857.0 776.5 604.0 535.7 770.0 747.6 447.8  -26 ETFs and similar products* -7,474.5 -4,786.8 -1,574.0 -1,685.8 -3,556.6 1,004.6 -883.0 -2,291.5 -2,403.3 13,828.1  >300 Central banks and other inst. 23,774.0 21,121.3 6,511.7 7,206.5 5,173.5 4,400.5 4,877.9 6,069.2 5,649.8 4,161.2  -5 Gold demand 172,487.2 156,390.9 42,810.3 42,792.0 41,665.6 41,932.2 34,759.1 39,932.4 39,532.8 49,040.2  17 *For a listing of the Exchange Traded Funds and similar products, please see the Notes and definitions. Source: Metals Focus; GFMS, Thomson Reuters; ICE Benchmark Administration; World Gold Council
  • 2. 20Gold Demand Trends  |  First quarter 2016 Table 4: Gold supply and demand World Gold Council presentation 2014 2015 Q2’14 Q3’14 Q4’14 Q1’15 Q2’15 Q3’15 Q4’15 Q1’16 Q1’16 vs Q1’15 % change Supply Mine production 3,153.1 3,211.4 759.6 831.2 845.1 729.4 787.7 847.8 846.4 734.0  1 Net producer hedging 106.5 9.2 50.0 -9.2 51.9 -11.6 -6.9 14.9 13.0 40.0 - - Total mine supply 3,259.6 3,220.6 809.6 822.0 897.0 717.7 780.8 862.7 859.4 774.0  8 Recycled gold 1,202.1 1,127.0 279.9 274.4 270.0 363.2 266.8 261.5 235.5 360.9  -1 Total supply 4,461.7 4,347.6 1,089.5 1,096.4 1,167.1 1,081.0 1,047.6 1,124.2 1,094.9 1,134.9  5 Demand Fabrication – Jewellery1 2,502.7 2,438.5 610.2 639.5 648.6 608.0 542.5 662.6 625.3 478.5  -21 Fabrication – Technology 348.5 333.8 86.6 89.5 89.4 83.3 83.5 82.9 84.1 80.9  -3 Sub-total above fabrication 2,851.1 2,772.3 696.8 729.0 738.0 691.3 626.1 745.5 709.5 559.4  -19 Total bar and coin demand 1,005.6 1,023.9 238.1 223.3 261.5 252.2 205.3 293.7 272.7 253.9  1 ETFs and similar products2 -183.6 -128.3 -38.0 -40.9 -92.1 25.6 -23.0 -63.4 -67.6 363.7  >300 Central banks and other inst.3 583.9 566.3 157.2 174.9 133.9 112.3 127.2 167.9 158.8 109.4  -3 Gold demand 4,257.1 4,234.2 1,054.2 1,086.3 1,041.3 1,081.5 935.6 1,143.7 1,073.5 1,286.5  19 Surplus/Deficit4 204.6 113.4 35.3 10.1 125.8 -0.6 112.1 -19.5 21.4 -151.5 - - Total demand 4,461.7 4,347.6 1,089.5 1,096.4 1,167.1 1,081.0 1,047.6 1,124.2 1,094.9 1,134.9  5 LBMA Gold Price, US$/oz 1,266.4 1,160.1 1,288.4 1,281.9 1,201.4 1,218.5 1,192.4 1,124.3 1,106.5 1,182.6  -3 1 For an explanation of jewellery fabrication, please see the Notes and definitions. 2 For a listing of the Exchange Traded Funds and similar products, please see the Notes and definitions. 3 Excluding any delta hedging of central bank options. 4 For an explanation of Surplus/Deficit, please see the Notes and definitions. Source: Metals Focus; GFMS, Thomson Reuters; ICE Benchmark Administration; World Gold Council Table 5: Quarterly average price 2015 Q1'15 Q2'15 Q3'15 Q4'15 Q1'16 Q1’16 vs Q1’15 % change US$/oz 1,160.1 1,218.5 1,192.4 1,124.3 1,106.5 1,182.6  -3 €/oz 1,045.3 1,083.1 1,078.0 1,011.5 1,010.1 1,072.3  -1 £/oz 759.0 804.9 777.7 726.0 728.6 826.9  3 CHF/kg 35,863.3 37,292.5 36,082.7 34,875.9 35,230.2 37,774.4  1 ¥/g 4,513.8 4,666.8 4,656.4 4,416.2 4,320.4 4,374.5  -6 Rs/10g 23,903.2 24,377.9 24,332.8 23,476.1 23,446.0 25,677.0  5 RMB/g 234.2 244.3 237.8 227.8 227.2 248.7  2 TL/g 101.4 96.5 102.3 103.1 103.4 111.9  16 Source: ICE Benchmark Administration; Thomson Reuters Datastream; World Gold Council
  • 3. 21Gold Demand Trends  |  First quarter 2016 Table 6: Jewellery demand in selected countries (tonnes) 2015 Q1'15 Q2'15 Q3'15 Q4'15 Q1'16 Q1’16 vs Q1’15 % change India 668.5 150.8 122.1 215.1 180.4 88.4  -41 Pakistan 23.2 5.3 5.4 5.9 6.6 6.0  13 Sri Lanka 6.8 1.7 2.0 1.3 1.7 1.5  -14 Greater China 811.9 231.7 181.0 196.0 203.1 191.6  -17 China 753.4 216.3 169.0 180.6 187.6 179.4  -17 Hong Kong 51.4 13.6 10.5 13.7 13.6 10.2  -25 Taiwan 7.0 1.8 1.6 1.7 2.0 1.9  6 Japan 16.5 3.2 3.8 4.4 5.1 3.5  10 Indonesia 38.9 12.1 8.5 9.3 9.0 10.8  -10 Malaysia 8.4 2.8 1.7 2.0 1.9 2.2  -23 Singapore 12.2 3.4 2.7 3.0 3.1 3.3  -3 South Korea 14.1 3.7 2.9 3.7 3.9 3.9  8 Thailand 12.2 3.4 2.8 2.9 3.1 3.2  -4 Vietnam 15.6 4.4 3.7 3.5 3.9 4.7  6 Middle East 230.3 63.0 57.7 56.0 53.6 56.5  -10 Saudi Arabia 71.1 17.4 18.8 16.6 18.4 15.3  -12 UAE 51.4 16.3 14.9 10.0 10.2 14.0  -14 Kuwait 12.7 3.6 3.1 2.3 3.7 3.1  -15 Egypt 38.2 9.3 8.9 11.8 8.1 7.7  -18 Iran 37.2 9.0 7.2 11.4 9.5 9.9  10 Other Middle East 19.7 7.3 4.8 3.9 3.7 6.5  -11 Turkey 49.0 10.4 11.6 12.1 15.0 8.5  -18 Russia 41.1 9.2 9.1 12.5 10.3 7.7  -17 Americas 170.5 32.5 39.1 38.2 60.8 32.9  1 United States 119.8 22.1 25.6 26.5 45.6 22.6  2 Canada 14.2 2.7 3.5 2.7 5.3 2.6  -3 Mexico 16.6 4.0 4.2 4.4 4.1 4.1  4 Brazil 19.9 3.8 5.8 4.7 5.7 3.5  -6 Europe ex CIS 75.9 12.8 14.5 12.8 35.8 12.7  -1 France 13.6 2.8 2.6 2.0 6.3 2.7  -2 Germany 10.2 1.7 2.1 1.2 5.2 1.7  -1 Italy 18.0 2.5 3.6 2.8 9.0 2.4  -3 Spain 8.3 1.8 2.1 1.9 2.5 1.9  3 United Kingdom 25.9 4.0 4.1 4.9 12.9 4.0  1 Switzerland - - - - - - - - Austria - - - - - - - - Other Europe - - - - - - - - Total above 2,195.1 550.5 468.5 578.7 597.3 437.5  -21 Other and stock change 202.4 46.4 45.2 44.9 65.9 44.4  -4 World total 2,397.5 596.9 513.7 623.7 663.2 481.9  -19 Source: Metals Focus; World Gold Council
  • 4. 22Gold Demand Trends  |  First quarter 2016 Table 7: Total bar and coin demand in selected countries (tonnes) 2015 Q1'15 Q2'15 Q3'15 Q4'15 Q1'16 Q1’16 vs Q1’15 % change India 195.8 40.9 37.7 57.0 60.2 28.0  -31 Pakistan 14.5 3.1 3.8 3.7 4.0 3.4  11 Sri Lanka - - - - - - - - Greater China 211.1 61.2 43.3 54.3 52.3 63.7  4 China 203.3 59.1 41.6 52.3 50.3 61.9  5 Hong Kong 1.5 0.4 0.3 0.5 0.3 0.4  -3 Taiwan 6.4 1.7 1.4 1.5 1.7 1.4  -17 Japan 16.2 -3.2 -0.2 10.8 8.9 3.3 - - Indonesia 20.1 5.7 4.5 4.6 5.3 5.2  -8 Malaysia 7.3 2.5 1.5 1.7 1.6 1.5  -40 Singapore 5.9 1.6 1.2 1.5 1.6 1.2  -27 South Korea 7.5 1.7 1.3 2.2 2.4 1.2  -26 Thailand 78.0 19.5 16.4 20.5 21.5 22.4  15 Vietnam 47.8 14.4 10.8 11.5 11.1 11.5  -21 Middle East 62.4 23.9 14.5 13.1 10.9 22.9  -4 Saudi Arabia 15.2 4.8 3.2 3.4 3.9 3.9  -19 UAE 8.7 2.9 2.3 1.8 1.8 2.5  -15 Kuwait 0.8 0.2 0.2 0.2 0.2 0.2  -17 Egypt 4.9 1.1 1.2 1.4 1.2 0.9  -22 Iran 30.1 14.2 7.0 5.8 3.1 14.9  5 Other Middle East 2.6 0.8 0.6 0.6 0.6 0.6  -17 Turkey 23.1 5.2 4.5 9.2 4.2 5.0  -5 Russia 4.8 1.3 1.3 1.2 1.1 1.0  -22 Americas 78.0 13.4 13.6 32.7 18.4 20.2  51 United States 71.5 11.8 12.3 30.8 16.6 18.3  55 Canada 2.9 0.7 0.5 0.9 0.8 1.0  42 Mexico 2.2 0.5 0.4 0.7 0.6 0.6  4 Brazil 1.4 0.4 0.4 0.4 0.4 0.3  -10 Europe ex CIS 222.1 58.1 45.3 59.9 58.8 58.4  0 France 1.6 1.0 -0.3 0.4 0.5 0.8  -21 Germany 116.0 30.9 23.1 30.2 31.7 31.1  1 Italy - - - - - - - - Spain - - - - - - - - United Kingdom 9.4 2.0 1.8 2.7 2.9 3.2  61 Switzerland 49.2 13.6 10.7 13.3 11.6 12.7  -7 Austria 12.2 3.0 2.5 3.5 3.2 2.9  -1 Other Europe 33.7 7.7 7.5 9.7 8.9 7.7  0 Total above 994.6 249.2 199.4 283.9 262.1 248.8  0 Other and stock change 29.3 3.0 5.9 9.8 10.6 5.1  71 World total 1,023.9 252.2 205.3 293.7 272.7 253.9  1 Source: Metals Focus; World Gold Council
  • 5. 23Gold Demand Trends  |  First quarter 2016 Table 8: Consumer demand in selected countries (tonnes) 2015 Q1'15 Q2'15 Q3'15 Q4'15 Q1'16 Q1’16 vs Q1’15 % change India 864.3 191.7 159.8 272.1 240.6 116.5  -39 Pakistan 37.6 8.4 9.2 9.6 10.5 9.4  13 Sri Lanka 6.8 1.7 2.0 1.3 1.7 1.5  -14 Greater China 1,023.0 292.9 224.3 250.3 255.4 255.3  -13 China 956.7 275.4 210.6 232.9 237.8 241.3  -12 Hong Kong 52.8 14.0 10.8 14.2 13.9 10.6  -24 Taiwan 13.4 3.6 2.9 3.2 3.7 3.4  -5 Japan 32.8 0.0 3.6 15.2 14.0 6.8  >300 Indonesia 59.0 17.8 13.0 14.0 14.3 16.1  -10 Malaysia 15.7 5.3 3.2 3.7 3.5 3.7  -31 Singapore 18.1 5.0 3.9 4.5 4.7 4.5  -11 South Korea 21.6 5.3 4.2 5.9 6.2 5.2  -3 Thailand 90.2 22.9 19.2 23.5 24.6 25.7  12 Vietnam 63.4 18.9 14.5 15.0 15.0 16.2  -14 Middle East 292.7 86.9 72.2 69.1 64.5 79.3  -9 Saudi Arabia 86.3 22.1 22.0 19.9 22.3 19.1  -14 UAE 60.1 19.2 17.2 11.8 12.0 16.5  -14 Kuwait 13.6 3.9 3.3 2.5 3.9 3.3  -15 Egypt 43.1 10.4 10.1 13.3 9.4 8.5  -18 Iran 67.3 23.2 14.3 17.2 12.6 24.7  7 Other Middle East 22.3 8.1 5.4 4.4 4.3 7.2  -12 Turkey 72.1 15.6 16.1 21.2 19.2 13.5  -14 Russia 45.9 10.5 10.3 13.7 11.4 8.7  -18 Americas 248.5 45.9 52.6 70.9 79.1 53.0  16 United States 191.3 33.9 38.0 57.3 62.2 40.9  21 Canada 17.1 3.4 4.0 3.6 6.1 3.6  6 Mexico 18.8 4.5 4.5 5.0 4.7 4.7  4 Brazil 21.3 4.1 6.1 5.0 6.0 3.8  -7 Europe ex CIS 298.1 70.9 59.8 72.7 94.7 71.1  0 France 15.2 3.8 2.3 2.3 6.8 3.5  -7 Germany 126.1 32.7 25.2 31.4 36.9 32.8  1 Italy 18.0 2.5 3.6 2.8 9.0 2.4  -3 Spain 8.3 1.8 2.1 1.9 2.5 1.9  3 United Kingdom 35.3 6.0 6.0 7.6 15.8 7.2  21 Switzerland 49.2 13.6 10.7 13.3 11.6 12.7  -7 Austria 12.2 3.0 2.5 3.5 3.2 2.9  -1 Other Europe 33.7 7.7 7.5 9.7 8.9 7.7  0 Total above 3,189.7 799.8 667.9 862.6 859.4 686.3  -14 Other and stock change 231.7 49.4 51.1 54.7 76.5 49.6  0 World total 3,421.4 849.1 719.0 917.3 935.9 735.8  -13 Source: Metals Focus; World Gold Council
  • 6. 24Gold Demand Trends  |  First quarter 2016 Table 9: Indian supply estimates (tonnes) 2015 Q1'15 Q2'15 Q3'15 Q4'15 Q1'16 Q1’16 vs Q1’15 % change Supply Gross bullion imports 1,065.0 249.2 235.9 304.8 275.1 151.4  -39 of which doré1 229.0 38.6 56.7 67.3 66.5 34.8  -10 Net bullion imports 913.6 220.2 202.9 262.9 227.6 134.4  -39 Scrap 80.2 18.0 24.0 18.2 20.0 14.0  -22 Domestic supply from other sources2 9.2 2.4 2.5 2.2 2.1 3.3  38 Total supply3 1,003.0 240.6 229.4 283.3 249.7 151.7  -37 1 Volume of fine gold material contained in the doré. 2 Domestic supply from local mine production, recovery from imported copper concentrates and disinvestment. 3 This supply can be consumed across the three sectors – jewellery, investment and technology. Consequently, the total supply figure in the table will not add to jewellery plus investment demand for India. Source: Metals Focus; World Gold Council Table 11: Physically-backed gold ETF AuM by region in tonnes Q1'15 Q2'15 Q3'15 Q4'15 Q1'16 Q1’16 vs Q1’15 tonnage change Q1’16 vs Q1’15 % change North America 1,068.6 1,044.8 1,012.3 955.9 1,186.9  118.3  11 Europe 612.0 618.6 583.9 570.2 690.5  78.5  13 Asia 43.3 41.0 42.9 46.0 54.1  10.8  25 Other 40.6 37.0 39.1 38.4 42.8  2.2  5 Global total 1,764.5 1,741.5 1,678.1 1,610.6 1,974.3  209.7  12 Source: Respective ETP providers; Bloomberg; ICE Benchmark Administration; World Gold Council Table 10: Top 10 physically-backed gold ETFs by AuM in tonnes Fund Country Holdings as of end March Q1’16 vs Q1’15 % change 1 SPDR Gold Shares United States 819.3  11 2 iShares Gold Trust United States 186.3  13 3 ZKB Gold ETF Switzerland 137.7  -1 4 ETFS Physical Gold United Kingdom 113.9  2 5 Gold Bullion Securities United Kingdom 92.3  8 6 Source Physical Gold United Kingdom 73.7  51 7 Xetra-Gold Germany 70.7  28 8 Sprott Physical Gold Trust United States 54.8  39 9 Central Fund of Canada Ltd Canada 52.7  0 10 Julius Baer Physical Gold Fund Switzerland 44.2  -10 Global total 1,974.3  12 Source: Respective ETP providers; Bloomberg; ICE Benchmark Administration; World Gold Council
  • 7. 25Gold Demand Trends  |  First quarter 2016 Tonnes % of reserves 21 Venezuela 272.9 66% 22 Kazakhstan 228.3 32% 23 Belgium 227.4 36% 24 Philippines 195.9 10% 25 Algeria 173.6 5% 26 Thailand 152.4 3% 27 Singapore 127.4 2% 28 Sweden 125.7 8% 29 South Africa 125.2 11% 30 Mexico 121.1 3% 31 Libya 116.6 6% 32 Greece 112.7 59% 33 BIS 108.0 - 34 Korea 104.4 1% 35 Romania 103.7 10% 36 Poland 102.9 4% 37 Iraq 89.8 7% 38 Australia 79.9 6% 39 Kuwait 79.0 9% 40 Indonesia 78.1 3% Tonnes % of reserves 1 United States 8,133.5 75% 2 Germany 3,381.0 69% 3 IMF 2,814.0 - 4 Italy 2,451.8 68% 5 France 2,435.7 63% 6 China 1,797.5 2% 7 Russia 1,460.4 15% 8 Switzerland 1,040.0 7% 9 Japan 765.2 2% 10 Netherlands 612.5 61% 11 India 557.7 6% 12 ECB 504.8 27% 13 Turkey 479.3 17% 14 Taiwan 422.7 4% 15 Portugal 382.5 71% 16 Saudi Arabia 322.9 2% 17 United Kingdom 310.3 9% 18 Lebanon 286.8 23% 19 Spain 281.6 21% 20 Austria 280.0 45% Table 12: Top 40 reported official gold holdings (as at March 2016) For information on the methodology behind this data, as well as footnotes for specific countries, please see our table of Latest World Official Gold Reserves, at http://www.gold.org/government-affairs/gold-reserves Source: IMF IFS; World Gold Council Table 13: Historical data for gold demand Tonnes Jewellery Total bar and coin investment ETFs and similar* Technology Central banks Total 2006 2,301.4 429.8 258.7 471.7 -365.4 3,096.2 2007 2,424.9 437.5 259.6 477.7 -483.8 3,116.0 2008 2,306.2 917.9 325.0 464.7 -235.4 3,778.3 2009 1,816.3 832.3 644.6 414.4 -33.6 3,674.0 2010 2,051.6 1,201.2 420.8 460.5 79.2 4,213.2 2011 2,091.6 1,491.9 236.9 428.5 480.8 4,729.8 2012 2,130.4 1,297.5 306.6 381.4 569.3 4,685.1 2013 2,678.8 1,705.1 -914.1 356.0 623.8 4,449.6 2014 2,482.0 1,005.6 -183.6 348.5 583.9 4,236.4 2015 2,397.5 1,023.9 -128.3 333.8 566.3 4,193.1 Q2'14 589.5 238.1 -38.0 86.6 157.2 1,033.5 Q3'14 591.5 223.3 -40.9 89.5 174.9 1,038.3 Q4'14 686.0 261.5 -92.1 89.4 133.9 1,078.7 Q1'15 596.9 252.2 25.6 83.3 112.3 1,070.4 Q2'15 513.7 205.3 -23.0 83.5 127.2 906.7 Q3'15 623.7 293.7 -63.4 82.9 167.9 1,104.7 Q4'15 663.2 272.7 -67.6 84.1 158.8 1,111.3 Q1'16 481.9 253.9 363.7 80.9 109.4 1,289.8 *For a listing of the Exchange Traded Funds and similar products, please see the Notes and definitions. Source: Metals Focus; GFMS, Thomson Reuters; World Gold Council