SlideShare a Scribd company logo
1 of 25
Download to read offline
Assessing	 impact	 of	 a	 Teacher	 professional	 development	
program	on	student	problem-solving	performance	
Farzaneh	Saadati1	
·	Patricio	Felmer1,2	
Accepted:	16	December	2020	©	FIZ	Karlsruhe	2021	
Abstract	
In this paper we report on the impact of a year-long teacher professional development (PD) workshop
on student problem- solving skills. The PD workshop was held in Chile and promoted the use of
collaborative problem-solving activities in the classroom, through monthly sessions during the school
year. Participant teachers met with a monitor to solve a new problem collaboratively, plan a problem-
solving activity for their next lesson, and reflect on their activities from their previous les- son. The study
documents the performance of two groups of students when solving non-routine mathematics problems
in two similar and non-equal tests consisting of three problems each, before and after the year of
application of the workshop. The first group of students was the experimental group with collaborative
problem-solving activities, as proposed in the PD workshop. The second group was the control group,
composed of students whose teachers followed traditional teaching. In the first part of the paper we
present the results of pre- and post-tests in which the students in the experimental group improved their
problem-solving performance in a significant way compared with the control group. In the second part,
we present a sample of representation strategy used by successful students in both groups and we
discuss, in general, student strategies in solving test problems.
Keywords	Collaborative problem solving · Impact of a program · Professional development program ·
Problem-solving strategies · Students’ performance
1	Introduction	
A mathematics problem of a non-routine nature is one in which the solver does not know an immediate
strategy to solve it, and thus requires various skills to do so. From an international perspective,
improving students’ skills in order to solve such problems (skills in problem solving; PS) is considered
a standard of quality education in mathematics. Consequently, in the quest for effective teaching of
mathe- matics, there are researchers around the world studying how to improve students’ PS skills
(National Research Council 2011; Reynolds and Muijs 1999; Tambunan 2019).
In particular, integrating collaborative PS in teaching and learning activities is considered a means for
improving students’ problem-solving abilities (Fawcett and Gar- ton 2005). Researchers embraced
different viewpoints in explaining the function of collaborative learning in enhanc- ing student learning.
From a sociocultural perspective, they concluded that collaboration “in the classroom allows stu- dents
to test ideas, hear and incorporate the ideas of others, consolidate their thinking by putting ideas into
words, and hence, gain a deeper understanding of key concepts” (Soucy McCrone 2005. p. 111). From a
cognitive load perspective, researchers agreed that when students do a task collabora- tively, knowledge
is easily obtained from peers by borrowing the required information from others’ long-term memory
(Paas and Sweller 2012). In general, research revealed the importance of peer interactions and
collaboration in order to improve individual learning (Blumenfeld, Marx, Soloway, and Krajcik 1996;
Fawcett and Garton 2005), and math- ematical problem-solving skills (Francisco 2013; Saadati and Reyes
2019).
Those developing the Chilean national curriculum were receptive of these ideas. In its 2012 reform, the
main change for mathematics was the introduction of abilities and attitudes alongside content.
Collaboration, persever- ance, PS, mathematical communication and reasoning are among the promoted
abilities and attitudes (MINEDUC 2012). Despite the emphasis on PS and abilities in the new curriculum,
several studies show that problem solving activi- ties are practically absent in Chilean classrooms
(Felmer and Perdomo-Dı́az 2016). Furthermore, the results of inter- national examinations (PISA) show
that Chilean students are neither successful mathematics problem solvers (OECD 2016) nor
collaborative problem solvers (OECD 2017). On the other hand, the results of students’ mathematics
profi- ciency in national examinations (called SIMCE) have been essentially stable over the last ten years
(National Agency of Quality of Education 2018). What may explain these results? The mathematics
teaching in Chile, as in many countries, is basically traditional (Radovic and Preiss 2010), and cor-
responds to the way the teachers were taught in school and during their initial teaching training (Felmer
and Perdomo- Dı́az 2016; Chandia, Rojas, Rojas and Howard 2016). The lack of systematic PD programs
for introducing the national curriculum changes in classrooms, as abilities and attitudes, may be the
explanation.
As a way of contributing to the improvement of math- ematical education in Chile, bringing the benefits
of collabo- rative learning and problem-solving skills, we engaged in a long-term research and
development project known as the ARPA1
Initiative (Felmer, Perdomo-Dı́az, and Reyes 2019). The long-
term goal of this project is to be part of the pro- cess of changing the traditional style in Chilean
mathematics classrooms by promoting an active approach for the devel- opment of students’ skills in
mathematics, in particular PS skills. The project strategy is to induce changes in teachers’ practices in
classrooms though professional development (PD) workshops, in particular a 9-month-long workshop,
whose impact on students is reported in this paper.
This workshop was designed for mathematics teachers, with a focus on training and supporting them to
establish collaborative PS practices for their students in the classroom, with the goal of developing
problem solving and other skills in individual students. Our purpose in this paper is to pro- vide evidence
on whether or not, and how, students improve their individual PS skills in the case of 6th grade students
whose teachers participated in the above-mentioned PD workshop.
Moreover, since non-routine problems offer opportuni- ties for students to mobilize skills, and
illuminate creativ- ity in choosing an appropriate representation strategy to solve them (Polya 1957), it
is our concern to identify suc- cessful strategies that students use for solving these prob- lems. In order
to improve student mathematics learning, it is important to know how they elaborate their thoughts in
solving non-routine problems, which demands flexibility in thinking with an extension to previous
knowledge.
Consequently, we concern ourselves with students’ achievements in non-routine PS as a result of
participating in collaborative PS activities, and in identifying successful strategies. In this paper we
answer two research questions:
• Is there a difference in students’ problem-solving perfor- mance after practicing in collaborative
problem-solving activities?
• What are the frequent representation strategies occur- ring in mathematical solutions presented by
successful problem solvers?
2	Collaborative	learning	as	an	instructional	practice,	and	the	role	of	PDs	
Empirical studies have found collaborative learning in math- ematics to be a teaching method that
promotes students’ problem-solving abilities in different ways (Soucy McCrone 2005; Sofroniou and
Poutos 2016). Swan (2006) considered collaborative learning to be a resilient approach that encour-
ages students to overcome affective barriers while learning mathematics. Francisco (2013) explained
that collaborative learning allows individuals to build on each other’s ideas, and thereby to promote
their mathematical understanding. Saadati and Reyes (2019) argued that collaborative learn- ing
improves individual problem-solving skills, especially for those students with positive dispositions
toward math- ematics. Pijls, Dekker, and Van Hout-Wolters (2007), in an experimental study, found that
individuals benefit from collaborative learning by engaging in certain activities and sharing their ideas,
by explaining, justifying, and recon- structing their work. Dahl, Klemp, and Nilssen (2018) also
highlighted the role of communication skills in promoting the impact of collaborative learning and
stimulating stu- dents’ mathematical progress “by giving each other positive feedback and by
acknowledging each other’s contributions” (p. 11).
On the other hand, the effectiveness of collaborative PS depends mainly on teachers, who have a crucial
role as guides and facilitators in their classrooms. It is also related to the experience of teachers with
non-routine problems and classroom organization: for example, a teacher’s abil- ity to manage groups
in a collaborative classroom is a fac- tor in improving student enjoyment of mathematics as well as their
engagement (Liljedahl 2014). Teachers face chal- lenges in identifying well-designed tasks and setting
them up appropriately when attempting to conduct active learn- ing in their classrooms (Stein, Engle,
Smith, and Hughes 2008). Therefore, teachers need to be prepared in a process designed to enhance
their knowledge and skills, in order to establish changes in their instruction and, in turn, improve their
students’ learning (Desimone 2009). Among such processes, PD programs are crucial instruments for
reach- ing the desirable changes in teacher practice and student outcomes (Darling-Hammond, Hyler,
and Gardner 2017). Borko (2004) and Desimone (2009) proposed two concep- tual models for studying
the effect of a PD program. In these two models, the changes in students’ learning are considered an
important impact of a PD, beyond the impact of the PD on teachers’ mathematical knowledge and skills.
For exam- ple, Jacob, Hill and Corey (2017) conducted a study to fol- low teachers and their students
after participating in a PD, and found some evidence of positive impact on teachers’ mathematical
knowledge; however, they did not report any changes in student outcomes.
To sum up, based on what researchers claimed and the evidence reported, in order to change classroom
practices and improve problem solving abilities in students through collaborative-based PS instruction
effectively and efficiently, teachers need preparation through proper PD programs. However, research
in this important educational area is not well developed, with many important questions remaining. Much
work has been done on general characteristics that a program should have to be effective (Desimone
2009; Desimone, Porter, Garet, Yoon, and Birman 2002; Darling- Hammond et al. 2017), but work still
remains to develop a program assessment (TNTP 2015; Jacob, Hill, and Corey 2017; Borko, Jacobs, and
Koellner 2010). Moreover, in order to document verification for the impact of a PD program, research
on the impact in student learning is desirable.
3	Students’	problem-solving	strategies
Mathematics problem-solving is a process of finding a solu- tion when the procedure is not clear for
problem solvers. In this case, problem solvers need to use some tactical skills to choose or find suitable
techniques to get a solution. Early work focused on describing the problem-solving process, which Pólya
(1957) suggested could be encapsulated in a four-stage problem-solving heuristic, as follows:
understand- ing the problem, devising a plan, carrying it out, and looking back. A heuristic is, in fact, a
strategy to formulate a prob- lem, which helps the problem solver to find a solution that can enhance PS
performance (Schoenfeld 1982). However, in following the process there is no guarantee that a problem
solver will arrive at a solution. Students may need to re- formulate the problem because these problems
“possess a conceptual ‘slipperiness’ for solvers: the nature of what the solver interprets as problematic
may change as the solvers develop understanding and ‘get a handle’ on the problem and progress to a
solution” (Cai and Cifarelli 2005).
Considering students’ representations in terms of a set of conventional notation, symbols, figures, and
diagrams is also central for researchers to understand students’ construc- tion and understanding of
mathematical ideas (Dahl 2019). According to Gick (1986), recent information-processing theories of
PS have emphasized two important processes of PS: (a) generation of a problem representation based
on the solver’s view of the problem, and (b) a solution process that involves a search through the
representation. A student’s thinking process can be understood in the relation between the way that
he/she represents the problem’s elements and given information and the way that he/she develops a
solu- tion in the representation. According to Duijzer, den Heuvel- Panhuizen, Veldhuis, and Doorman
(2019) “Making con- nections between variables and proficiently constructing representations is key to
higher-order thinking activities within mathematics [] education” (p. 4491). We refer to the process as
a “representation strategy”, a detailed invented or classical representation, which can be seen in a
student’s col- lection of inscriptions while attempting to solve a problem. Cai (2000) classified
representations in a student’s inscrip- tions as follows: verbal (primarily written words), pictorial (a
picture or drawing), arithmetic (arithmetic expressions), and algebraic (algebraic expressions)
representation. This classification can illuminate students’ strategies as they con- nect their knowledge
and abilities to a way they process the information. For example, in generalization of a pattern, Zazkis
and Liljedahl (2002) showed that students prefer to express or write the pattern of generalization rather
than employing algebraic notation, which they concluded was a tendency that indicated a gap between
students’ ability to express their knowledge in a verbal form and their abil- ity to work with algebra
comfortably. On the other hand, Nistal, Van Dooren, Clarebout, Elen, and Verschaffel (2009) explained
that students’ representational choices can be influenced by their prior experiences and knowledge
about strategies. In general, Cai and Hwang (2002) concluded that cultural issues, type of problems, and
teachers’ classroom practices influence students’ tendency to choose one of these representation
strategies while solving a problem.
In mathematical non-routine problem-solving processes, though, there is another critical ability for a
problem solver to be successful, which is flexibility in using heuristic strate- gies (Elia, van den Heuvel-
Panhuizen, and Kolovou 2009; Heinze, Star, and Verschaffel 2009). These researchers argued that the
flexible and adaptive use of strategies and representations enables students to solve problems accu-
rately. However, there are always some common/minimal errors appearing in students’ problem solving
and, as Cai (2000) declared, students’ errors and difficulties in solving problems are not due to their
lack of procedural knowledge but rather to their incomplete conceptual understanding.
Misinterpretation of the mathematical structure of a problem and the omission of part of the information
presented in a word problem would also be thought of as difficulties in students’ problem solving
(Polotskaia, Savard, and Freiman 2016), which needs to be studied in order to understand students’ PS
strategies, and to help them to overcome their mistakes.
4	Methods	
4.1	The	PD	workshop	
The PD workshop of ARPA is designed with nine monthly sessions, lasting three hours each, where teacher
activity is centered in practice and reflection. In a regular session during the PD workshop, teachers start
reflecting on the PS activity they implemented with their students, in which they discuss their
performance, and their own good and bad choices and omissions. Next, teachers solve a problem in a
collaborative way, modeling the classroom work with a monitor, and then, in a plenary discussion,
teachers ana- lyze strategies and solutions. The session ends by planning the coming PS activity they will
implement with their stu- dents, with the problem they have solved. Teachers plan their actions,
anticipating possible difficulties their students may have, and they prepare any necessary questions. A
simplified and extended version of the problem is prepared to give to groups with difficulties or to
groups who successfully reach the solution. During the workshop session, sessions with teachers are led
by an expert monitor, in order to stimulate discussion and reflection, to model problem-solving activi-
ties with students, to guide the teachers in planning and mak- ing decisions while conducting
collaborative PS, and to give feedback to teachers at all times.
Along with the workshop, teachers implement seven col- laborative PS activities or lessons, as proposed
in the work- shop. In these 45–90 min lessons, students are organized in random groups (each with 3 or
4 students), and they receive a non-routine problem. The students start working autono- mously,
discussing the problem with their peers in the group and together looking for a strategy that may solve
the prob- lem. However, each student is responsible for solving the problem and learning about the
strategy. They are allowed to ask the teacher if they do not understand the problem or if the process gets
stalled, however the teacher answers with guiding questions to stimulate their thinking. Once they have
solved the problem, the teacher asks for an explanation from all members of the group, and proposes
an extension if the explanation is satisfactory. If it is not, they have to continue working. Before the end
of the problem-solving lesson, a plenary discussion takes place, in which all students dis- cuss their
strategies and solutions, with the stimulus of the teacher.
During the PD workshop sessions, teachers learn through practice, modeling and discussing with peers
how they will conduct the PS lessons. Teachers are not to give students the solution or to propose a
strategy or heuristic to solve the problem. They guide the work of students using guiding questions.
Teachers will not interact with individual students when they are working on the problem, but always
direct their attention or questions to the group, and always encour- age collaboration among the
members. During plenary dis- cussion, the teacher chooses students to explain their solu- tions, and
he/she sequences their participation in advance to promote discussion among students (Stein et al.
2008). The teacher always remains in the background, encouraging discussion with emphasis on different
strategies for problem solving.
4.2	Context	of	the	study	and	participants
The focus of this study is the impact on student prob- lem solving skills of the PD workshop described
above. The intervention is part of a longitudinal research project designed to inquire into the possible
impact of the ARPA project on Chilean primary students’ problem-solving skills, behavior, and attitudes.
While the school year in Chile nor- mally starts in March and ends in December, the PD work- shop under
study started in September 2017 as a pre-inter- vention and introductory period of the program,
allowing teachers to learn about the principles of the program and start adopting the new classroom
practices. The workshop continued throughout the school year in 2018. In this study, data were collected
in October 2017 for the first time as the pre-test and the post-test was administered in October 2018,
which was two months before school examination period.
This study was designed as non-equivalent quasi-experi- mental research project in which an intact group
of students was chosen as the control group that was similar to the treat- ment group in as many ways as
possible. Even though there were fewer participants in the control group than those in the intervention
group, we still call it a quasi-experimental design, since the study is associated with the benefits of
classroom practice change offered by the PD project.
The participants in the experimental group were com- posed of students whose teachers participated in
the 9-month-long PD workshop held in Rengo county, situated in the O’Higgins Region, South of Santiago.
Among all teachers participating in the workshop, five were invited to participate in this study and
voluntarily accepted it. Two of the five teachers were teaching two classes at the same grade in parallel,
and agreed to do PS lessons in one of the classes and continue their traditional teaching method in the
other. We therefore called the students of these two classes without ARPA as the control group. The main
criteria for choosing the teachers’ sample was that they were teaching 5th grade
students and had the opportunity to follow up in teaching the same students the following school year.
This aspect allowed us a longer student follow up during the PD workshop.
In total, there were 100 students, 47 girls, and 53 boys, in these seven classes. Considering the preference
of their teachers, there was a control group of 45 students and an experimental group of 55 students.
We noted that students in both groups were comparable regarding their background in problem-solving
experiences before the workshop began. All teachers considered in the study came from public schools
located in Rengo. The performance of the O’Higgins region in the national test (SIMCE) was very close
to the national average, however, the performance of the schools in this study was below this average. In
fact, the average in the Mathematics Test for 6th
grade during the last six years in these schools is 232.6
points, while the average in the region is 248.4 points and the national average is 247.2 points.
4.3	Instruments	
Even though the PD workshop encourages collaborative PS in the classroom, our instruments are
designed for study- ing the individual performance of students. This decision is based on two
considerations. First, because we are com- paring two types of classroom practices, we should study a
common output of impact on students, that is individual PS performance. Second, national and
international tests mainly consider individual performance, so that governmental offic- ers, educational
authorities and even school leaders or teach- ers are interested in knowing if a particular PD workshop
is effective in improving mathematics learning, by looking at individual performance.
The instrument used in this study is composed of three problems. The problems, namely, the Cakes, the
Patterns, and the Race (presented hereafter) have two similar but not equal versions for each one, as
used in the pre- and post- tests. These problems were chosen as non-routine and con- tent-less problems
as they could be solved without neces- sarily knowing some specific mathematics content and the target
students (control and experimental groups) had not worked on this type of problem before. For both the
pre-test and post-test, the three problems were given to students in a sequence, one after the other,
allowing them to spend 15 min on each of the problems. This design has the purpose of put- ting students
in a new situation each time with the need to produce a solution, so the ability to formulate and think of
a strategy would be easily seen. It should be highlighted that based on the purpose of the study as we
explained earlier, both the pre-test and the post-test were done individually by the students, rather than
in their groups.
4.4	Scoring	and	coding	scheme	for	performance	and	strategies	
Student responses to each problem were coded based on their performance and the strategies they used
to solve each of the three problems.
Performance. Student written responses in each test and each problem were coded based on their effort
to formulate and solve the problem. A four-point scale was designed to capture the correctness of the
solution as well as the under- standing and formulation of the problem. Table 1 explains the scale.
Representation strategies. A general coding scheme was created with the possibility of being
individualized to
classify specific strategies students used in their intent to solve each problem. We followed prior work
on PS (Cai 2000; Cai and Hwang 2002) to capture the students’ rep- resentation strategies based on 5
codes, as in Table 2. This initial coding scheme was monitored with a list of more detailed strategies
thoroughly identified in the students’ work, depending on how they dealt with given and/or unknown
quantities in order to formulate their solutions.
4.5	Dataanalysis	
The analysis was carried out first quantitatively and then qualitatively, based on students’ written
solutions to the three non-routine problems. Firstly, the students’ perfor- mance in each problem was
coded with reference to the coding scheme previously presented. The first author and an expert
mathematics teacher participated in the coding. They began with several initial meetings to review and
reach an agreement on the coding scheme. They then checked their rate of agreement on a group of
random responses, on which they agreed in 89% of their code selections, indicating an adequate inter-
rater reliability. The students’ overall per- formance on the test was calculated as an average of their
performance on each problem for experimental and control groups. Inferential and descriptive statistics
methods were used to answer the first research question and to compare the mean differences between
the groups.
To answer the second research question, we focused on student performance on the post-test. In each
problem, we categorized students into two groups by considering their performance scores in that
problem. Students who achieved scores of 2 or 3 were categorized as successful problem solv- ers, and
those who scored 0 or 1 were categorized as failing students. We then studied the percentages of students
who used similar strategies among successful and failing prob- lem solvers. We also examined how this
percentages differed between control and experimental groups. Finally, we illus- trated the most often
used strategies by successful students.
5	Results	
5.1	Students’	overall	performance	in	PS	
At the beginning of the PD workshop, we conducted a pre- test to capture the preexistent difference in
mathematical problem-solving skills among participants in both groups. The students’ overall problem-
solving performance in the pre-test was calculated according to the mean of their per- formance in each
of the three problems. An independent- samples t-test was conducted to compare the overall perfor-
mance scores for students in the control and experimental groups. The results showed that there was no
significant difference between the control group and the experimental group in their problem-solving
performance at the begin- ning of the workshop. The mean (M) score of the control group was 1.76 with
a standard deviation (SD) of 0.92, and for the experimental group M was 1.76 with a SD of 1.07. This
result implies that the participants of both groups were approximately at the same level of PS
performance before the experiment. Thus, we have two homogenous groups of students according to
their problem-solving abilities.
At the end of the workshop, the overall performance of students according to their problem-solving
abilities was calculated using the mean of their performance in each of the three problems of the post-
test. We conducted a one way between groups analysis of covariance to compare the performance scores
of the control and experimental groups. The students’ mean scores on the pre-test were used as the
covariance in this analysis. Preliminary checks were con- ducted to ensure that there was no violation of
the assump- tions of normality, linearity, homogeneity of variances, and homogeneity of the regression
slopes. After adjusting for the pre-test scores, we found a significant difference between the control and
experimental group on post-test scores on overall PS performance; the F ratio of F(1, 96) = 10.30, p-
value < 0.05, indicated that the mean change score was significantly greater for the experimental group
(adjusted- M = 1.40, SD = 0.85) than for the control group (adjusted- M = 0.93, SD = 0.62). This is an
indicator of the effectiveness of the collaborative problem-solving practices promoted by the workshop
in contrast to the traditional learning approach. Mathematics teachers who participated in the workshop
and carried that knowledge into their instruction in the experi- mental classes, improved those students’
problem-solving skills and thinking.
To have an overall picture of the students’ performance, we present in Fig. 1 the performance of the
groups across the problems. We first observe that at least 70% of students were unable to formulate the
problems or they could formulate but without any success in solving them, in both groups, except for the
experimental group in the Race problem, where this percentage reached 50%. The students in the
experimental group showed higher success rates than students in the con- trol group across all three
problems and, on the other side, the failure rates of the control group were higher than the failure rates
of the experimental group across all problems. In the first problem, the Cakes, the differences were not
so drastic, while there was a noticeable difference in the per- centages of students that formulated with a
correct answer and those that left a blank answer or were unable to for- mulate. Looking at the results of
The Patterns, we observe that students in both groups were progressively less likely to solve correctly
from Part 1 to Part 2. The highest difference in performance of students was found in The Race where we
see that the percentages of students in the control group that
left a blank answer or were unable to formulate the problem correctly, increased two-fold over that of the
experimental group. At the same time, the percentage of students in the control group that formulated
this problem with a minor error was about one third of that of those in the experimen- tal group.
Moreover, in the experimental group there were some students that formulated with success, while none
of the control group did so. In general, as Fig. 1 shows, the unsuccessful students mostly were unable to
formulate the problems correctly.
5.2	Strategies	used	by	successful	problem	solvers	
To address the second research question, we focused on the solution strategies leading to the correct or
almost cor- rect (including a minor mistake) answers. We discuss the representation strategies used by
the successful and failing students and then present the work of some successful stu- dents in
formulating the problems, both in the control and the experimental groups.
5.2.1	Problem	1.	The	Cakes
In this problem, two sub-problems need to be solved or considered in order to get the information to
make sense of questions asked in parts A and B. Only 12% of students suc- ceeded in giving a solution
to the problem (right or almost right, that is 3 or 2 points), while 88% only obtained 1 or 0 points,
including 9 students who returned an empty answer, as we see in Table 3. Among the three problems,
this one was the most difficult for students participating in the study. The common strategy that students
used in trying to solve the problem was a combination of Arithmetic, Graphical, and Verbal strategies. A
combination of Graphical and Verbal was the most used with 25% and an Arithmetic and Verbal with
10%, while the rest (8%) used other combina- tions. Table 3 shows that the rate of success increases
when students applied the combined strategies. We observe that among those students that used only a
Verbal representa- tion strategy (37) only one succeeded in the solution, while no students succeeded
using only a Graphic or Arithme- tic representation strategy (See Table 3). The Graphic and Arithmetic
representation strategies were essentially equally distributed among the control and experimental
groups. However, the Verbal representation strategy was most used by the control group and the
Combined strategy was most used by the experimental group.
Next, we discuss three examples of the strategies, which can explain and illustrate the different
approaches used by the participants. Our first student used a Verbal representa- tion strategy combined
with an Arithmetic one, even though it appears as if only as a Verbal one was used. Starting with boys,
Ana2
divided each cake into three pieces, obtaining 18 pieces, so that two pieces can be given to each of
the nine students. Then, Ana performed a similar task with cakes for the girls and realized that each girl
received two pieces and there was one piece left (Fig. 2). The answer for part A is not correct, but the
overall conclusion is correct. This kind of combined strategy represents a meaning-making strategy
in which the student has found his/her solution based on the meaning of division and Arithmetic
operations.
In another example, Arturo (Fig. 3) used a purely Arith- metic representation strategy, just dividing the
number of cakes by the number of boys or girls, using the long divi- sion algorithm. He then wrote the
answer to each ques- tion accordingly, but added a verbal explanation that was somehow confusing. This
example is presenting a direct
translation of the problem made by the students to get the answer by simply using an algebraic
operation. However, it seems because of his lack of experience with this type of problem, he could not
compare the proportions found by the divisions. The explanation made by Arturo can reveal that
perhaps the student did not get the meaning of the division and we can call it a simple direct translation
of the numbers and the keyword -sharing- presented in the problem.
Antonia (Fig. 4) used a purely Verbal representation strat- egy to solve the problem. She presented a
solution to part A answering that both boys can receive the same amount of cake (two thirds) and each
girl can receive the same amount of cakes (one and one fourth). Then, in answering part B, she said that
girls would receive more than the boys, but without explanation. This strategy led to a partial solution to
the problem, including a misinterpretation. The differ- ence between this type of strategy and the one
used by Ana arose when the student tried to explain the sense-making question in part B using the
information presented in part A. Antonia did not seek to use the information presented in part A. It is
likely that the explanations in part A appear to have been interpreted just to explain her understanding
of sharing the equal amount of cake among girls and boys separately without considering the
relationship between parts A and B (Fig. 5).
To solve this problem, we expected that students would find the pattern of the given examples, and apply
pattern to answer the questions in parts A and B. Moreover, we expected to see more use of arithmetic
strategies than graphic ones, especially to answer part B. However, the stu- dents’ work showed a clear
preference for using the Graphic representation strategies to solve this problem as shown in Table 4. In
fact, the majority of students reproduced their graphical models by following the given pattern, and
explained their accurate or inaccurate images by an intuitive justification, or sometimes by arithmetic
operations, rather than finding the overall pattern. Arithmetic representation strategies were used less
frequently compared to the Graphic one. Students in the experimental group were much more
5.2.2	Problem	2.	The	Patterns	
The following drawing shows pictures of squares made by match sticks, where each square is constructed by
four sticks forming its sides.
If the construction of squares is continued in the form shown in the pictures:
A. How many match sticks are needed to construct 25 squares? Explain your work. B. How many squares can
be constructed with 63 match sticks? Explain your work.
likely to use the Graphic to answer the problem, while stu- dents in the control group did not show any
preferences in the use of Arithmetic vs Graphic (Table 5).
The Verbal representation strategies were the third most frequent among students in both groups and a
few students used combined strategies. About a third of students using the Graphic or Arithmetic
representation strategy moved mostly to No written explanation, but some moved to the Verbal
representation strategy. In part A, 22% of students succeeded in solving the problem, while 16%
succeeded in solving part B. Most of succeeding students used a Graphic representation strategy.
In what follows, we present some students’ work to illus- trate their different representation strategies in
solving the problem. The following figure depicts the work of Beatriz, which combines a Graphic and
Verbal representation strat- egy. In part A, she made a picture of the 25 squares and the counted the
match sticks, failing in the counting. In part B, she simply counted the match sticks from the drawing
from Part A and then argued verbally. In fact, Beatriz was able to see the relationship between the two
parts of the question, and based on the structure of the pattern drawn in part one, she found it easier to
state the argument verbally in part B.
In the next two examples, the students could recognize the pattern, but were not able to express it
algebraically. The arithmetic relations are mainly used to construct and make sense of what he/she did
with the graphical model.
Benjamı́n used a Graphic representation strategy by draw- ing all the squares involved in the question
(Fig. 6). In Part A, Benjamı́n made some calculations as a way to check the results obtained by counting
the match sticks in the picture. In Part B, Benjamı́n relied completely on counting the match sticks in
the picture, clearly showing that there were two left, after counting 20 squares.
We then present the work of Belén (Fig. 7), which was based on a Verbal representation strategy; however,
the argu- mentation references a possible drawing out of the assigned paper. Belén also made a reference
to an arithmetic opera- tion for checking the result in Part A.
Students commonly made a mistake when they did not recognize the pattern. A common mistake in
doing this problem was related to their not recognizing the pattern. In most cases, students directly used
Algebraic or Arithmetic representations. This type of representation perhaps prevents students from
being able to see the structure presented in the problem.
Figure 8 presents an example of work by Basilio, that uses an Arithmetic representation strategy by
simply multiplying and dividing by 3, and thus failing to realize that for the first square there are four
match sticks needed. A drawing may have allowed Basilio to realize the mistake.
as half of them omitted the information about horse B, and solved the problem for the other 4 horses.
Another half of the students had a problem loading the location of horse B, which we explain later. Among
students with a success- ful answer, the work of Carmen and Carlos (Fig. 9) used essentially the same
strategy, with a missing and incomplete explanation.
Another group of students who could formulate the prob- lem and get close to the answer, omitted part
of the informa- tion presented by the problem scenario and solved the prob- lem. This strategy is
associated with the difficulty of locating horse B, especially for those students with this solution strat-
egy: half of them omitted the information about horse B, and solved the problem for the other 4 horses
(Fig. 9). The difficulty with this problem seems to be that after locating horses F, C, and P, horse B has to
be located in reference to
5.2.3	Problem	3.	The	Race	
In a horse race, horses are represented by the first letter of their names. Can you find the order at the end of
the race, following the hints given next? (Explain your answer.)
• F arrived 7 seconds before C.
• P arrived 6 seconds after B.
• D arrived 8 seconds after B.
• C arrived 2 seconds before P.
To solve this problem, almost all of the students tried to explain their answers verbally. About 3 of them
tried to solve this problem by drawing and verbal explanation. However, in this problem, we could
categorize the strategies that they used based on the way that they could capture and proceed with the
information presented in the problem. Student performance in this problem indicated that about 80%
of those in the control group were not able to understand and/ or formulate the problem. This proportion
was about 40% for students in the experiment group. Moreover, of those who attempted to solve the
problem, only 4 students were able to solve the problem completely, and they were from the experiment
group.
The group of students who could formulate the problem and get close to the answer (15% in the control
group and 40% in the experimental) omitted a part of the information presented by the problem
scenario and solved the problem. This strategy can be considered as a method of simplifica- tion,
especially for those students with this solution strategy, horse P and only then, horse D is located in
reference to B, and the information already gathered.
In Fig. 10 we see the work of Cecilia, which built up an answer with four horses, locating correctly horses
F and C and the relative position of P and D. It is unclear how she decided to put horse P after C. In Fig.
11, we see a similar situation, but here Claudio located horse B between horses C and P, but without a
clear reason.
Finally, in Fig. 12, we see the work of Celia and Cristian, with a similar mistake, only failing in locating
horse B.
6	Discussion	and	conclusions	
PD programs constitute an important instrument for edu- cational change at the national or local level.
There is a huge variety of such programs, with a wide range of char- acteristics, involving a high number
of teachers world- wide, and important economic resources are spent in their
implementation. In this paper, we provide a piece of evi- dence regarding the effectiveness of a teacher
PD workshop on the development of problem-solving abilities in students. While the workshop is
designed for mathematics teachers and all of its activities are oriented and performed with teachers, the
purpose of the workshop is to improve stu- dents’ outcomes. Thus, the purpose of this study is to obtain
evidence of this change, as suggested by Borko (2004) and Desimone (2009).
We conducted a quasi experimental study to compare the problem-solving performance of 6th
grade
students whose mathematics teachers followed the PD workshop, with stu- dents from the same grade,
whose teachers continued their traditional teaching method. The results of the pre-test sup- ported that
the two groups of students were homogeneous in their overall problem-solving performance, while the
result of the post-test showed a statistically significant difference in performance in favor of the
experimental group. Natu- rally, these results are explained in part because there were
more students in the experimental group who succeeded in solving the problems and fewer students that
failed, as can be seen in Fig. 1. However, we would like to call atten- tion to the high number of students
with a blank answer or those not able to formulate the problem in both groups, and to the fact that the
number of those students decreased in the experimental group, as seen in Fig. 1. The performance
change may be explained precisely because students in the experimental group worked non-routine
problems in a col- laborative way during the year. But certainly, collaborative PS requires a different
form of interaction between teacher and students, allowing students more autonomy with their own
formulations and strategies, which are shared within the groups and with the whole class at the end. The
students’ PS-lessons were distributed approximately monthly along the project period, so that from the
very beginning of the workshop, teachers began introducing the new classroom practices in their
classrooms. The autonomy promoted by teachers allowed students to find ways to represent their
problem strategies, and consequently to generate more pro- ficient and meaning-making problem-
solving approaches.
These results are consistent with our discussion in the section on Research on Collaborative Learning and
PS, where, based on the literature, we argued that the effective- ness of collaborative PS depends on
several factors such as classroom organization, group composition and selection, the characteristics of
the problems, the characteristics of the context in which group members engage in finding a solution
(Nistal et al. 2009), and individual learners benefiting from collaboration (Dahl et al. 2018; Paas and
Sweller 2012). In all these factors, the role of teachers is crucial. For example, in the experimental group,
teachers learn how to design an effective small group environment in which they encourage their
students to work collaboratively, reflect on the repre- sentations suggested by peers in the group.
Moreover, this environment offers opportunities that enable students to cri- tique and discuss each
other’s representations, while seeking alternative possible representations. We conclude that the higher
problem-solving performance shown by students in the experimental group can be attributed to the
classroom practices learned and implemented by teachers participating in the workshop. At this point,
it is also interesting to recall
Suydam (1980, as cited in Schoenfeld 1982), who stated that “research evidence strongly concurs that
problem-solving performance is strongly enhanced by teaching students to use a wide variety of
strategies or heuristics, both general and specific” (p. 31). This statement is somehow questioned by the
result in this study, where students improved perfor- mance, and no specific strategies or heuristics were
taught to them. At this level at least, improvement comes because of exposure to non-routine problems,
collaborative work, and teacher guidance directed to enabling students to gain autonomy and rely on
their own ideas and strategies to solve the problems.
Regarding the second research question, we first observe the low number of 20 successful students in
solving at least one problem. The short time given to students to solve these problems could be a reason
for the low performance exhib- ited by both groups, and also the overall low performance of these
students in national tests when compared to other students at the regional and the national level, as
mentioned at the end of Sect. 4.2.
Over the successful cases, we observe a wide variety of representation strategies regardless of whether
or not the students were in the control or experimental groups. Thus, within the framework of this sample
of students, this shows that the participation of their teachers in the PD workshop did not make a
difference by widening the number of differ- ent strategies. This is consistent with the fact that teachers
following the workshop did not teach or promote differ- ent heuristics or strategies, but that students
devised those among themselves. Behind the difficulty for students in solv- ing these problems is their
ability to formulate the prob- lem or a way to find a strategy to solve them, or at least to advance towards
the solution. The results showed that more students in the experimental group than in the control group
did start with a representation of the problem. At this point, we quote Alibali et al. (2009): “One reason
that children may use incorrect or inefficient strategies to solve problems is that they fail to accurately
represent key features of the problems” (p. 90).
The analysis of the written productions of successful students showed that they were able to make sense
of their solutions. They showed a higher level of metacognition by controlling or justifying their solutions
or seeing the rela- tionships between the given and required in each problem. A low number of successful
students showed a tendency to use algebraic representations to solve the first two problems— not
consistent with the suggestion of Cai (2002), who stated that the level of knowing and being familiar with
algebra does not impact a student’s mathematical reasoning, nor their tendency to choose an arithmetic
strategy to solve a problem.
Among the 12 successful students in the Cake problem, 11 of them used a combined strategy, either
Graphical and Verbal or Arithmetic and Verbal. Their tendency to choose the representation strategy to
solve a problem might be related to several factors such as experiences, classroom practices, and the
schools’ textbooks rather than their domain specific knowledge.
In the Pattern problem the most common strategy used by successful students was the graphic one for
both part A and part B. Among the three problems, this one was the most challenging for all students.
Most of them could not find the solution, and even after graphically drawing the rec- tangles and
repetition, the majority of them failed to follow the pattern. The students’ challenges with the
generalization and understanding of patterns are reported in other stud- ies (Inmre and Akkoç 2012;
Zazkis and Liljedahl 2002). It was clear in the students’ work presented here that when the number of
sticks increased, most students kept to the verbal explanations, not consistent with the results of Zazkis
and Liljedahl (2002), who pointed out that there is a gap between being able to express a pattern verbally
and expressing it algebraically.
Regarding the Race problem, we categorized strategies of successful students with respect to the ability
to extract information about the number of horses. Among them, 20 students located and ordered the
horses correctly, while 13 of them missed one horse, but located the other four cor- rectly. This problem
involved the largest number of success- ful students among the three problems, however, it involved a
very large number of students that were not able even to formulate the problem.
This study has various limitations that we would like to mention here. First, the small number of students
and teach- ers in the sample does not allow us to reach more complete conclusions regarding the
effectiveness of the PD workshop in improving student performance in PS. The second limita- tion is that
the study used only one dimension to compare the control and experimental groups, leaving out various
other interesting variables to consider, such as the ability for group collaboration and communication.
We expected the workshop to have a favorable impact on these variables. Third, the effect was measured
during or immediately after finishing the workshop, and no information was gathered over a longer
period after the workshop.
Finally, we continue to advocate the important role of the PD program in changing classroom practices,
with the goal of improving the students’ problem-solving skills, including learning to elaborate and
criticize their representations for solving a problem. Perhaps, this process of learning takes more time
than just one school year, so they can gradually learn appropriate representations among all possible
ones by switching and going back and forth among all those strate- gies suggested by peers.
We end this paper with a call for more research in dif- ferent directions in the area of PD programs. In
particular, much more research is needed on the empirical effective- ness of programs measured by
students’ outcomes, rather than teacher learning or change of classroom practices. The students’
performance is an indirect variable that matters in program effectiveness.
Acknowledgements	 The authors would like to thank the anonymous referees for their useful comments and
suggestions, which improved the paper considerably. Funding from PIA-CONICYT Basal Funds for Centers of
Excellence Project FB0003 and Grant PAI AFB-170001 is gratefully acknowledged. FS is also grateful for the support
of CONI- CYT/Fondecyt Postdoctoral Project 3170673.
References	
Alibali, M. W., Phillips, K. M., & Fischer, A. D. (2009). Learning new problem-solving strategies leads to changes in
problem represen- tation. Cognitive Development, 24(2), 89–101.
Blumenfeld, P. C., Marx, R. W., Soloway, E., & Krajcik, J. (1996). Learning with peers: From small group cooperation
to collabora- tive communities. Educational Researcher, 25(8), 37–39.
Borko, H. (2004). Professional development and teacher learning: Map- ping the terrain. Educational Researcher,
33(8), 3–15.
Borko, H., Jacobs, J., & Koellner, K. (2010). Contemporary approaches to teacher professional development. In P.
Peterson, E. Baker, & B. McGaw (Eds.), International encyclopedia of education (Vol. 7, pp. 548–556). Oxford: Elsevier.
Cai, J. (2000). Understanding and representing the arithmetic averag- ing algorithm: An analysis and comparison of
US and Chinese students’ responses. International Journal of Mathematical Edu- cation in Science and Technology,
31(6), 839–855.
Cai, J. (2002). Assessing and understanding US and Chinese students’ mathematical thinking. ZentralblattfürDidaktik
der Mathematik, 34(6), 278–290.
Cai, J., & Cifarelli, V. (2005). Exploring mathematical exploration: How two college students formulated and solved
their own math- ematical problems. Focus on Learning Problems in Mathematics, 27(3), 43.
Cai, J., & Hwang, S. (2002). Generalized and generative thinking in US and Chinese students’ mathematical problem
solving and problem posing. The Journal of Mathematical Behavior, 21(4), 401–421.
Chandia, E., Rojas, D., Rojas, F., & Howard, S. (2016). Creencias de formadores de profesores de
matemáticasobreresolución de problemas (Mathematics teacher educators’ beliefs on problem solving). Bolema,
30(55), 605–624.
Dahl, H. (2019). “He’s so fast at drawing”—Children’s use of draw- ings as a tool to solve word problems in
multiplication and divi- sion. In Eleventh Congress of the European Society for Research in Mathematics Education (Vol.
3, pp. 4475–4482. Freudenthal Group, Freudenthal Institute: ERME.
Dahl, H., Klemp, T., & Nilssen, V. (2018). Collaborative talk in math- ematics–contrasting examples from third
graders. Education 3–13, 46(5), 599–611.
Darling-Hammond, L., Hyler, M. E., & Gardner, M. (2017). Effec- tive teacher professional development. Palo Alto, CA:
Learning Policy Institute.
Desimone, L. M. (2009). Improving impact studies of teachers’ profes- sional development: Toward better
conceptualizations and meas- ures. Educational Researcher, 38(3), 181–199.
Desimone, L. M., Porter, A. C., Garet, M. S., Yoon, K. S., & Birman, B. F. (2002). Effects of a professional development
on teachers’ instruction: Results from a three-year longitudinal study. Educa-
tional Evaluation and Policy Analysis, 24(2), 81–112.
Duijzer, C., den Heuvel-Panhuizen, V., Veldhuis, M., & Doorman, M. (2019). Moving towards understanding graphical
representa- tions of motion. In Eleventh Congress of the European Society for Research in Mathematics Education (Vol.
3, pp. 4491–4497).
Freudenthal Group, Freudenthal Institute: ERME.
Elia, I., den Heuvel-Panhuizen, M., & Kolovou, A. (2009). Explor- ing strategy use and strategy flexibility in non-
routine problem solving by primary school high achievers in mathematics. ZDM,
41(5), 605.
Fawcett, L., & Garton, A. (2005). The effect of peer collaboration on
children’s problem-solving ability. British Journal of Educational
Psychology, 75(2), 157–169.
Felmer, P., & Perdomo-Dı́az, J. (2016). Novice Chilean second-
ary mathematics teachers as problem solvers. In P. Felmer, E. Pehkonen, & J. Kilpatrick (Eds.), Posing and solving
mathemati- cal problems, Research in Mathematics Education Series (pp. 287–308). Cham: Springer.
Felmer, P., Perdomo-Dı́az, J., & Reyes, C. (2019). The ARPA experi- ence in Chile: Problem solving for teachers’
professional develop- ment. In Liljedahl, P., and Santos-Trigo, M. (Eds.) Mathematical problem solving. ICME-13
Monographs (pp. 311–337). Springer, Cham.
Francisco, J. M. (2013). Learning in collaborative settings: Students building on each other’s ideas to promote their
mathemati- cal understanding. Educational Studies in Mathematics, 82(3), 417–438.
Gick, M. L. (1986). Problem-solving strategies. Educational Psycholo- gist, 21(1–2), 99–120.
Heinze, A., Star, J., & Verschaffel, L. (2009). Flexible and adaptive use of strategies and representations in
mathematics education. ZDM, 41, 535–540.
Inmre, S., & Akkoç, H. (2012). Investigating the development of pro- spective mathematics teachers’ pedagogical
content knowledge of generalising number patterns through school practicum. Journal of Mathematics Teacher
Education, 15(3), 207–226.
Jacob, R., Hill, H., & Corey, D. (2017). The impact of a professional development program on teachers’ mathematical
knowledge for teaching, instruction, and student achievement. Journal of Research on Educational Effectiveness, 10(2),
379–407.
Liljedahl, P. (2014). The affordances of using visually random groups in a mathematics classroom. In Y. Li, E. Silver,
& S. Li (Eds.), Transforming mathematics instruction: Multiple approaches and practices (pp. 127–144). New York, NY:
Springer.
MINEDUC [Ministry of Education Republic of Chile] (2012). Bases Curriculares Matemática; Ficha Bases Curriculares
2012. http:// www.curriculumenlineamineduc.cl/605/w3-article-21321.html.
National Agency of Quality of Education [Agencia de Calidad de la Educación] (2018). SIMCE.
https://www.agenciaeducacion.cl/ evaluaciones/que-es-el-simce.
National Research Council. (2011). Successful K-12 STEM education: Identifying effective approaches in science,
technology, engineer- ing, and mathematics. National Academies Press.
Nistal, A., Van Dooren, W., Clarebout, G., Elen, J., & Verschaffel, L. (2009). Conceptualising, investigating and
stimulating represen- tational flexibility in mathematical problem solving and learning: a critical review. ZDM, 41(5),
627–636.
OECD (2016). Low-performing students: Why they fall behind and how to help them succeed. PISA, OECD Publishing,
Paris. doi: https://doi.org/10.1787/9789264250246-en.
OECD. (2017). PISA 2015 Results (Volume V): Collaborative problem solving. PISA: OECD Publishing, Paris.
Paas, F., & Sweller, J. (2012). An evolutionary upgrade of cognitive load theory: Using the human motor system and
collaboration to support the learning of complex cognitive tasks. Educational Psychology Review, 24(1), 27–45.
https://doi.org/10.1007/s1064 8-011-9179-2.
Pijls, M., Dekker, R., & Van Hout-Wolters, B. (2007). Reconstruction of a collaborative mathematical learning process.
Educational Studies in mathematics, 65(3), 309–329.
Polotskaia, E., Savard, A., & Freiman, V. (2016). Investigating a case of hidden misinterpretations of an additive word
problem: struc- tural substitution. European Journal of Psychology of Education, 31(2), 135–153.
Polya, G. (1957). How to solve it. Princeton, NJ: Princeton University Press.
Radovic, D., & Preiss, D. (2010). Discourse patterns observed in mid- dle-school level mathematics classes in Chile.
Psykhe, 19, 65–79. Reynolds, D., & Muijs, D. (1999). The effective teaching of math- ematics: a review of research.
School Leadership & Management,
19(3), 273–288.
Saadati, F., & Reyes, C. (2019). Collaborative learning to improve
problem-solving skills: A relation affecting through attitude toward mathematics. In Felmer, P., Liljedahl, P., and
Koichu, B. (Eds.) Problem Solving in Mathematics Instruction and Teacher Professional Development. Research in
Mathematics Education Series (pp. 187–202). Springer, Cham.
Schoenfeld, A. H. (1982). Measures of problem-solving performance and of problem-solving instruction. Journal for
Research in Math- ematics Education, 31–49.
Sofroniou, A., & Poutos, K. (2016). Investigating the effectiveness of group work in mathematics. Education Sciences,
6(3), 30.
SoucyMcCrone, S. (2005). The development of mathematical discus- sions: an investigation in a fifth-grade
classroom. Mathematical Thinking and Learning, 7(2), 111–133.
Stein, M., Engle, R., Smith, M., & Hughes, E. (2008). Orchestrating productive mathematical discussions: Five
practices for helping teachers move beyond show and tell. Mathematical Thinking and Learning, 10(4), 313–340.
Suydam, M. (1980). Untangling clues from research on problem solv- ing. Problem solving in school mathematics, 34–
50.
Swan, M. (2006). Collaborative learning in mathematics: a challenge to our beliefs and practices. Leicester: National
Institute of Adult Continuing Education.
Tambunan, H. (2019). The effectiveness of the problem-solving strat- egy and the scientific approach to students’
mathematical capabili- ties in high order thinking skills. International Electronic Journal of Mathematics Education,
14(2), 293–302.
TNTP. (2015). The mirage: Confronting the hard truth about our quest for teacher development. Brooklyn, NY: TNTP.
Zazkis, R., & Liljedahl, P. (2002). Generalization of patterns: The ten- sion between algebraic thinking and algebraic
notation. Educa- tional Studies in Mathematics, 49(3), 379–402.
Publisher’s	Note	Springer Nature remains neutral with regard to jurisdictional claims in published maps and
institutional affiliations.

More Related Content

Similar to Assessing impact of a Teacher professional development program on student problem‐solving performance. Farzaneh, Felmer..pdf

Effectiveness of classroom practices to achievement in mathematics
Effectiveness of classroom practices to achievement in mathematicsEffectiveness of classroom practices to achievement in mathematics
Effectiveness of classroom practices to achievement in mathematicsAlexander Decker
 
Course evaluation summary report
Course evaluation summary reportCourse evaluation summary report
Course evaluation summary reportScottish TNE
 
A brainstorming flipped classroom approach for improving
A brainstorming flipped classroom approach for improvingA brainstorming flipped classroom approach for improving
A brainstorming flipped classroom approach for improvingAbi Uwais
 
EFFECTIVENESS OF COOPERATIVE LEARNING IN SECONDARY SOCIAL STUDIES OF DEPARTME...
EFFECTIVENESS OF COOPERATIVE LEARNING IN SECONDARY SOCIAL STUDIES OF DEPARTME...EFFECTIVENESS OF COOPERATIVE LEARNING IN SECONDARY SOCIAL STUDIES OF DEPARTME...
EFFECTIVENESS OF COOPERATIVE LEARNING IN SECONDARY SOCIAL STUDIES OF DEPARTME...AJHSSR Journal
 
21st Century Pedagogy: Transformational Approach
21st Century Pedagogy: Transformational Approach21st Century Pedagogy: Transformational Approach
21st Century Pedagogy: Transformational Approachijtsrd
 
Using Action Research to Identify Data During Clinical Experience (main)
Using Action Research to Identify Data During Clinical Experience (main)Using Action Research to Identify Data During Clinical Experience (main)
Using Action Research to Identify Data During Clinical Experience (main)Antwuan Stinson
 
Application of addie model of instruction in teaching learning transaction am...
Application of addie model of instruction in teaching learning transaction am...Application of addie model of instruction in teaching learning transaction am...
Application of addie model of instruction in teaching learning transaction am...Alexander Decker
 
journalism research
journalism researchjournalism research
journalism researchrikaseorika
 
Case for-hands-on-learning
Case for-hands-on-learningCase for-hands-on-learning
Case for-hands-on-learningBalan Muthu
 
The Comparative Study Between The Cooperative Learning Model Of Numbered Head...
The Comparative Study Between The Cooperative Learning Model Of Numbered Head...The Comparative Study Between The Cooperative Learning Model Of Numbered Head...
The Comparative Study Between The Cooperative Learning Model Of Numbered Head...iosrjce
 
16Action Research Study ReportInsert Your Na
16Action Research Study ReportInsert Your Na16Action Research Study ReportInsert Your Na
16Action Research Study ReportInsert Your NaEttaBenton28
 
16Action Research Study ReportInsert Your Na
16Action Research Study ReportInsert Your Na16Action Research Study ReportInsert Your Na
16Action Research Study ReportInsert Your NaKiyokoSlagleis
 
16 action research study reportinsert your na
16 action research study reportinsert your na16 action research study reportinsert your na
16 action research study reportinsert your naabhi353063
 
The Primary Exit Profile: What does this mean for STEM in Jamaican Primary Sc...
The Primary Exit Profile: What does this mean for STEM in Jamaican Primary Sc...The Primary Exit Profile: What does this mean for STEM in Jamaican Primary Sc...
The Primary Exit Profile: What does this mean for STEM in Jamaican Primary Sc...Lorain Senior
 
Teaching Math To Sld Ld Guide
Teaching Math To Sld Ld GuideTeaching Math To Sld Ld Guide
Teaching Math To Sld Ld Guidedmloch
 
The convergence of mayer’s model and constructivist model towards problem sol...
The convergence of mayer’s model and constructivist model towards problem sol...The convergence of mayer’s model and constructivist model towards problem sol...
The convergence of mayer’s model and constructivist model towards problem sol...Alexander Decker
 
Running Header PROJECT BASED LEARNING PROJECT BASED LEARNING .docx
Running Header PROJECT BASED LEARNING PROJECT BASED LEARNING   .docxRunning Header PROJECT BASED LEARNING PROJECT BASED LEARNING   .docx
Running Header PROJECT BASED LEARNING PROJECT BASED LEARNING .docxagnesdcarey33086
 
WORD-MATHICS-TELLING.docx
WORD-MATHICS-TELLING.docxWORD-MATHICS-TELLING.docx
WORD-MATHICS-TELLING.docxBadzVillasis
 
Lilia Muller, Romero, Baudis - Practica III- Assignment 1
Lilia Muller, Romero, Baudis - Practica III- Assignment 1Lilia Muller, Romero, Baudis - Practica III- Assignment 1
Lilia Muller, Romero, Baudis - Practica III- Assignment 1LiliaMuller
 
An Experimental Study of Collaborative Instructional Strategy (CIS) for Teac...
An Experimental Study of Collaborative Instructional Strategy (CIS) for  Teac...An Experimental Study of Collaborative Instructional Strategy (CIS) for  Teac...
An Experimental Study of Collaborative Instructional Strategy (CIS) for Teac...Dr.Nasir Ahmad
 

Similar to Assessing impact of a Teacher professional development program on student problem‐solving performance. Farzaneh, Felmer..pdf (20)

Effectiveness of classroom practices to achievement in mathematics
Effectiveness of classroom practices to achievement in mathematicsEffectiveness of classroom practices to achievement in mathematics
Effectiveness of classroom practices to achievement in mathematics
 
Course evaluation summary report
Course evaluation summary reportCourse evaluation summary report
Course evaluation summary report
 
A brainstorming flipped classroom approach for improving
A brainstorming flipped classroom approach for improvingA brainstorming flipped classroom approach for improving
A brainstorming flipped classroom approach for improving
 
EFFECTIVENESS OF COOPERATIVE LEARNING IN SECONDARY SOCIAL STUDIES OF DEPARTME...
EFFECTIVENESS OF COOPERATIVE LEARNING IN SECONDARY SOCIAL STUDIES OF DEPARTME...EFFECTIVENESS OF COOPERATIVE LEARNING IN SECONDARY SOCIAL STUDIES OF DEPARTME...
EFFECTIVENESS OF COOPERATIVE LEARNING IN SECONDARY SOCIAL STUDIES OF DEPARTME...
 
21st Century Pedagogy: Transformational Approach
21st Century Pedagogy: Transformational Approach21st Century Pedagogy: Transformational Approach
21st Century Pedagogy: Transformational Approach
 
Using Action Research to Identify Data During Clinical Experience (main)
Using Action Research to Identify Data During Clinical Experience (main)Using Action Research to Identify Data During Clinical Experience (main)
Using Action Research to Identify Data During Clinical Experience (main)
 
Application of addie model of instruction in teaching learning transaction am...
Application of addie model of instruction in teaching learning transaction am...Application of addie model of instruction in teaching learning transaction am...
Application of addie model of instruction in teaching learning transaction am...
 
journalism research
journalism researchjournalism research
journalism research
 
Case for-hands-on-learning
Case for-hands-on-learningCase for-hands-on-learning
Case for-hands-on-learning
 
The Comparative Study Between The Cooperative Learning Model Of Numbered Head...
The Comparative Study Between The Cooperative Learning Model Of Numbered Head...The Comparative Study Between The Cooperative Learning Model Of Numbered Head...
The Comparative Study Between The Cooperative Learning Model Of Numbered Head...
 
16Action Research Study ReportInsert Your Na
16Action Research Study ReportInsert Your Na16Action Research Study ReportInsert Your Na
16Action Research Study ReportInsert Your Na
 
16Action Research Study ReportInsert Your Na
16Action Research Study ReportInsert Your Na16Action Research Study ReportInsert Your Na
16Action Research Study ReportInsert Your Na
 
16 action research study reportinsert your na
16 action research study reportinsert your na16 action research study reportinsert your na
16 action research study reportinsert your na
 
The Primary Exit Profile: What does this mean for STEM in Jamaican Primary Sc...
The Primary Exit Profile: What does this mean for STEM in Jamaican Primary Sc...The Primary Exit Profile: What does this mean for STEM in Jamaican Primary Sc...
The Primary Exit Profile: What does this mean for STEM in Jamaican Primary Sc...
 
Teaching Math To Sld Ld Guide
Teaching Math To Sld Ld GuideTeaching Math To Sld Ld Guide
Teaching Math To Sld Ld Guide
 
The convergence of mayer’s model and constructivist model towards problem sol...
The convergence of mayer’s model and constructivist model towards problem sol...The convergence of mayer’s model and constructivist model towards problem sol...
The convergence of mayer’s model and constructivist model towards problem sol...
 
Running Header PROJECT BASED LEARNING PROJECT BASED LEARNING .docx
Running Header PROJECT BASED LEARNING PROJECT BASED LEARNING   .docxRunning Header PROJECT BASED LEARNING PROJECT BASED LEARNING   .docx
Running Header PROJECT BASED LEARNING PROJECT BASED LEARNING .docx
 
WORD-MATHICS-TELLING.docx
WORD-MATHICS-TELLING.docxWORD-MATHICS-TELLING.docx
WORD-MATHICS-TELLING.docx
 
Lilia Muller, Romero, Baudis - Practica III- Assignment 1
Lilia Muller, Romero, Baudis - Practica III- Assignment 1Lilia Muller, Romero, Baudis - Practica III- Assignment 1
Lilia Muller, Romero, Baudis - Practica III- Assignment 1
 
An Experimental Study of Collaborative Instructional Strategy (CIS) for Teac...
An Experimental Study of Collaborative Instructional Strategy (CIS) for  Teac...An Experimental Study of Collaborative Instructional Strategy (CIS) for  Teac...
An Experimental Study of Collaborative Instructional Strategy (CIS) for Teac...
 

Recently uploaded

Industrial Policy - 1948, 1956, 1973, 1977, 1980, 1991
Industrial Policy - 1948, 1956, 1973, 1977, 1980, 1991Industrial Policy - 1948, 1956, 1973, 1977, 1980, 1991
Industrial Policy - 1948, 1956, 1973, 1977, 1980, 1991RKavithamani
 
Web & Social Media Analytics Previous Year Question Paper.pdf
Web & Social Media Analytics Previous Year Question Paper.pdfWeb & Social Media Analytics Previous Year Question Paper.pdf
Web & Social Media Analytics Previous Year Question Paper.pdfJayanti Pande
 
Advanced Views - Calendar View in Odoo 17
Advanced Views - Calendar View in Odoo 17Advanced Views - Calendar View in Odoo 17
Advanced Views - Calendar View in Odoo 17Celine George
 
Activity 01 - Artificial Culture (1).pdf
Activity 01 - Artificial Culture (1).pdfActivity 01 - Artificial Culture (1).pdf
Activity 01 - Artificial Culture (1).pdfciinovamais
 
Introduction to AI in Higher Education_draft.pptx
Introduction to AI in Higher Education_draft.pptxIntroduction to AI in Higher Education_draft.pptx
Introduction to AI in Higher Education_draft.pptxpboyjonauth
 
Organic Name Reactions for the students and aspirants of Chemistry12th.pptx
Organic Name Reactions  for the students and aspirants of Chemistry12th.pptxOrganic Name Reactions  for the students and aspirants of Chemistry12th.pptx
Organic Name Reactions for the students and aspirants of Chemistry12th.pptxVS Mahajan Coaching Centre
 
Beyond the EU: DORA and NIS 2 Directive's Global Impact
Beyond the EU: DORA and NIS 2 Directive's Global ImpactBeyond the EU: DORA and NIS 2 Directive's Global Impact
Beyond the EU: DORA and NIS 2 Directive's Global ImpactPECB
 
Contemporary philippine arts from the regions_PPT_Module_12 [Autosaved] (1).pptx
Contemporary philippine arts from the regions_PPT_Module_12 [Autosaved] (1).pptxContemporary philippine arts from the regions_PPT_Module_12 [Autosaved] (1).pptx
Contemporary philippine arts from the regions_PPT_Module_12 [Autosaved] (1).pptxRoyAbrique
 
Student login on Anyboli platform.helpin
Student login on Anyboli platform.helpinStudent login on Anyboli platform.helpin
Student login on Anyboli platform.helpinRaunakKeshri1
 
Z Score,T Score, Percential Rank and Box Plot Graph
Z Score,T Score, Percential Rank and Box Plot GraphZ Score,T Score, Percential Rank and Box Plot Graph
Z Score,T Score, Percential Rank and Box Plot GraphThiyagu K
 
POINT- BIOCHEMISTRY SEM 2 ENZYMES UNIT 5.pptx
POINT- BIOCHEMISTRY SEM 2 ENZYMES UNIT 5.pptxPOINT- BIOCHEMISTRY SEM 2 ENZYMES UNIT 5.pptx
POINT- BIOCHEMISTRY SEM 2 ENZYMES UNIT 5.pptxSayali Powar
 
Q4-W6-Restating Informational Text Grade 3
Q4-W6-Restating Informational Text Grade 3Q4-W6-Restating Informational Text Grade 3
Q4-W6-Restating Informational Text Grade 3JemimahLaneBuaron
 
microwave assisted reaction. General introduction
microwave assisted reaction. General introductionmicrowave assisted reaction. General introduction
microwave assisted reaction. General introductionMaksud Ahmed
 
BASLIQ CURRENT LOOKBOOK LOOKBOOK(1) (1).pdf
BASLIQ CURRENT LOOKBOOK  LOOKBOOK(1) (1).pdfBASLIQ CURRENT LOOKBOOK  LOOKBOOK(1) (1).pdf
BASLIQ CURRENT LOOKBOOK LOOKBOOK(1) (1).pdfSoniaTolstoy
 
“Oh GOSH! Reflecting on Hackteria's Collaborative Practices in a Global Do-It...
“Oh GOSH! Reflecting on Hackteria's Collaborative Practices in a Global Do-It...“Oh GOSH! Reflecting on Hackteria's Collaborative Practices in a Global Do-It...
“Oh GOSH! Reflecting on Hackteria's Collaborative Practices in a Global Do-It...Marc Dusseiller Dusjagr
 
Interactive Powerpoint_How to Master effective communication
Interactive Powerpoint_How to Master effective communicationInteractive Powerpoint_How to Master effective communication
Interactive Powerpoint_How to Master effective communicationnomboosow
 
Hybridoma Technology ( Production , Purification , and Application )
Hybridoma Technology  ( Production , Purification , and Application  ) Hybridoma Technology  ( Production , Purification , and Application  )
Hybridoma Technology ( Production , Purification , and Application ) Sakshi Ghasle
 
Presentation by Andreas Schleicher Tackling the School Absenteeism Crisis 30 ...
Presentation by Andreas Schleicher Tackling the School Absenteeism Crisis 30 ...Presentation by Andreas Schleicher Tackling the School Absenteeism Crisis 30 ...
Presentation by Andreas Schleicher Tackling the School Absenteeism Crisis 30 ...EduSkills OECD
 
Grant Readiness 101 TechSoup and Remy Consulting
Grant Readiness 101 TechSoup and Remy ConsultingGrant Readiness 101 TechSoup and Remy Consulting
Grant Readiness 101 TechSoup and Remy ConsultingTechSoup
 

Recently uploaded (20)

Industrial Policy - 1948, 1956, 1973, 1977, 1980, 1991
Industrial Policy - 1948, 1956, 1973, 1977, 1980, 1991Industrial Policy - 1948, 1956, 1973, 1977, 1980, 1991
Industrial Policy - 1948, 1956, 1973, 1977, 1980, 1991
 
Web & Social Media Analytics Previous Year Question Paper.pdf
Web & Social Media Analytics Previous Year Question Paper.pdfWeb & Social Media Analytics Previous Year Question Paper.pdf
Web & Social Media Analytics Previous Year Question Paper.pdf
 
Advanced Views - Calendar View in Odoo 17
Advanced Views - Calendar View in Odoo 17Advanced Views - Calendar View in Odoo 17
Advanced Views - Calendar View in Odoo 17
 
Activity 01 - Artificial Culture (1).pdf
Activity 01 - Artificial Culture (1).pdfActivity 01 - Artificial Culture (1).pdf
Activity 01 - Artificial Culture (1).pdf
 
Introduction to AI in Higher Education_draft.pptx
Introduction to AI in Higher Education_draft.pptxIntroduction to AI in Higher Education_draft.pptx
Introduction to AI in Higher Education_draft.pptx
 
Organic Name Reactions for the students and aspirants of Chemistry12th.pptx
Organic Name Reactions  for the students and aspirants of Chemistry12th.pptxOrganic Name Reactions  for the students and aspirants of Chemistry12th.pptx
Organic Name Reactions for the students and aspirants of Chemistry12th.pptx
 
Beyond the EU: DORA and NIS 2 Directive's Global Impact
Beyond the EU: DORA and NIS 2 Directive's Global ImpactBeyond the EU: DORA and NIS 2 Directive's Global Impact
Beyond the EU: DORA and NIS 2 Directive's Global Impact
 
Contemporary philippine arts from the regions_PPT_Module_12 [Autosaved] (1).pptx
Contemporary philippine arts from the regions_PPT_Module_12 [Autosaved] (1).pptxContemporary philippine arts from the regions_PPT_Module_12 [Autosaved] (1).pptx
Contemporary philippine arts from the regions_PPT_Module_12 [Autosaved] (1).pptx
 
Student login on Anyboli platform.helpin
Student login on Anyboli platform.helpinStudent login on Anyboli platform.helpin
Student login on Anyboli platform.helpin
 
Z Score,T Score, Percential Rank and Box Plot Graph
Z Score,T Score, Percential Rank and Box Plot GraphZ Score,T Score, Percential Rank and Box Plot Graph
Z Score,T Score, Percential Rank and Box Plot Graph
 
POINT- BIOCHEMISTRY SEM 2 ENZYMES UNIT 5.pptx
POINT- BIOCHEMISTRY SEM 2 ENZYMES UNIT 5.pptxPOINT- BIOCHEMISTRY SEM 2 ENZYMES UNIT 5.pptx
POINT- BIOCHEMISTRY SEM 2 ENZYMES UNIT 5.pptx
 
Q4-W6-Restating Informational Text Grade 3
Q4-W6-Restating Informational Text Grade 3Q4-W6-Restating Informational Text Grade 3
Q4-W6-Restating Informational Text Grade 3
 
microwave assisted reaction. General introduction
microwave assisted reaction. General introductionmicrowave assisted reaction. General introduction
microwave assisted reaction. General introduction
 
BASLIQ CURRENT LOOKBOOK LOOKBOOK(1) (1).pdf
BASLIQ CURRENT LOOKBOOK  LOOKBOOK(1) (1).pdfBASLIQ CURRENT LOOKBOOK  LOOKBOOK(1) (1).pdf
BASLIQ CURRENT LOOKBOOK LOOKBOOK(1) (1).pdf
 
“Oh GOSH! Reflecting on Hackteria's Collaborative Practices in a Global Do-It...
“Oh GOSH! Reflecting on Hackteria's Collaborative Practices in a Global Do-It...“Oh GOSH! Reflecting on Hackteria's Collaborative Practices in a Global Do-It...
“Oh GOSH! Reflecting on Hackteria's Collaborative Practices in a Global Do-It...
 
Interactive Powerpoint_How to Master effective communication
Interactive Powerpoint_How to Master effective communicationInteractive Powerpoint_How to Master effective communication
Interactive Powerpoint_How to Master effective communication
 
Hybridoma Technology ( Production , Purification , and Application )
Hybridoma Technology  ( Production , Purification , and Application  ) Hybridoma Technology  ( Production , Purification , and Application  )
Hybridoma Technology ( Production , Purification , and Application )
 
Presentation by Andreas Schleicher Tackling the School Absenteeism Crisis 30 ...
Presentation by Andreas Schleicher Tackling the School Absenteeism Crisis 30 ...Presentation by Andreas Schleicher Tackling the School Absenteeism Crisis 30 ...
Presentation by Andreas Schleicher Tackling the School Absenteeism Crisis 30 ...
 
Grant Readiness 101 TechSoup and Remy Consulting
Grant Readiness 101 TechSoup and Remy ConsultingGrant Readiness 101 TechSoup and Remy Consulting
Grant Readiness 101 TechSoup and Remy Consulting
 
Mattingly "AI & Prompt Design: Structured Data, Assistants, & RAG"
Mattingly "AI & Prompt Design: Structured Data, Assistants, & RAG"Mattingly "AI & Prompt Design: Structured Data, Assistants, & RAG"
Mattingly "AI & Prompt Design: Structured Data, Assistants, & RAG"
 

Assessing impact of a Teacher professional development program on student problem‐solving performance. Farzaneh, Felmer..pdf

  • 1. Assessing impact of a Teacher professional development program on student problem-solving performance Farzaneh Saadati1 · Patricio Felmer1,2 Accepted: 16 December 2020 © FIZ Karlsruhe 2021 Abstract In this paper we report on the impact of a year-long teacher professional development (PD) workshop on student problem- solving skills. The PD workshop was held in Chile and promoted the use of collaborative problem-solving activities in the classroom, through monthly sessions during the school year. Participant teachers met with a monitor to solve a new problem collaboratively, plan a problem- solving activity for their next lesson, and reflect on their activities from their previous les- son. The study documents the performance of two groups of students when solving non-routine mathematics problems in two similar and non-equal tests consisting of three problems each, before and after the year of application of the workshop. The first group of students was the experimental group with collaborative problem-solving activities, as proposed in the PD workshop. The second group was the control group, composed of students whose teachers followed traditional teaching. In the first part of the paper we present the results of pre- and post-tests in which the students in the experimental group improved their problem-solving performance in a significant way compared with the control group. In the second part, we present a sample of representation strategy used by successful students in both groups and we discuss, in general, student strategies in solving test problems. Keywords Collaborative problem solving · Impact of a program · Professional development program · Problem-solving strategies · Students’ performance 1 Introduction A mathematics problem of a non-routine nature is one in which the solver does not know an immediate strategy to solve it, and thus requires various skills to do so. From an international perspective, improving students’ skills in order to solve such problems (skills in problem solving; PS) is considered a standard of quality education in mathematics. Consequently, in the quest for effective teaching of mathe- matics, there are researchers around the world studying how to improve students’ PS skills (National Research Council 2011; Reynolds and Muijs 1999; Tambunan 2019). In particular, integrating collaborative PS in teaching and learning activities is considered a means for improving students’ problem-solving abilities (Fawcett and Gar- ton 2005). Researchers embraced different viewpoints in explaining the function of collaborative learning in enhanc- ing student learning. From a sociocultural perspective, they concluded that collaboration “in the classroom allows stu- dents to test ideas, hear and incorporate the ideas of others, consolidate their thinking by putting ideas into words, and hence, gain a deeper understanding of key concepts” (Soucy McCrone 2005. p. 111). From a cognitive load perspective, researchers agreed that when students do a task collabora- tively, knowledge is easily obtained from peers by borrowing the required information from others’ long-term memory (Paas and Sweller 2012). In general, research revealed the importance of peer interactions and collaboration in order to improve individual learning (Blumenfeld, Marx, Soloway, and Krajcik 1996;
  • 2. Fawcett and Garton 2005), and math- ematical problem-solving skills (Francisco 2013; Saadati and Reyes 2019). Those developing the Chilean national curriculum were receptive of these ideas. In its 2012 reform, the main change for mathematics was the introduction of abilities and attitudes alongside content. Collaboration, persever- ance, PS, mathematical communication and reasoning are among the promoted abilities and attitudes (MINEDUC 2012). Despite the emphasis on PS and abilities in the new curriculum, several studies show that problem solving activi- ties are practically absent in Chilean classrooms (Felmer and Perdomo-Dı́az 2016). Furthermore, the results of inter- national examinations (PISA) show that Chilean students are neither successful mathematics problem solvers (OECD 2016) nor collaborative problem solvers (OECD 2017). On the other hand, the results of students’ mathematics profi- ciency in national examinations (called SIMCE) have been essentially stable over the last ten years (National Agency of Quality of Education 2018). What may explain these results? The mathematics teaching in Chile, as in many countries, is basically traditional (Radovic and Preiss 2010), and cor- responds to the way the teachers were taught in school and during their initial teaching training (Felmer and Perdomo- Dı́az 2016; Chandia, Rojas, Rojas and Howard 2016). The lack of systematic PD programs for introducing the national curriculum changes in classrooms, as abilities and attitudes, may be the explanation. As a way of contributing to the improvement of math- ematical education in Chile, bringing the benefits of collabo- rative learning and problem-solving skills, we engaged in a long-term research and development project known as the ARPA1 Initiative (Felmer, Perdomo-Dı́az, and Reyes 2019). The long- term goal of this project is to be part of the pro- cess of changing the traditional style in Chilean mathematics classrooms by promoting an active approach for the devel- opment of students’ skills in mathematics, in particular PS skills. The project strategy is to induce changes in teachers’ practices in classrooms though professional development (PD) workshops, in particular a 9-month-long workshop, whose impact on students is reported in this paper. This workshop was designed for mathematics teachers, with a focus on training and supporting them to establish collaborative PS practices for their students in the classroom, with the goal of developing problem solving and other skills in individual students. Our purpose in this paper is to pro- vide evidence on whether or not, and how, students improve their individual PS skills in the case of 6th grade students whose teachers participated in the above-mentioned PD workshop. Moreover, since non-routine problems offer opportuni- ties for students to mobilize skills, and illuminate creativ- ity in choosing an appropriate representation strategy to solve them (Polya 1957), it is our concern to identify suc- cessful strategies that students use for solving these prob- lems. In order to improve student mathematics learning, it is important to know how they elaborate their thoughts in solving non-routine problems, which demands flexibility in thinking with an extension to previous knowledge. Consequently, we concern ourselves with students’ achievements in non-routine PS as a result of participating in collaborative PS activities, and in identifying successful strategies. In this paper we answer two research questions: • Is there a difference in students’ problem-solving perfor- mance after practicing in collaborative problem-solving activities?
  • 3. • What are the frequent representation strategies occur- ring in mathematical solutions presented by successful problem solvers? 2 Collaborative learning as an instructional practice, and the role of PDs Empirical studies have found collaborative learning in math- ematics to be a teaching method that promotes students’ problem-solving abilities in different ways (Soucy McCrone 2005; Sofroniou and Poutos 2016). Swan (2006) considered collaborative learning to be a resilient approach that encour- ages students to overcome affective barriers while learning mathematics. Francisco (2013) explained that collaborative learning allows individuals to build on each other’s ideas, and thereby to promote their mathematical understanding. Saadati and Reyes (2019) argued that collaborative learn- ing improves individual problem-solving skills, especially for those students with positive dispositions toward math- ematics. Pijls, Dekker, and Van Hout-Wolters (2007), in an experimental study, found that individuals benefit from collaborative learning by engaging in certain activities and sharing their ideas, by explaining, justifying, and recon- structing their work. Dahl, Klemp, and Nilssen (2018) also highlighted the role of communication skills in promoting the impact of collaborative learning and stimulating stu- dents’ mathematical progress “by giving each other positive feedback and by acknowledging each other’s contributions” (p. 11). On the other hand, the effectiveness of collaborative PS depends mainly on teachers, who have a crucial role as guides and facilitators in their classrooms. It is also related to the experience of teachers with non-routine problems and classroom organization: for example, a teacher’s abil- ity to manage groups in a collaborative classroom is a fac- tor in improving student enjoyment of mathematics as well as their engagement (Liljedahl 2014). Teachers face chal- lenges in identifying well-designed tasks and setting them up appropriately when attempting to conduct active learn- ing in their classrooms (Stein, Engle, Smith, and Hughes 2008). Therefore, teachers need to be prepared in a process designed to enhance their knowledge and skills, in order to establish changes in their instruction and, in turn, improve their students’ learning (Desimone 2009). Among such processes, PD programs are crucial instruments for reach- ing the desirable changes in teacher practice and student outcomes (Darling-Hammond, Hyler, and Gardner 2017). Borko (2004) and Desimone (2009) proposed two concep- tual models for studying the effect of a PD program. In these two models, the changes in students’ learning are considered an important impact of a PD, beyond the impact of the PD on teachers’ mathematical knowledge and skills. For exam- ple, Jacob, Hill and Corey (2017) conducted a study to fol- low teachers and their students after participating in a PD, and found some evidence of positive impact on teachers’ mathematical knowledge; however, they did not report any changes in student outcomes. To sum up, based on what researchers claimed and the evidence reported, in order to change classroom practices and improve problem solving abilities in students through collaborative-based PS instruction effectively and efficiently, teachers need preparation through proper PD programs. However, research in this important educational area is not well developed, with many important questions remaining. Much work has been done on general characteristics that a program should have to be effective (Desimone 2009; Desimone, Porter, Garet, Yoon, and Birman 2002; Darling- Hammond et al. 2017), but work still remains to develop a program assessment (TNTP 2015; Jacob, Hill, and Corey 2017; Borko, Jacobs, and Koellner 2010). Moreover, in order to document verification for the impact of a PD program, research on the impact in student learning is desirable. 3 Students’ problem-solving strategies
  • 4. Mathematics problem-solving is a process of finding a solu- tion when the procedure is not clear for problem solvers. In this case, problem solvers need to use some tactical skills to choose or find suitable techniques to get a solution. Early work focused on describing the problem-solving process, which Pólya (1957) suggested could be encapsulated in a four-stage problem-solving heuristic, as follows: understand- ing the problem, devising a plan, carrying it out, and looking back. A heuristic is, in fact, a strategy to formulate a prob- lem, which helps the problem solver to find a solution that can enhance PS performance (Schoenfeld 1982). However, in following the process there is no guarantee that a problem solver will arrive at a solution. Students may need to re- formulate the problem because these problems “possess a conceptual ‘slipperiness’ for solvers: the nature of what the solver interprets as problematic may change as the solvers develop understanding and ‘get a handle’ on the problem and progress to a solution” (Cai and Cifarelli 2005). Considering students’ representations in terms of a set of conventional notation, symbols, figures, and diagrams is also central for researchers to understand students’ construc- tion and understanding of mathematical ideas (Dahl 2019). According to Gick (1986), recent information-processing theories of PS have emphasized two important processes of PS: (a) generation of a problem representation based on the solver’s view of the problem, and (b) a solution process that involves a search through the representation. A student’s thinking process can be understood in the relation between the way that he/she represents the problem’s elements and given information and the way that he/she develops a solu- tion in the representation. According to Duijzer, den Heuvel- Panhuizen, Veldhuis, and Doorman (2019) “Making con- nections between variables and proficiently constructing representations is key to higher-order thinking activities within mathematics [] education” (p. 4491). We refer to the process as a “representation strategy”, a detailed invented or classical representation, which can be seen in a student’s col- lection of inscriptions while attempting to solve a problem. Cai (2000) classified representations in a student’s inscrip- tions as follows: verbal (primarily written words), pictorial (a picture or drawing), arithmetic (arithmetic expressions), and algebraic (algebraic expressions) representation. This classification can illuminate students’ strategies as they con- nect their knowledge and abilities to a way they process the information. For example, in generalization of a pattern, Zazkis and Liljedahl (2002) showed that students prefer to express or write the pattern of generalization rather than employing algebraic notation, which they concluded was a tendency that indicated a gap between students’ ability to express their knowledge in a verbal form and their abil- ity to work with algebra comfortably. On the other hand, Nistal, Van Dooren, Clarebout, Elen, and Verschaffel (2009) explained that students’ representational choices can be influenced by their prior experiences and knowledge about strategies. In general, Cai and Hwang (2002) concluded that cultural issues, type of problems, and teachers’ classroom practices influence students’ tendency to choose one of these representation strategies while solving a problem. In mathematical non-routine problem-solving processes, though, there is another critical ability for a problem solver to be successful, which is flexibility in using heuristic strate- gies (Elia, van den Heuvel- Panhuizen, and Kolovou 2009; Heinze, Star, and Verschaffel 2009). These researchers argued that the flexible and adaptive use of strategies and representations enables students to solve problems accu- rately. However, there are always some common/minimal errors appearing in students’ problem solving and, as Cai (2000) declared, students’ errors and difficulties in solving problems are not due to their lack of procedural knowledge but rather to their incomplete conceptual understanding. Misinterpretation of the mathematical structure of a problem and the omission of part of the information presented in a word problem would also be thought of as difficulties in students’ problem solving
  • 5. (Polotskaia, Savard, and Freiman 2016), which needs to be studied in order to understand students’ PS strategies, and to help them to overcome their mistakes. 4 Methods 4.1 The PD workshop The PD workshop of ARPA is designed with nine monthly sessions, lasting three hours each, where teacher activity is centered in practice and reflection. In a regular session during the PD workshop, teachers start reflecting on the PS activity they implemented with their students, in which they discuss their performance, and their own good and bad choices and omissions. Next, teachers solve a problem in a collaborative way, modeling the classroom work with a monitor, and then, in a plenary discussion, teachers ana- lyze strategies and solutions. The session ends by planning the coming PS activity they will implement with their stu- dents, with the problem they have solved. Teachers plan their actions, anticipating possible difficulties their students may have, and they prepare any necessary questions. A simplified and extended version of the problem is prepared to give to groups with difficulties or to groups who successfully reach the solution. During the workshop session, sessions with teachers are led by an expert monitor, in order to stimulate discussion and reflection, to model problem-solving activi- ties with students, to guide the teachers in planning and mak- ing decisions while conducting collaborative PS, and to give feedback to teachers at all times. Along with the workshop, teachers implement seven col- laborative PS activities or lessons, as proposed in the work- shop. In these 45–90 min lessons, students are organized in random groups (each with 3 or 4 students), and they receive a non-routine problem. The students start working autono- mously, discussing the problem with their peers in the group and together looking for a strategy that may solve the prob- lem. However, each student is responsible for solving the problem and learning about the strategy. They are allowed to ask the teacher if they do not understand the problem or if the process gets stalled, however the teacher answers with guiding questions to stimulate their thinking. Once they have solved the problem, the teacher asks for an explanation from all members of the group, and proposes an extension if the explanation is satisfactory. If it is not, they have to continue working. Before the end of the problem-solving lesson, a plenary discussion takes place, in which all students dis- cuss their strategies and solutions, with the stimulus of the teacher. During the PD workshop sessions, teachers learn through practice, modeling and discussing with peers how they will conduct the PS lessons. Teachers are not to give students the solution or to propose a strategy or heuristic to solve the problem. They guide the work of students using guiding questions. Teachers will not interact with individual students when they are working on the problem, but always direct their attention or questions to the group, and always encour- age collaboration among the members. During plenary dis- cussion, the teacher chooses students to explain their solu- tions, and he/she sequences their participation in advance to promote discussion among students (Stein et al. 2008). The teacher always remains in the background, encouraging discussion with emphasis on different strategies for problem solving. 4.2 Context of the study and participants
  • 6. The focus of this study is the impact on student prob- lem solving skills of the PD workshop described above. The intervention is part of a longitudinal research project designed to inquire into the possible impact of the ARPA project on Chilean primary students’ problem-solving skills, behavior, and attitudes. While the school year in Chile nor- mally starts in March and ends in December, the PD work- shop under study started in September 2017 as a pre-inter- vention and introductory period of the program, allowing teachers to learn about the principles of the program and start adopting the new classroom practices. The workshop continued throughout the school year in 2018. In this study, data were collected in October 2017 for the first time as the pre-test and the post-test was administered in October 2018, which was two months before school examination period. This study was designed as non-equivalent quasi-experi- mental research project in which an intact group of students was chosen as the control group that was similar to the treat- ment group in as many ways as possible. Even though there were fewer participants in the control group than those in the intervention group, we still call it a quasi-experimental design, since the study is associated with the benefits of classroom practice change offered by the PD project. The participants in the experimental group were com- posed of students whose teachers participated in the 9-month-long PD workshop held in Rengo county, situated in the O’Higgins Region, South of Santiago. Among all teachers participating in the workshop, five were invited to participate in this study and voluntarily accepted it. Two of the five teachers were teaching two classes at the same grade in parallel, and agreed to do PS lessons in one of the classes and continue their traditional teaching method in the other. We therefore called the students of these two classes without ARPA as the control group. The main criteria for choosing the teachers’ sample was that they were teaching 5th grade students and had the opportunity to follow up in teaching the same students the following school year. This aspect allowed us a longer student follow up during the PD workshop.
  • 7. In total, there were 100 students, 47 girls, and 53 boys, in these seven classes. Considering the preference of their teachers, there was a control group of 45 students and an experimental group of 55 students. We noted that students in both groups were comparable regarding their background in problem-solving experiences before the workshop began. All teachers considered in the study came from public schools located in Rengo. The performance of the O’Higgins region in the national test (SIMCE) was very close to the national average, however, the performance of the schools in this study was below this average. In fact, the average in the Mathematics Test for 6th grade during the last six years in these schools is 232.6 points, while the average in the region is 248.4 points and the national average is 247.2 points. 4.3 Instruments Even though the PD workshop encourages collaborative PS in the classroom, our instruments are designed for study- ing the individual performance of students. This decision is based on two considerations. First, because we are com- paring two types of classroom practices, we should study a common output of impact on students, that is individual PS performance. Second, national and international tests mainly consider individual performance, so that governmental offic- ers, educational authorities and even school leaders or teach- ers are interested in knowing if a particular PD workshop is effective in improving mathematics learning, by looking at individual performance. The instrument used in this study is composed of three problems. The problems, namely, the Cakes, the Patterns, and the Race (presented hereafter) have two similar but not equal versions for each one, as used in the pre- and post- tests. These problems were chosen as non-routine and con- tent-less problems as they could be solved without neces- sarily knowing some specific mathematics content and the target students (control and experimental groups) had not worked on this type of problem before. For both the pre-test and post-test, the three problems were given to students in a sequence, one after the other, allowing them to spend 15 min on each of the problems. This design has the purpose of put- ting students in a new situation each time with the need to produce a solution, so the ability to formulate and think of a strategy would be easily seen. It should be highlighted that based on the purpose of the study as we explained earlier, both the pre-test and the post-test were done individually by the students, rather than in their groups. 4.4 Scoring and coding scheme for performance and strategies Student responses to each problem were coded based on their performance and the strategies they used to solve each of the three problems. Performance. Student written responses in each test and each problem were coded based on their effort to formulate and solve the problem. A four-point scale was designed to capture the correctness of the solution as well as the under- standing and formulation of the problem. Table 1 explains the scale. Representation strategies. A general coding scheme was created with the possibility of being individualized to classify specific strategies students used in their intent to solve each problem. We followed prior work on PS (Cai 2000; Cai and Hwang 2002) to capture the students’ rep- resentation strategies based on 5
  • 8. codes, as in Table 2. This initial coding scheme was monitored with a list of more detailed strategies thoroughly identified in the students’ work, depending on how they dealt with given and/or unknown quantities in order to formulate their solutions. 4.5 Dataanalysis The analysis was carried out first quantitatively and then qualitatively, based on students’ written solutions to the three non-routine problems. Firstly, the students’ perfor- mance in each problem was coded with reference to the coding scheme previously presented. The first author and an expert mathematics teacher participated in the coding. They began with several initial meetings to review and reach an agreement on the coding scheme. They then checked their rate of agreement on a group of random responses, on which they agreed in 89% of their code selections, indicating an adequate inter- rater reliability. The students’ overall per- formance on the test was calculated as an average of their performance on each problem for experimental and control groups. Inferential and descriptive statistics methods were used to answer the first research question and to compare the mean differences between the groups. To answer the second research question, we focused on student performance on the post-test. In each problem, we categorized students into two groups by considering their performance scores in that problem. Students who achieved scores of 2 or 3 were categorized as successful problem solv- ers, and those who scored 0 or 1 were categorized as failing students. We then studied the percentages of students who used similar strategies among successful and failing prob- lem solvers. We also examined how this percentages differed between control and experimental groups. Finally, we illus- trated the most often used strategies by successful students. 5 Results 5.1 Students’ overall performance in PS At the beginning of the PD workshop, we conducted a pre- test to capture the preexistent difference in mathematical problem-solving skills among participants in both groups. The students’ overall problem- solving performance in the pre-test was calculated according to the mean of their per- formance in each of the three problems. An independent- samples t-test was conducted to compare the overall perfor- mance scores for students in the control and experimental groups. The results showed that there was no significant difference between the control group and the experimental group in their problem-solving performance at the begin- ning of the workshop. The mean (M) score of the control group was 1.76 with a standard deviation (SD) of 0.92, and for the experimental group M was 1.76 with a SD of 1.07. This result implies that the participants of both groups were approximately at the same level of PS performance before the experiment. Thus, we have two homogenous groups of students according to their problem-solving abilities. At the end of the workshop, the overall performance of students according to their problem-solving abilities was calculated using the mean of their performance in each of the three problems of the post- test. We conducted a one way between groups analysis of covariance to compare the performance scores of the control and experimental groups. The students’ mean scores on the pre-test were used as the
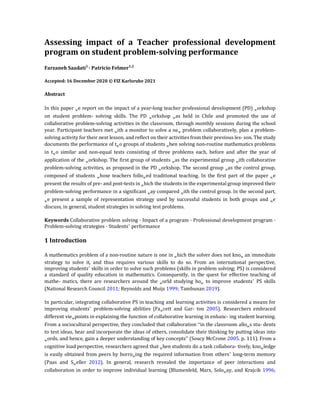
  • 9. covariance in this analysis. Preliminary checks were con- ducted to ensure that there was no violation of the assump- tions of normality, linearity, homogeneity of variances, and homogeneity of the regression slopes. After adjusting for the pre-test scores, we found a significant difference between the control and experimental group on post-test scores on overall PS performance; the F ratio of F(1, 96) = 10.30, p- value < 0.05, indicated that the mean change score was significantly greater for the experimental group (adjusted- M = 1.40, SD = 0.85) than for the control group (adjusted- M = 0.93, SD = 0.62). This is an indicator of the effectiveness of the collaborative problem-solving practices promoted by the workshop in contrast to the traditional learning approach. Mathematics teachers who participated in the workshop and carried that knowledge into their instruction in the experi- mental classes, improved those students’ problem-solving skills and thinking. To have an overall picture of the students’ performance, we present in Fig. 1 the performance of the groups across the problems. We first observe that at least 70% of students were unable to formulate the problems or they could formulate but without any success in solving them, in both groups, except for the experimental group in the Race problem, where this percentage reached 50%. The students in the experimental group showed higher success rates than students in the con- trol group across all three problems and, on the other side, the failure rates of the control group were higher than the failure rates of the experimental group across all problems. In the first problem, the Cakes, the differences were not so drastic, while there was a noticeable difference in the per- centages of students that formulated with a correct answer and those that left a blank answer or were unable to for- mulate. Looking at the results of The Patterns, we observe that students in both groups were progressively less likely to solve correctly from Part 1 to Part 2. The highest difference in performance of students was found in The Race where we see that the percentages of students in the control group that
  • 10. left a blank answer or were unable to formulate the problem correctly, increased two-fold over that of the experimental group. At the same time, the percentage of students in the control group that formulated this problem with a minor error was about one third of that of those in the experimen- tal group. Moreover, in the experimental group there were some students that formulated with success, while none of the control group did so. In general, as Fig. 1 shows, the unsuccessful students mostly were unable to formulate the problems correctly. 5.2 Strategies used by successful problem solvers To address the second research question, we focused on the solution strategies leading to the correct or almost cor- rect (including a minor mistake) answers. We discuss the representation strategies used by the successful and failing students and then present the work of some successful stu- dents in formulating the problems, both in the control and the experimental groups. 5.2.1 Problem 1. The Cakes
  • 11. In this problem, two sub-problems need to be solved or considered in order to get the information to make sense of questions asked in parts A and B. Only 12% of students suc- ceeded in giving a solution to the problem (right or almost right, that is 3 or 2 points), while 88% only obtained 1 or 0 points, including 9 students who returned an empty answer, as we see in Table 3. Among the three problems, this one was the most difficult for students participating in the study. The common strategy that students used in trying to solve the problem was a combination of Arithmetic, Graphical, and Verbal strategies. A combination of Graphical and Verbal was the most used with 25% and an Arithmetic and Verbal with 10%, while the rest (8%) used other combina- tions. Table 3 shows that the rate of success increases when students applied the combined strategies. We observe that among those students that used only a Verbal representa- tion strategy (37) only one succeeded in the solution, while no students succeeded using only a Graphic or Arithme- tic representation strategy (See Table 3). The Graphic and Arithmetic representation strategies were essentially equally distributed among the control and experimental groups. However, the Verbal representation strategy was most used by the control group and the Combined strategy was most used by the experimental group. Next, we discuss three examples of the strategies, which can explain and illustrate the different approaches used by the participants. Our first student used a Verbal representa- tion strategy combined with an Arithmetic one, even though it appears as if only as a Verbal one was used. Starting with boys, Ana2 divided each cake into three pieces, obtaining 18 pieces, so that two pieces can be given to each of
  • 12. the nine students. Then, Ana performed a similar task with cakes for the girls and realized that each girl received two pieces and there was one piece left (Fig. 2). The answer for part A is not correct, but the overall conclusion is correct. This kind of combined strategy represents a meaning-making strategy in which the student has found his/her solution based on the meaning of division and Arithmetic operations.
  • 13. In another example, Arturo (Fig. 3) used a purely Arith- metic representation strategy, just dividing the number of cakes by the number of boys or girls, using the long divi- sion algorithm. He then wrote the answer to each ques- tion accordingly, but added a verbal explanation that was somehow confusing. This example is presenting a direct translation of the problem made by the students to get the answer by simply using an algebraic operation. However, it seems because of his lack of experience with this type of problem, he could not compare the proportions found by the divisions. The explanation made by Arturo can reveal that perhaps the student did not get the meaning of the division and we can call it a simple direct translation of the numbers and the keyword -sharing- presented in the problem. Antonia (Fig. 4) used a purely Verbal representation strat- egy to solve the problem. She presented a solution to part A answering that both boys can receive the same amount of cake (two thirds) and each girl can receive the same amount of cakes (one and one fourth). Then, in answering part B, she said that girls would receive more than the boys, but without explanation. This strategy led to a partial solution to the problem, including a misinterpretation. The differ- ence between this type of strategy and the one used by Ana arose when the student tried to explain the sense-making question in part B using the information presented in part A. Antonia did not seek to use the information presented in part A. It is
  • 14. likely that the explanations in part A appear to have been interpreted just to explain her understanding of sharing the equal amount of cake among girls and boys separately without considering the relationship between parts A and B (Fig. 5). To solve this problem, we expected that students would find the pattern of the given examples, and apply pattern to answer the questions in parts A and B. Moreover, we expected to see more use of arithmetic strategies than graphic ones, especially to answer part B. However, the stu- dents’ work showed a clear preference for using the Graphic representation strategies to solve this problem as shown in Table 4. In fact, the majority of students reproduced their graphical models by following the given pattern, and explained their accurate or inaccurate images by an intuitive justification, or sometimes by arithmetic operations, rather than finding the overall pattern. Arithmetic representation strategies were used less frequently compared to the Graphic one. Students in the experimental group were much more 5.2.2 Problem 2. The Patterns The following drawing shows pictures of squares made by match sticks, where each square is constructed by four sticks forming its sides. If the construction of squares is continued in the form shown in the pictures: A. How many match sticks are needed to construct 25 squares? Explain your work. B. How many squares can be constructed with 63 match sticks? Explain your work.
  • 15. likely to use the Graphic to answer the problem, while stu- dents in the control group did not show any preferences in the use of Arithmetic vs Graphic (Table 5). The Verbal representation strategies were the third most frequent among students in both groups and a few students used combined strategies. About a third of students using the Graphic or Arithmetic representation strategy moved mostly to No written explanation, but some moved to the Verbal representation strategy. In part A, 22% of students succeeded in solving the problem, while 16% succeeded in solving part B. Most of succeeding students used a Graphic representation strategy.
  • 16. In what follows, we present some students’ work to illus- trate their different representation strategies in solving the problem. The following figure depicts the work of Beatriz, which combines a Graphic and Verbal representation strat- egy. In part A, she made a picture of the 25 squares and the counted the match sticks, failing in the counting. In part B, she simply counted the match sticks from the drawing from Part A and then argued verbally. In fact, Beatriz was able to see the relationship between the two parts of the question, and based on the structure of the pattern drawn in part one, she found it easier to state the argument verbally in part B. In the next two examples, the students could recognize the pattern, but were not able to express it algebraically. The arithmetic relations are mainly used to construct and make sense of what he/she did with the graphical model. Benjamı́n used a Graphic representation strategy by draw- ing all the squares involved in the question (Fig. 6). In Part A, Benjamı́n made some calculations as a way to check the results obtained by counting the match sticks in the picture. In Part B, Benjamı́n relied completely on counting the match sticks in the picture, clearly showing that there were two left, after counting 20 squares. We then present the work of Belén (Fig. 7), which was based on a Verbal representation strategy; however, the argu- mentation references a possible drawing out of the assigned paper. Belén also made a reference to an arithmetic opera- tion for checking the result in Part A. Students commonly made a mistake when they did not recognize the pattern. A common mistake in doing this problem was related to their not recognizing the pattern. In most cases, students directly used Algebraic or Arithmetic representations. This type of representation perhaps prevents students from being able to see the structure presented in the problem. Figure 8 presents an example of work by Basilio, that uses an Arithmetic representation strategy by simply multiplying and dividing by 3, and thus failing to realize that for the first square there are four match sticks needed. A drawing may have allowed Basilio to realize the mistake.
  • 17. as half of them omitted the information about horse B, and solved the problem for the other 4 horses. Another half of the students had a problem loading the location of horse B, which we explain later. Among students with a success- ful answer, the work of Carmen and Carlos (Fig. 9) used essentially the same strategy, with a missing and incomplete explanation. Another group of students who could formulate the prob- lem and get close to the answer, omitted part of the informa- tion presented by the problem scenario and solved the prob- lem. This strategy is associated with the difficulty of locating horse B, especially for those students with this solution strat- egy: half of them omitted the information about horse B, and solved the problem for the other 4 horses (Fig. 9). The difficulty with this problem seems to be that after locating horses F, C, and P, horse B has to be located in reference to 5.2.3 Problem 3. The Race In a horse race, horses are represented by the first letter of their names. Can you find the order at the end of the race, following the hints given next? (Explain your answer.) • F arrived 7 seconds before C. • P arrived 6 seconds after B. • D arrived 8 seconds after B. • C arrived 2 seconds before P. To solve this problem, almost all of the students tried to explain their answers verbally. About 3 of them tried to solve this problem by drawing and verbal explanation. However, in this problem, we could categorize the strategies that they used based on the way that they could capture and proceed with the information presented in the problem. Student performance in this problem indicated that about 80% of those in the control group were not able to understand and/ or formulate the problem. This proportion was about 40% for students in the experiment group. Moreover, of those who attempted to solve the problem, only 4 students were able to solve the problem completely, and they were from the experiment group. The group of students who could formulate the problem and get close to the answer (15% in the control group and 40% in the experimental) omitted a part of the information presented by the problem scenario and solved the problem. This strategy can be considered as a method of simplifica- tion, especially for those students with this solution strategy, horse P and only then, horse D is located in reference to B, and the information already gathered. In Fig. 10 we see the work of Cecilia, which built up an answer with four horses, locating correctly horses F and C and the relative position of P and D. It is unclear how she decided to put horse P after C. In Fig. 11, we see a similar situation, but here Claudio located horse B between horses C and P, but without a clear reason. Finally, in Fig. 12, we see the work of Celia and Cristian, with a similar mistake, only failing in locating horse B.
  • 18. 6 Discussion and conclusions PD programs constitute an important instrument for edu- cational change at the national or local level. There is a huge variety of such programs, with a wide range of char- acteristics, involving a high number of teachers world- wide, and important economic resources are spent in their implementation. In this paper, we provide a piece of evi- dence regarding the effectiveness of a teacher PD workshop on the development of problem-solving abilities in students. While the workshop is designed for mathematics teachers and all of its activities are oriented and performed with teachers, the
  • 19. purpose of the workshop is to improve stu- dents’ outcomes. Thus, the purpose of this study is to obtain evidence of this change, as suggested by Borko (2004) and Desimone (2009). We conducted a quasi experimental study to compare the problem-solving performance of 6th grade students whose mathematics teachers followed the PD workshop, with stu- dents from the same grade, whose teachers continued their traditional teaching method. The results of the pre-test sup- ported that the two groups of students were homogeneous in their overall problem-solving performance, while the result of the post-test showed a statistically significant difference in performance in favor of the experimental group. Natu- rally, these results are explained in part because there were more students in the experimental group who succeeded in solving the problems and fewer students that failed, as can be seen in Fig. 1. However, we would like to call atten- tion to the high number of students with a blank answer or those not able to formulate the problem in both groups, and to the fact that the number of those students decreased in the experimental group, as seen in Fig. 1. The performance change may be explained precisely because students in the experimental group worked non-routine problems in a col- laborative way during the year. But certainly, collaborative PS requires a different form of interaction between teacher and students, allowing students more autonomy with their own formulations and strategies, which are shared within the groups and with the whole class at the end. The students’ PS-lessons were distributed approximately monthly along the project period, so that from the very beginning of the workshop, teachers began introducing the new classroom practices in their classrooms. The autonomy promoted by teachers allowed students to find ways to represent their problem strategies, and consequently to generate more pro- ficient and meaning-making problem- solving approaches. These results are consistent with our discussion in the section on Research on Collaborative Learning and PS, where, based on the literature, we argued that the effective- ness of collaborative PS depends on several factors such as classroom organization, group composition and selection, the characteristics of the problems, the characteristics of the context in which group members engage in finding a solution (Nistal et al. 2009), and individual learners benefiting from collaboration (Dahl et al. 2018; Paas and Sweller 2012). In all these factors, the role of teachers is crucial. For example, in the experimental group, teachers learn how to design an effective small group environment in which they encourage their
  • 20. students to work collaboratively, reflect on the repre- sentations suggested by peers in the group. Moreover, this environment offers opportunities that enable students to cri- tique and discuss each other’s representations, while seeking alternative possible representations. We conclude that the higher problem-solving performance shown by students in the experimental group can be attributed to the classroom practices learned and implemented by teachers participating in the workshop. At this point, it is also interesting to recall Suydam (1980, as cited in Schoenfeld 1982), who stated that “research evidence strongly concurs that problem-solving performance is strongly enhanced by teaching students to use a wide variety of strategies or heuristics, both general and specific” (p. 31). This statement is somehow questioned by the result in this study, where students improved perfor- mance, and no specific strategies or heuristics were taught to them. At this level at least, improvement comes because of exposure to non-routine problems, collaborative work, and teacher guidance directed to enabling students to gain autonomy and rely on their own ideas and strategies to solve the problems. Regarding the second research question, we first observe the low number of 20 successful students in solving at least one problem. The short time given to students to solve these problems could be a reason for the low performance exhib- ited by both groups, and also the overall low performance of these students in national tests when compared to other students at the regional and the national level, as mentioned at the end of Sect. 4.2. Over the successful cases, we observe a wide variety of representation strategies regardless of whether or not the students were in the control or experimental groups. Thus, within the framework of this sample of students, this shows that the participation of their teachers in the PD workshop did not make a difference by widening the number of differ- ent strategies. This is consistent with the fact that teachers following the workshop did not teach or promote differ- ent heuristics or strategies, but that students devised those among themselves. Behind the difficulty for students in solv- ing these problems is their
  • 21. ability to formulate the prob- lem or a way to find a strategy to solve them, or at least to advance towards the solution. The results showed that more students in the experimental group than in the control group did start with a representation of the problem. At this point, we quote Alibali et al. (2009): “One reason that children may use incorrect or inefficient strategies to solve problems is that they fail to accurately represent key features of the problems” (p. 90). The analysis of the written productions of successful students showed that they were able to make sense of their solutions. They showed a higher level of metacognition by controlling or justifying their solutions or seeing the rela- tionships between the given and required in each problem. A low number of successful students showed a tendency to use algebraic representations to solve the first two problems— not consistent with the suggestion of Cai (2002), who stated that the level of knowing and being familiar with algebra does not impact a student’s mathematical reasoning, nor their tendency to choose an arithmetic strategy to solve a problem. Among the 12 successful students in the Cake problem, 11 of them used a combined strategy, either Graphical and Verbal or Arithmetic and Verbal. Their tendency to choose the representation strategy to solve a problem might be related to several factors such as experiences, classroom practices, and the schools’ textbooks rather than their domain specific knowledge. In the Pattern problem the most common strategy used by successful students was the graphic one for both part A and part B. Among the three problems, this one was the most challenging for all students. Most of them could not find the solution, and even after graphically drawing the rec- tangles and repetition, the majority of them failed to follow the pattern. The students’ challenges with the generalization and understanding of patterns are reported in other stud- ies (Inmre and Akkoç 2012; Zazkis and Liljedahl 2002). It was clear in the students’ work presented here that when the number of sticks increased, most students kept to the verbal explanations, not consistent with the results of Zazkis and Liljedahl (2002), who pointed out that there is a gap between being able to express a pattern verbally and expressing it algebraically. Regarding the Race problem, we categorized strategies of successful students with respect to the ability to extract information about the number of horses. Among them, 20 students located and ordered the horses correctly, while 13 of them missed one horse, but located the other four cor- rectly. This problem involved the largest number of success- ful students among the three problems, however, it involved a very large number of students that were not able even to formulate the problem. This study has various limitations that we would like to mention here. First, the small number of students and teach- ers in the sample does not allow us to reach more complete conclusions regarding the effectiveness of the PD workshop in improving student performance in PS. The second limita- tion is that the study used only one dimension to compare the control and experimental groups, leaving out various other interesting variables to consider, such as the ability for group collaboration and communication. We expected the workshop to have a favorable impact on these variables. Third, the effect was measured during or immediately after finishing the workshop, and no information was gathered over a longer period after the workshop. Finally, we continue to advocate the important role of the PD program in changing classroom practices, with the goal of improving the students’ problem-solving skills, including learning to elaborate and
  • 22. criticize their representations for solving a problem. Perhaps, this process of learning takes more time than just one school year, so they can gradually learn appropriate representations among all possible ones by switching and going back and forth among all those strate- gies suggested by peers. We end this paper with a call for more research in dif- ferent directions in the area of PD programs. In particular, much more research is needed on the empirical effective- ness of programs measured by students’ outcomes, rather than teacher learning or change of classroom practices. The students’ performance is an indirect variable that matters in program effectiveness. Acknowledgements The authors would like to thank the anonymous referees for their useful comments and suggestions, which improved the paper considerably. Funding from PIA-CONICYT Basal Funds for Centers of Excellence Project FB0003 and Grant PAI AFB-170001 is gratefully acknowledged. FS is also grateful for the support of CONI- CYT/Fondecyt Postdoctoral Project 3170673. References Alibali, M. W., Phillips, K. M., & Fischer, A. D. (2009). Learning new problem-solving strategies leads to changes in problem represen- tation. Cognitive Development, 24(2), 89–101. Blumenfeld, P. C., Marx, R. W., Soloway, E., & Krajcik, J. (1996). Learning with peers: From small group cooperation to collabora- tive communities. Educational Researcher, 25(8), 37–39. Borko, H. (2004). Professional development and teacher learning: Map- ping the terrain. Educational Researcher, 33(8), 3–15. Borko, H., Jacobs, J., & Koellner, K. (2010). Contemporary approaches to teacher professional development. In P. Peterson, E. Baker, & B. McGaw (Eds.), International encyclopedia of education (Vol. 7, pp. 548–556). Oxford: Elsevier. Cai, J. (2000). Understanding and representing the arithmetic averag- ing algorithm: An analysis and comparison of US and Chinese students’ responses. International Journal of Mathematical Edu- cation in Science and Technology, 31(6), 839–855. Cai, J. (2002). Assessing and understanding US and Chinese students’ mathematical thinking. ZentralblattfürDidaktik der Mathematik, 34(6), 278–290. Cai, J., & Cifarelli, V. (2005). Exploring mathematical exploration: How two college students formulated and solved their own math- ematical problems. Focus on Learning Problems in Mathematics, 27(3), 43. Cai, J., & Hwang, S. (2002). Generalized and generative thinking in US and Chinese students’ mathematical problem solving and problem posing. The Journal of Mathematical Behavior, 21(4), 401–421. Chandia, E., Rojas, D., Rojas, F., & Howard, S. (2016). Creencias de formadores de profesores de matemáticasobreresolución de problemas (Mathematics teacher educators’ beliefs on problem solving). Bolema, 30(55), 605–624. Dahl, H. (2019). “He’s so fast at drawing”—Children’s use of draw- ings as a tool to solve word problems in multiplication and divi- sion. In Eleventh Congress of the European Society for Research in Mathematics Education (Vol. 3, pp. 4475–4482. Freudenthal Group, Freudenthal Institute: ERME.
  • 23. Dahl, H., Klemp, T., & Nilssen, V. (2018). Collaborative talk in math- ematics–contrasting examples from third graders. Education 3–13, 46(5), 599–611. Darling-Hammond, L., Hyler, M. E., & Gardner, M. (2017). Effec- tive teacher professional development. Palo Alto, CA: Learning Policy Institute. Desimone, L. M. (2009). Improving impact studies of teachers’ profes- sional development: Toward better conceptualizations and meas- ures. Educational Researcher, 38(3), 181–199. Desimone, L. M., Porter, A. C., Garet, M. S., Yoon, K. S., & Birman, B. F. (2002). Effects of a professional development on teachers’ instruction: Results from a three-year longitudinal study. Educa- tional Evaluation and Policy Analysis, 24(2), 81–112. Duijzer, C., den Heuvel-Panhuizen, V., Veldhuis, M., & Doorman, M. (2019). Moving towards understanding graphical representa- tions of motion. In Eleventh Congress of the European Society for Research in Mathematics Education (Vol. 3, pp. 4491–4497). Freudenthal Group, Freudenthal Institute: ERME. Elia, I., den Heuvel-Panhuizen, M., & Kolovou, A. (2009). Explor- ing strategy use and strategy flexibility in non- routine problem solving by primary school high achievers in mathematics. ZDM, 41(5), 605. Fawcett, L., & Garton, A. (2005). The effect of peer collaboration on children’s problem-solving ability. British Journal of Educational Psychology, 75(2), 157–169. Felmer, P., & Perdomo-Dı́az, J. (2016). Novice Chilean second- ary mathematics teachers as problem solvers. In P. Felmer, E. Pehkonen, & J. Kilpatrick (Eds.), Posing and solving mathemati- cal problems, Research in Mathematics Education Series (pp. 287–308). Cham: Springer. Felmer, P., Perdomo-Dı́az, J., & Reyes, C. (2019). The ARPA experi- ence in Chile: Problem solving for teachers’ professional develop- ment. In Liljedahl, P., and Santos-Trigo, M. (Eds.) Mathematical problem solving. ICME-13 Monographs (pp. 311–337). Springer, Cham. Francisco, J. M. (2013). Learning in collaborative settings: Students building on each other’s ideas to promote their mathemati- cal understanding. Educational Studies in Mathematics, 82(3), 417–438. Gick, M. L. (1986). Problem-solving strategies. Educational Psycholo- gist, 21(1–2), 99–120. Heinze, A., Star, J., & Verschaffel, L. (2009). Flexible and adaptive use of strategies and representations in mathematics education. ZDM, 41, 535–540. Inmre, S., & Akkoç, H. (2012). Investigating the development of pro- spective mathematics teachers’ pedagogical content knowledge of generalising number patterns through school practicum. Journal of Mathematics Teacher Education, 15(3), 207–226.
  • 24. Jacob, R., Hill, H., & Corey, D. (2017). The impact of a professional development program on teachers’ mathematical knowledge for teaching, instruction, and student achievement. Journal of Research on Educational Effectiveness, 10(2), 379–407. Liljedahl, P. (2014). The affordances of using visually random groups in a mathematics classroom. In Y. Li, E. Silver, & S. Li (Eds.), Transforming mathematics instruction: Multiple approaches and practices (pp. 127–144). New York, NY: Springer. MINEDUC [Ministry of Education Republic of Chile] (2012). Bases Curriculares Matemática; Ficha Bases Curriculares 2012. http:// www.curriculumenlineamineduc.cl/605/w3-article-21321.html. National Agency of Quality of Education [Agencia de Calidad de la Educación] (2018). SIMCE. https://www.agenciaeducacion.cl/ evaluaciones/que-es-el-simce. National Research Council. (2011). Successful K-12 STEM education: Identifying effective approaches in science, technology, engineer- ing, and mathematics. National Academies Press. Nistal, A., Van Dooren, W., Clarebout, G., Elen, J., & Verschaffel, L. (2009). Conceptualising, investigating and stimulating represen- tational flexibility in mathematical problem solving and learning: a critical review. ZDM, 41(5), 627–636. OECD (2016). Low-performing students: Why they fall behind and how to help them succeed. PISA, OECD Publishing, Paris. doi: https://doi.org/10.1787/9789264250246-en. OECD. (2017). PISA 2015 Results (Volume V): Collaborative problem solving. PISA: OECD Publishing, Paris. Paas, F., & Sweller, J. (2012). An evolutionary upgrade of cognitive load theory: Using the human motor system and collaboration to support the learning of complex cognitive tasks. Educational Psychology Review, 24(1), 27–45. https://doi.org/10.1007/s1064 8-011-9179-2. Pijls, M., Dekker, R., & Van Hout-Wolters, B. (2007). Reconstruction of a collaborative mathematical learning process. Educational Studies in mathematics, 65(3), 309–329. Polotskaia, E., Savard, A., & Freiman, V. (2016). Investigating a case of hidden misinterpretations of an additive word problem: struc- tural substitution. European Journal of Psychology of Education, 31(2), 135–153. Polya, G. (1957). How to solve it. Princeton, NJ: Princeton University Press. Radovic, D., & Preiss, D. (2010). Discourse patterns observed in mid- dle-school level mathematics classes in Chile. Psykhe, 19, 65–79. Reynolds, D., & Muijs, D. (1999). The effective teaching of math- ematics: a review of research. School Leadership & Management, 19(3), 273–288. Saadati, F., & Reyes, C. (2019). Collaborative learning to improve problem-solving skills: A relation affecting through attitude toward mathematics. In Felmer, P., Liljedahl, P., and Koichu, B. (Eds.) Problem Solving in Mathematics Instruction and Teacher Professional Development. Research in Mathematics Education Series (pp. 187–202). Springer, Cham.
  • 25. Schoenfeld, A. H. (1982). Measures of problem-solving performance and of problem-solving instruction. Journal for Research in Math- ematics Education, 31–49. Sofroniou, A., & Poutos, K. (2016). Investigating the effectiveness of group work in mathematics. Education Sciences, 6(3), 30. SoucyMcCrone, S. (2005). The development of mathematical discus- sions: an investigation in a fifth-grade classroom. Mathematical Thinking and Learning, 7(2), 111–133. Stein, M., Engle, R., Smith, M., & Hughes, E. (2008). Orchestrating productive mathematical discussions: Five practices for helping teachers move beyond show and tell. Mathematical Thinking and Learning, 10(4), 313–340. Suydam, M. (1980). Untangling clues from research on problem solv- ing. Problem solving in school mathematics, 34– 50. Swan, M. (2006). Collaborative learning in mathematics: a challenge to our beliefs and practices. Leicester: National Institute of Adult Continuing Education. Tambunan, H. (2019). The effectiveness of the problem-solving strat- egy and the scientific approach to students’ mathematical capabili- ties in high order thinking skills. International Electronic Journal of Mathematics Education, 14(2), 293–302. TNTP. (2015). The mirage: Confronting the hard truth about our quest for teacher development. Brooklyn, NY: TNTP. Zazkis, R., & Liljedahl, P. (2002). Generalization of patterns: The ten- sion between algebraic thinking and algebraic notation. Educa- tional Studies in Mathematics, 49(3), 379–402. Publisher’s Note Springer Nature remains neutral with regard to jurisdictional claims in published maps and institutional affiliations.