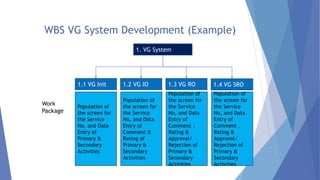
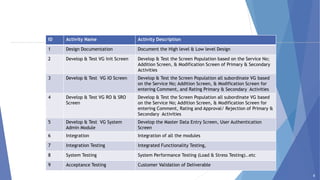
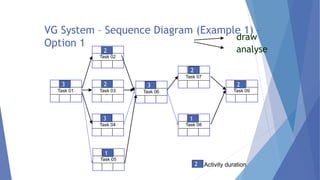
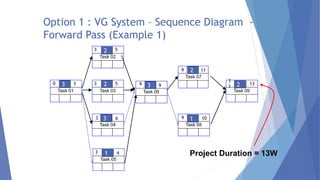
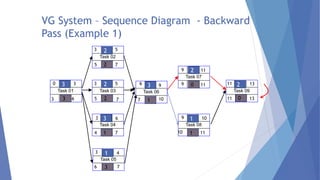
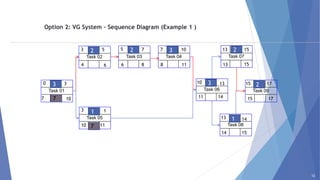
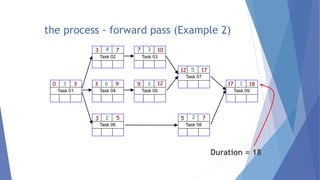
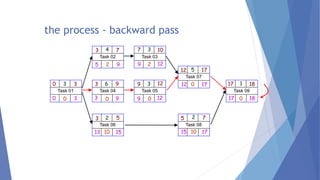
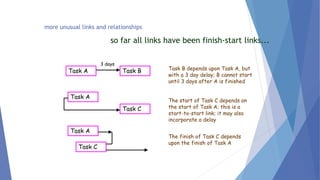
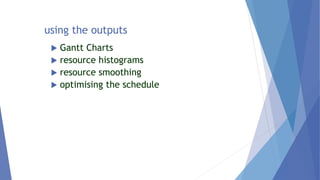
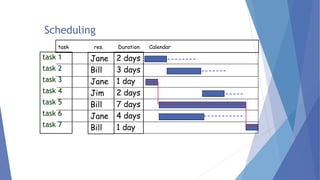
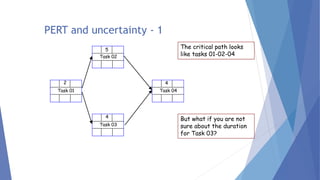
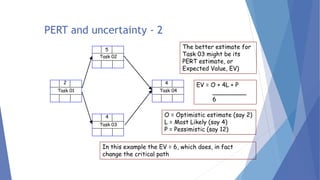
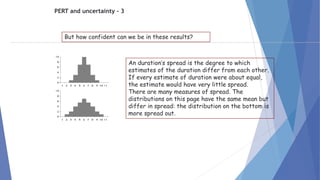
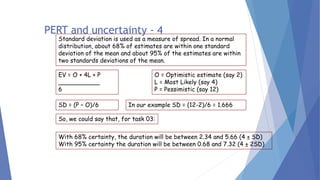
Assigment-1
Critical Path Analysis
Precedence Diagram Technique
Precedence Networks
Critical Path Analysis
Video Game (VG)
System Development
Example
6
WBS VG System Development (Example)
7
1. VG System
1.1 VG Init 1.2 VG IO 1.3 VG RO 1.4 VG SRO
Work
Package
Population of
the screen for
the Service
No, and Data
Entry of
Primary &
Secondary
Activities
Population of
the screen for
the Service
No, and Data
Entry of
Comment &
Rating of
Primary &
Secondary
Activities
Population of
the screen for
the Service
No, and Data
Entry of
Comment ,
Rating &
Approval/
Rejection of
Primary &
Secondary
Activities
Population of
the screen for
the Service
No, and Data
Entry of
Comment ,
Rating &
Approval/
Rejection of
Primary &
Secondary
Activities
Activity Listing VG System (Example)
ID Activity Name Activity Description
1 Design Documentation Document the High level & Low level Design
2 Develop & Test VG Init Screen Develop & Test the Screen Population based on the Service No;
Addition Screen, & Modification Screen of Primary & Secondary
Activities
3 Develop & Test VG IO Screen Develop & Test the Screen Population all subordinate VG based
on the Service No; Addition Screen, & Modification Screen for
entering Comment, and Rating Primary & Secondary Activities
4 Develop & Test VG RO & SRO
Screen
Develop & Test the Screen Population all subordinate VG based
on the Service No; Addition Screen, & Modification Screen for
entering Comment, Rating and Approval/ Rejection of Primary &
Secondary Activities
5 Develop & Test VG System
Admin Module
Develop the Master Data Entry Screen, User Authentication
Screen
6 Integration Integration of all the modules
7 Integration Testing Integrated Functionality Testing,
8 System Testing System Performance Testing (Load & Stress Testing)..etc
9 Acceptance Testing Customer Validation of Deliverable
8
VG System – Sequence Diagram (Example 1) –
Option 1
draw
analyse
Task 01
3
Task 02
2
Task 03
2
Task 04
3
Task 05
1
Task 06
3
Task 07
2
Task 08
1
Task 09
2
2 Activity duration
Option 1 : VG System – Sequence Diagram -
Forward Pass (Example 1)
Task 01
3
Task 02
2
Task 03
2
Task 04
3
Task 05
1
Task 06
3
Task 07
2
Task 08
1
Task 09
2
0 3
3 5
6
5
3
3
3
6
4
9
9
9
11
1
1
10
13
Project Duration = 13W
VG System – Sequence Diagram - Backward
Pass (Example 1)
Task 01
3
Task 02
2
Task 03
2
Task 04
3
Task 05
1
Task 06
3
Task 07
2
Task 08
1
Task 09
2
0 3
3 5
6
5
3
3
3
6
4
9
9
9
11
11
10
13
13
11 0
11
11
9
10
0
10
7
7
7
7
7
6
4
5
5
6
3
1
1
2
2
1
3
3
Option 2: VG System – Sequence Diagram (Example 1 )
12
Task 01
3
Task 02
2
Task 03
2
Task 04
3
Task 05
1
Task 06
3
Task 07
2
Task 08
1
Task 09
2
0 3
3
3
5 5 7 7 10
10 13
13
13
15
15
14
17
17
15
15
15
14
13
14
11
11
11
10
10
8
8
6
6
4
7 7
7
1
Example 2
13
the process - forward pass (Example 2)
Duration = 18
Task 06
2
Task 01
3 3
0
3
Task 04
6
3 9
Task 03
3 10
7
5
Task 08
2 7
5
Task 02
4
3 7
Task 09
1 18
17
Task 05
3
9 12
Task 07
5
12 17
the process - backward pass
Task 06
2
3 5
13 15
10
Task 09
1 18
17
18
17 0
Task 07
5
12 17
17
12 0
Task 05
3
9 12
12
9 0
Task 04
6
3 9
9
3 0
Task 01
3 3
0
3
0 0
Task 08
2 7
5
17
15 10
Task 03
3 10
7
12
9 2
Task 02
4
3 7
9
5 2
more unusual links and relationships
so far all links have been finish-start links...
Task A Task B
Task A
Task C
Task C
Task A
Task B depends upon Task A, but
with a 3 day delay; B cannot start
until 3 days after A is finished
The finish of Task C depends
upon the finish of Task A
The start of Task C depends on
the start of Task A; this is a
start-to-start link; it may also
incorporate a delay
3 days
using the outputs
 Gantt Charts
 resource histograms
 resource smoothing
 optimising the schedule
Scheduling
task 1
task 2
task 3
task 4
task 5
task 6
task 7
task res. Duration Calendar
2 days
3 days
1 day
2 days
7 days
4 days
1 day
Jane
Bill
Jane
Jim
Bill
Jane
Bill
PERT and uncertainty - 1
Task 01
Task 02
Task 03
Task 04
4
2
5
4
The critical path looks
like tasks 01-02-04
But what if you are not
sure about the duration
for Task 03?
PERT and uncertainty - 2
Task 01
Task 02
Task 03
Task 04
4
2
5
4
The better estimate for
Task 03 might be its
PERT estimate, or
Expected Value, EV)
EV = O + 4L + P
_________
6
O = Optimistic estimate (say 2)
L = Most Likely (say 4)
P = Pessimistic (say 12)
In this example the EV = 6, which does, in fact
change the critical path
PERT and uncertainty - 3
But how confident can we be in these results?
An duration’s spread is the degree to which
estimates of the duration differ from each other.
If every estimate of duration were about equal,
the estimate would have very little spread.
There are many measures of spread. The
distributions on this page have the same mean but
differ in spread: the distribution on the bottom is
more spread out.
PERT and uncertainty - 4
Standard deviation is used as a measure of spread. In a normal
distribution, about 68% of estimates are within one standard
deviation of the mean and about 95% of the estimates are within
two standards deviations of the mean.
EV = O + 4L + P
___________
6
O = Optimistic estimate (say 2)
L = Most Likely (say 4)
P = Pessimistic (say 12)
SD = (P – O)/6 In our example SD = (12-2)/6 = 1.666
So, we could say that, for task 03:
With 68% certainty, the duration will be between 2.34 and 5.66 (4 ± SD)
With 95% certainty the duration will be between 0.68 and 7.32 (4 ± 2SD)

Ass-1_Critical Path Analysis.pptx

  • 1.
    Assigment-1 Critical Path Analysis PrecedenceDiagram Technique Precedence Networks Critical Path Analysis
  • 2.
    Video Game (VG) SystemDevelopment Example 6
  • 3.
    WBS VG SystemDevelopment (Example) 7 1. VG System 1.1 VG Init 1.2 VG IO 1.3 VG RO 1.4 VG SRO Work Package Population of the screen for the Service No, and Data Entry of Primary & Secondary Activities Population of the screen for the Service No, and Data Entry of Comment & Rating of Primary & Secondary Activities Population of the screen for the Service No, and Data Entry of Comment , Rating & Approval/ Rejection of Primary & Secondary Activities Population of the screen for the Service No, and Data Entry of Comment , Rating & Approval/ Rejection of Primary & Secondary Activities
  • 4.
    Activity Listing VGSystem (Example) ID Activity Name Activity Description 1 Design Documentation Document the High level & Low level Design 2 Develop & Test VG Init Screen Develop & Test the Screen Population based on the Service No; Addition Screen, & Modification Screen of Primary & Secondary Activities 3 Develop & Test VG IO Screen Develop & Test the Screen Population all subordinate VG based on the Service No; Addition Screen, & Modification Screen for entering Comment, and Rating Primary & Secondary Activities 4 Develop & Test VG RO & SRO Screen Develop & Test the Screen Population all subordinate VG based on the Service No; Addition Screen, & Modification Screen for entering Comment, Rating and Approval/ Rejection of Primary & Secondary Activities 5 Develop & Test VG System Admin Module Develop the Master Data Entry Screen, User Authentication Screen 6 Integration Integration of all the modules 7 Integration Testing Integrated Functionality Testing, 8 System Testing System Performance Testing (Load & Stress Testing)..etc 9 Acceptance Testing Customer Validation of Deliverable 8
  • 5.
    VG System –Sequence Diagram (Example 1) – Option 1 draw analyse Task 01 3 Task 02 2 Task 03 2 Task 04 3 Task 05 1 Task 06 3 Task 07 2 Task 08 1 Task 09 2 2 Activity duration
  • 6.
    Option 1 :VG System – Sequence Diagram - Forward Pass (Example 1) Task 01 3 Task 02 2 Task 03 2 Task 04 3 Task 05 1 Task 06 3 Task 07 2 Task 08 1 Task 09 2 0 3 3 5 6 5 3 3 3 6 4 9 9 9 11 1 1 10 13 Project Duration = 13W
  • 7.
    VG System –Sequence Diagram - Backward Pass (Example 1) Task 01 3 Task 02 2 Task 03 2 Task 04 3 Task 05 1 Task 06 3 Task 07 2 Task 08 1 Task 09 2 0 3 3 5 6 5 3 3 3 6 4 9 9 9 11 11 10 13 13 11 0 11 11 9 10 0 10 7 7 7 7 7 6 4 5 5 6 3 1 1 2 2 1 3 3
  • 8.
    Option 2: VGSystem – Sequence Diagram (Example 1 ) 12 Task 01 3 Task 02 2 Task 03 2 Task 04 3 Task 05 1 Task 06 3 Task 07 2 Task 08 1 Task 09 2 0 3 3 3 5 5 7 7 10 10 13 13 13 15 15 14 17 17 15 15 15 14 13 14 11 11 11 10 10 8 8 6 6 4 7 7 7 1
  • 9.
  • 10.
    the process -forward pass (Example 2) Duration = 18 Task 06 2 Task 01 3 3 0 3 Task 04 6 3 9 Task 03 3 10 7 5 Task 08 2 7 5 Task 02 4 3 7 Task 09 1 18 17 Task 05 3 9 12 Task 07 5 12 17
  • 11.
    the process -backward pass Task 06 2 3 5 13 15 10 Task 09 1 18 17 18 17 0 Task 07 5 12 17 17 12 0 Task 05 3 9 12 12 9 0 Task 04 6 3 9 9 3 0 Task 01 3 3 0 3 0 0 Task 08 2 7 5 17 15 10 Task 03 3 10 7 12 9 2 Task 02 4 3 7 9 5 2
  • 12.
    more unusual linksand relationships so far all links have been finish-start links... Task A Task B Task A Task C Task C Task A Task B depends upon Task A, but with a 3 day delay; B cannot start until 3 days after A is finished The finish of Task C depends upon the finish of Task A The start of Task C depends on the start of Task A; this is a start-to-start link; it may also incorporate a delay 3 days
  • 13.
    using the outputs Gantt Charts  resource histograms  resource smoothing  optimising the schedule
  • 14.
    Scheduling task 1 task 2 task3 task 4 task 5 task 6 task 7 task res. Duration Calendar 2 days 3 days 1 day 2 days 7 days 4 days 1 day Jane Bill Jane Jim Bill Jane Bill
  • 15.
    PERT and uncertainty- 1 Task 01 Task 02 Task 03 Task 04 4 2 5 4 The critical path looks like tasks 01-02-04 But what if you are not sure about the duration for Task 03?
  • 16.
    PERT and uncertainty- 2 Task 01 Task 02 Task 03 Task 04 4 2 5 4 The better estimate for Task 03 might be its PERT estimate, or Expected Value, EV) EV = O + 4L + P _________ 6 O = Optimistic estimate (say 2) L = Most Likely (say 4) P = Pessimistic (say 12) In this example the EV = 6, which does, in fact change the critical path
  • 17.
    PERT and uncertainty- 3 But how confident can we be in these results? An duration’s spread is the degree to which estimates of the duration differ from each other. If every estimate of duration were about equal, the estimate would have very little spread. There are many measures of spread. The distributions on this page have the same mean but differ in spread: the distribution on the bottom is more spread out.
  • 18.
    PERT and uncertainty- 4 Standard deviation is used as a measure of spread. In a normal distribution, about 68% of estimates are within one standard deviation of the mean and about 95% of the estimates are within two standards deviations of the mean. EV = O + 4L + P ___________ 6 O = Optimistic estimate (say 2) L = Most Likely (say 4) P = Pessimistic (say 12) SD = (P – O)/6 In our example SD = (12-2)/6 = 1.666 So, we could say that, for task 03: With 68% certainty, the duration will be between 2.34 and 5.66 (4 ± SD) With 95% certainty the duration will be between 0.68 and 7.32 (4 ± 2SD)

Editor's Notes

  • #2  HO3512 ver 01 Page 1
  • #3  HO3512 ver 01 Page 2
  • #4  HO3512 ver 01 Page 3
  • #5  HO3512 ver 01 Page 4
  • #10  HO3512 ver 01 Page 9
  • #11  HO3512 ver 01 Page 10
  • #12  HO3512 ver 01 Page 11
  • #15  HO3512 ver 01 Page 14
  • #16  HO3512 ver 01 Page 15
  • #17  HO3512 ver 01 Page 16
  • #18  HO3512 ver 01 Page 17
  • #19  HO3512 ver 01 Page 18
  • #20  HO3512 ver 01 Page 19
  • #21  HO3512 ver 01 Page 20
  • #22  HO3512 ver 01 Page 21
  • #23  HO3512 ver 01 Page 22