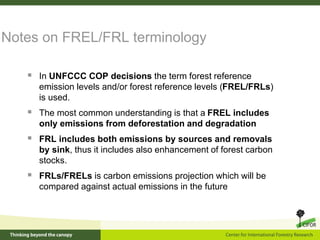
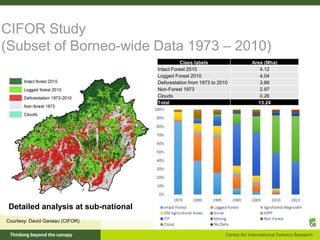
Research on REDD+ MRV and carbon
stocks/emissions measurement
University British of Columbia Students Visit
4 May 2015
Arief Wijaya
Forest and Environment Research
Center for International Forestry Research
CIFOR Global Comparative Study on REDD+
 GCS Module 3: REDD+ MRV and Carbon Emissions
measurement
– Assessment of major deforestation drivers
– Research on carbon stocks and emissions
– Setting forest reference emission levels (FRELs/FRLs)
– Participatory MRV
– Six case study countries: Brazil, Peru, Indonesia,
Vietnam, Zambia and Cameroon
 Further information: www.cifor.org/gcs/
Climate change – the evidence of what’s happening
Temperatures are rising worldwide
GHG emissions accelerate despite reduction
efforts
Capacity gaps of non-annexes I countries
Consideration of factors for capacity assessment:
1.Requirements for monitoring forest carbon on national level (IPCC GPG)
2.Existing national capacities for national forest monitoring
3.Progress in national GHG inventory and engagement in REDD
4.REDD particular characteristics: importance of forest fires, soil carbon, deforestation rate
5.Specific technical challenges (remote sensing)
Notes on FREL/FRL terminology
 In UNFCCC COP decisions the term forest reference
emission levels and/or forest reference levels (FREL/FRLs)
is used.
 The most common understanding is that a FREL includes
only emissions from deforestation and degradation
 FRL includes both emissions by sources and removals
by sink, thus it includes also enhancement of forest carbon
stocks.
 FRLs/FRELs is carbon emissions projection which will be
compared against actual emissions in the future
FREL/FRL terminology
National FREL submission document used the combined estimates
Impacts to REDD+ incentives
 Emissions reductions that can claim for REDD+ financial incentives
should be additional of those resulted from national climate change
mitigation program (i.e. based on self financed/national efforts)
– Differentiate between REL as business as usual (BAU) and crediting baseline
(or financial incentive benchmark)
Source: redd-net.org
Indicative national REL estimate to 2020
(Indonesia)
Source: Indonesian REDD+ Agency, MRV working group
Stepwise approach of FRELs/FRLs
(Herold, et.al, 2011)
Land Use Types Following Forest Conversion
1990-2000
What about drivers of forest degradation?
CO2 Emissions from Deforestation, Peat
Drainage and Peat Fires in Indonesia
Contributions of CO2 Emissions by Islands
Four Decades of Forests
Persistence, clearance and
logging in Borneo
(1973-2010)
Source: Gaveau, et.al (2014)
76% of forest cover (1973) 46% of forest cover (2010)
http://gislab.cifor.cgiar.org/wm/borneo/
Extend period of
observation
CIFOR Study
(Subset of Borneo-wide Data 1973 – 2010)
Class labels Area (Mha)
Intact Forest 2010 4.12
Logged Forest 2010 4.04
Deforestation from 1973 to 2010 3.86
Non-Forest 1973 2.97
Clouds 0.26
Total 15.24
Courtesy: David Gaveau (CIFOR)
Detailed analysis at sub-national
Research on REDD+ MRV and carbon stocks/emissions measurement

Research on REDD+ MRV and carbon stocks/emissions measurement

  • 1.
    Research on REDD+MRV and carbon stocks/emissions measurement University British of Columbia Students Visit 4 May 2015 Arief Wijaya Forest and Environment Research Center for International Forestry Research
  • 2.
    CIFOR Global ComparativeStudy on REDD+  GCS Module 3: REDD+ MRV and Carbon Emissions measurement – Assessment of major deforestation drivers – Research on carbon stocks and emissions – Setting forest reference emission levels (FRELs/FRLs) – Participatory MRV – Six case study countries: Brazil, Peru, Indonesia, Vietnam, Zambia and Cameroon  Further information: www.cifor.org/gcs/
  • 3.
    Climate change –the evidence of what’s happening
  • 4.
  • 5.
    GHG emissions acceleratedespite reduction efforts
  • 6.
    Capacity gaps ofnon-annexes I countries Consideration of factors for capacity assessment: 1.Requirements for monitoring forest carbon on national level (IPCC GPG) 2.Existing national capacities for national forest monitoring 3.Progress in national GHG inventory and engagement in REDD 4.REDD particular characteristics: importance of forest fires, soil carbon, deforestation rate 5.Specific technical challenges (remote sensing)
  • 7.
    Notes on FREL/FRLterminology  In UNFCCC COP decisions the term forest reference emission levels and/or forest reference levels (FREL/FRLs) is used.  The most common understanding is that a FREL includes only emissions from deforestation and degradation  FRL includes both emissions by sources and removals by sink, thus it includes also enhancement of forest carbon stocks.  FRLs/FRELs is carbon emissions projection which will be compared against actual emissions in the future
  • 8.
    FREL/FRL terminology National FRELsubmission document used the combined estimates
  • 9.
    Impacts to REDD+incentives  Emissions reductions that can claim for REDD+ financial incentives should be additional of those resulted from national climate change mitigation program (i.e. based on self financed/national efforts) – Differentiate between REL as business as usual (BAU) and crediting baseline (or financial incentive benchmark) Source: redd-net.org
  • 10.
    Indicative national RELestimate to 2020 (Indonesia) Source: Indonesian REDD+ Agency, MRV working group
  • 11.
    Stepwise approach ofFRELs/FRLs (Herold, et.al, 2011)
  • 12.
    Land Use TypesFollowing Forest Conversion 1990-2000 What about drivers of forest degradation?
  • 13.
    CO2 Emissions fromDeforestation, Peat Drainage and Peat Fires in Indonesia
  • 14.
    Contributions of CO2Emissions by Islands
  • 15.
    Four Decades ofForests Persistence, clearance and logging in Borneo (1973-2010) Source: Gaveau, et.al (2014) 76% of forest cover (1973) 46% of forest cover (2010) http://gislab.cifor.cgiar.org/wm/borneo/ Extend period of observation
  • 16.
    CIFOR Study (Subset ofBorneo-wide Data 1973 – 2010) Class labels Area (Mha) Intact Forest 2010 4.12 Logged Forest 2010 4.04 Deforestation from 1973 to 2010 3.86 Non-Forest 1973 2.97 Clouds 0.26 Total 15.24 Courtesy: David Gaveau (CIFOR) Detailed analysis at sub-national

Editor's Notes

  • #3 REDD+ Policies examines how REDD+ is unfolding in the national policy arena. REDD+ Subnational Initiatives examines how REDD+ projects can be designed and implemented so that their outcomes are effective, efficient and equitable and they deliver co‑benefits. Measuring Carbon Emissions looks for ways to enable better carbon accounting so that emission reductions can be reliably measured and verified. Mitigation–Adaptation Synergies looks for ways to exploit the synergies between REDD+ and climate change adaptation, to ensure that REDD+ has an impact beyond mitigation and is sustainable in a changing climate. REDD+ Benefit Sharing aims to provide policy options and guidance for the design, development and implementation of REDD+ benefit‑sharing mechanisms
  • #7 Keep the capacity gap analysis short (delete slides 6-8) ... key message, many countries do not have the data nor capacities to develop good RELs at this point Assessment category: National engagement (understanding of UNFCCC negotiations and REDD process, understanding of IPCC guidelines for reporting) Existing monitoring capacity (forest area change monitoring capacity, carbon stocks assessment) REDD challenges Remote sensing technical challenges