Downloaded 15 times

![Approaches to historical Forest Degradation
• Zambia has not yet addressed this issue
because an appropriate methodology [for dry
forest (Miombo)] has not been identified](https://image.slidesharecdn.com/zambiasforestreferenceemissionlevelfortheunfccc-151215084448/85/Zambia-s-forest-reference-emission-level-for-the-unfccc-30-320.jpg)

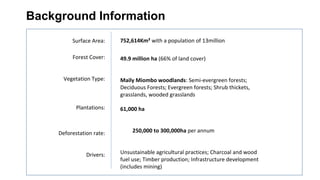
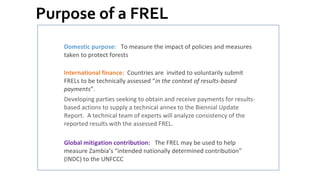
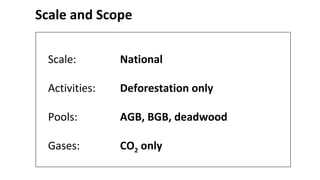
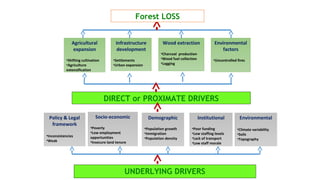
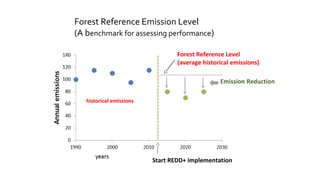
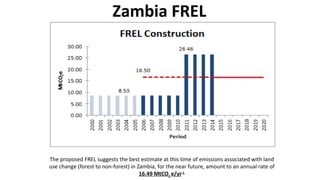
Zambia presented its Forest Reference Emission Level (FRL) to the UNFCCC, outlining the country's deforestation rates and drivers, which include unsustainable agricultural practices and infrastructure development. The FRL aims to measure the impact of forest protection policies and facilitate international finance for results-based actions. Key challenges include data collection, capacity for monitoring changes, and addressing historical forest degradation.


