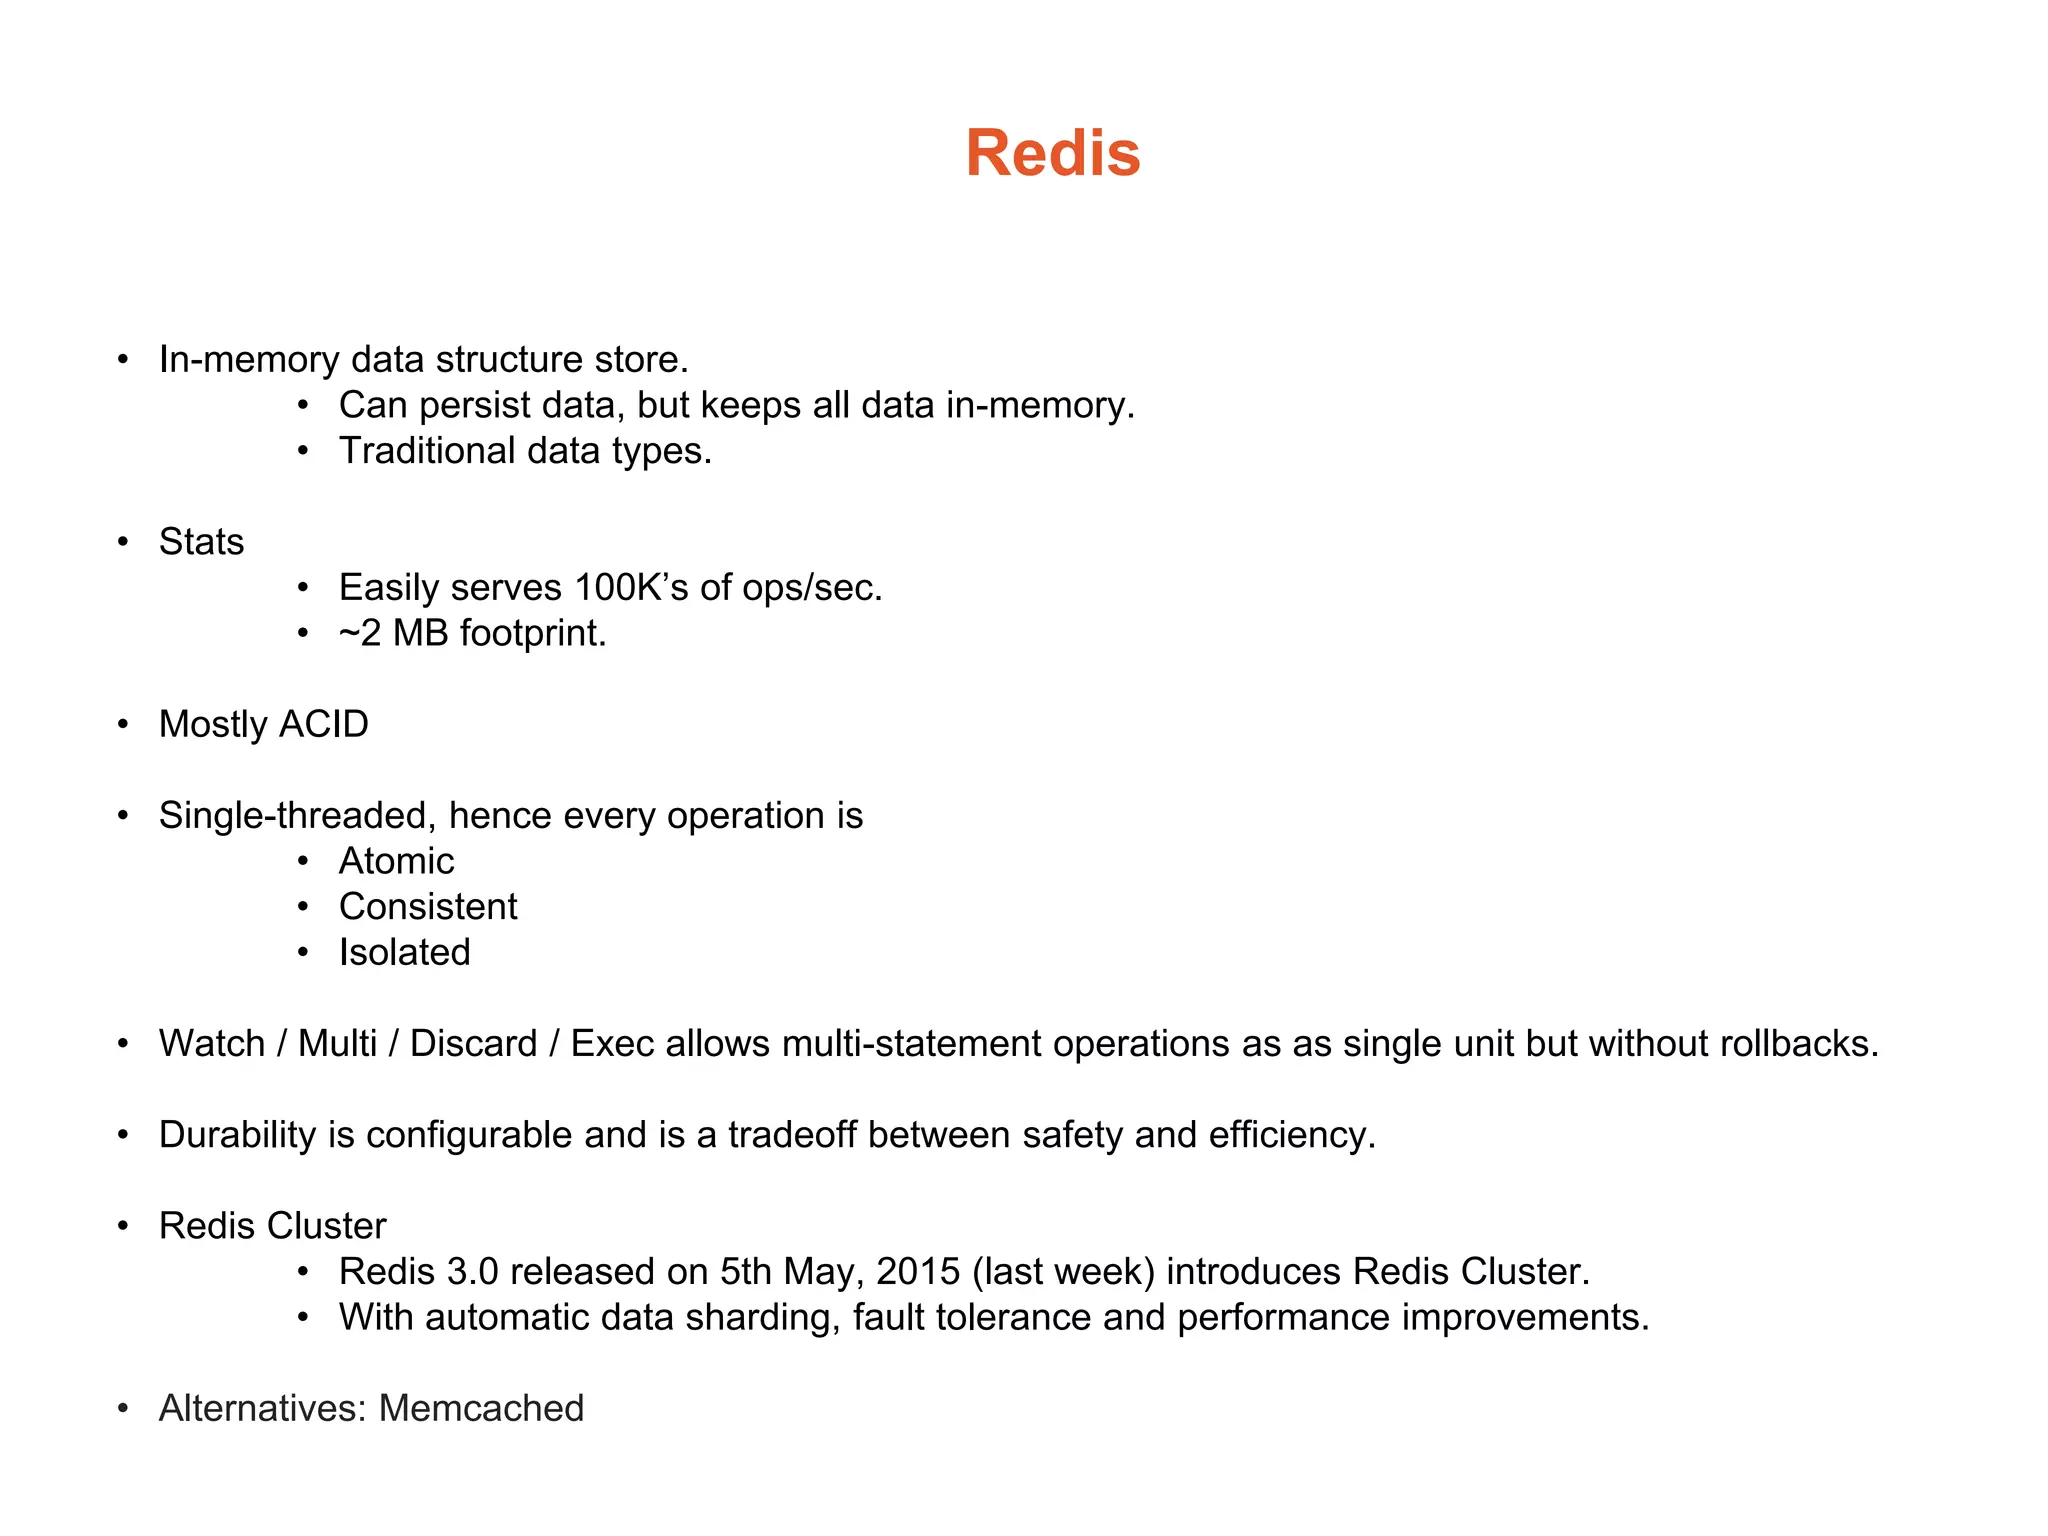
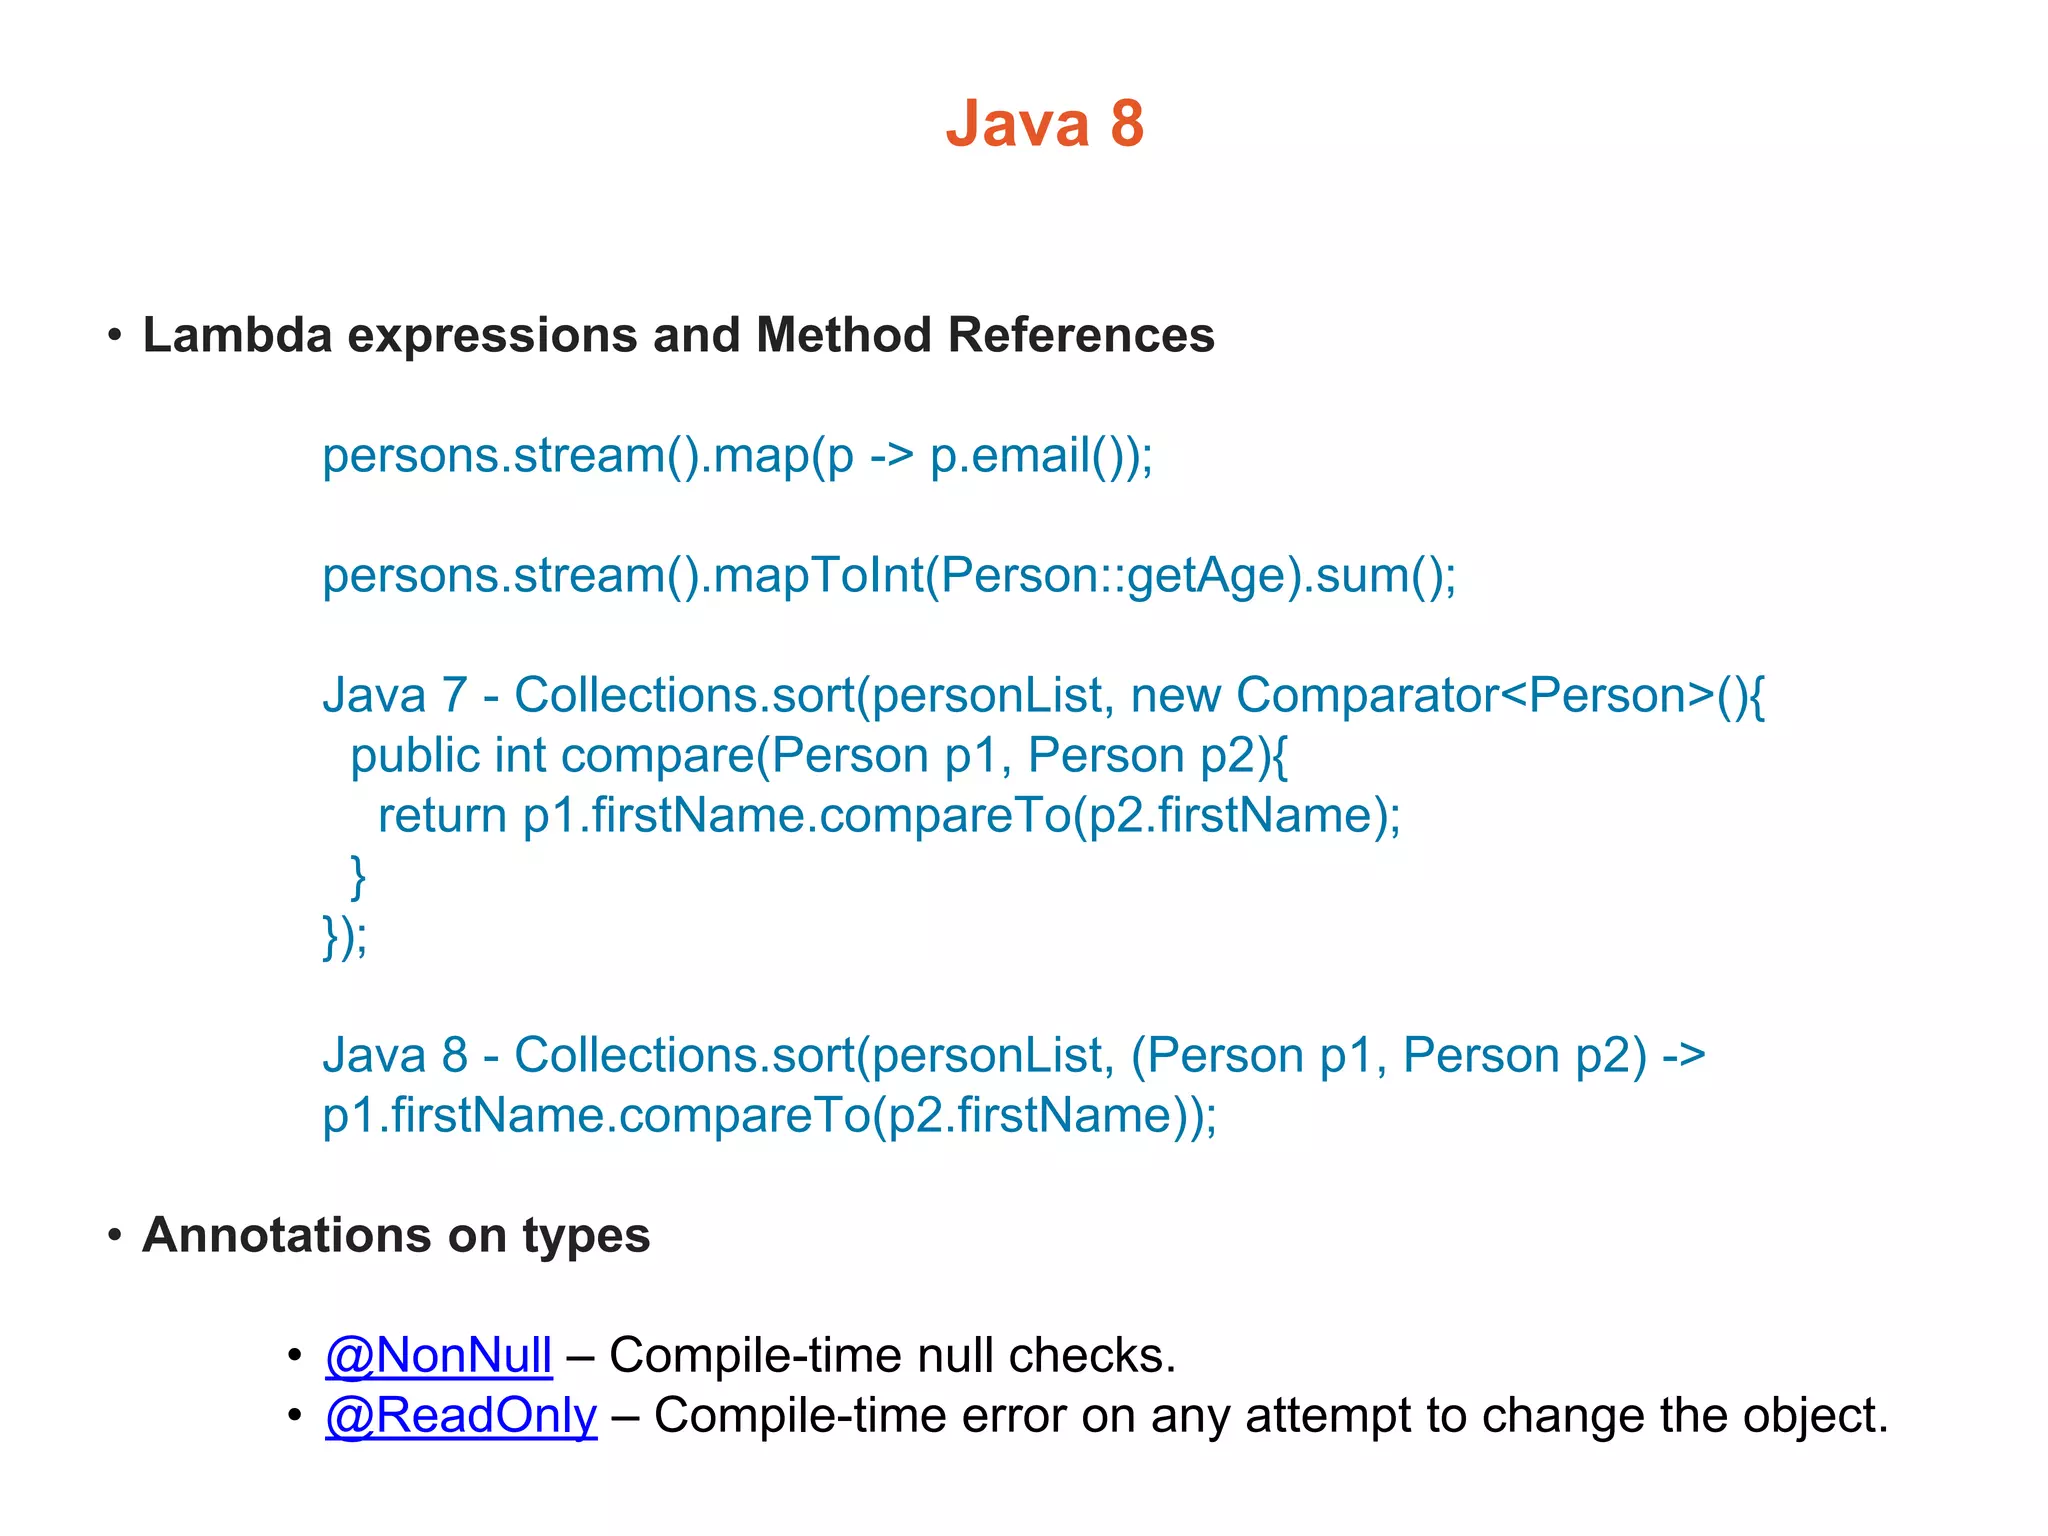
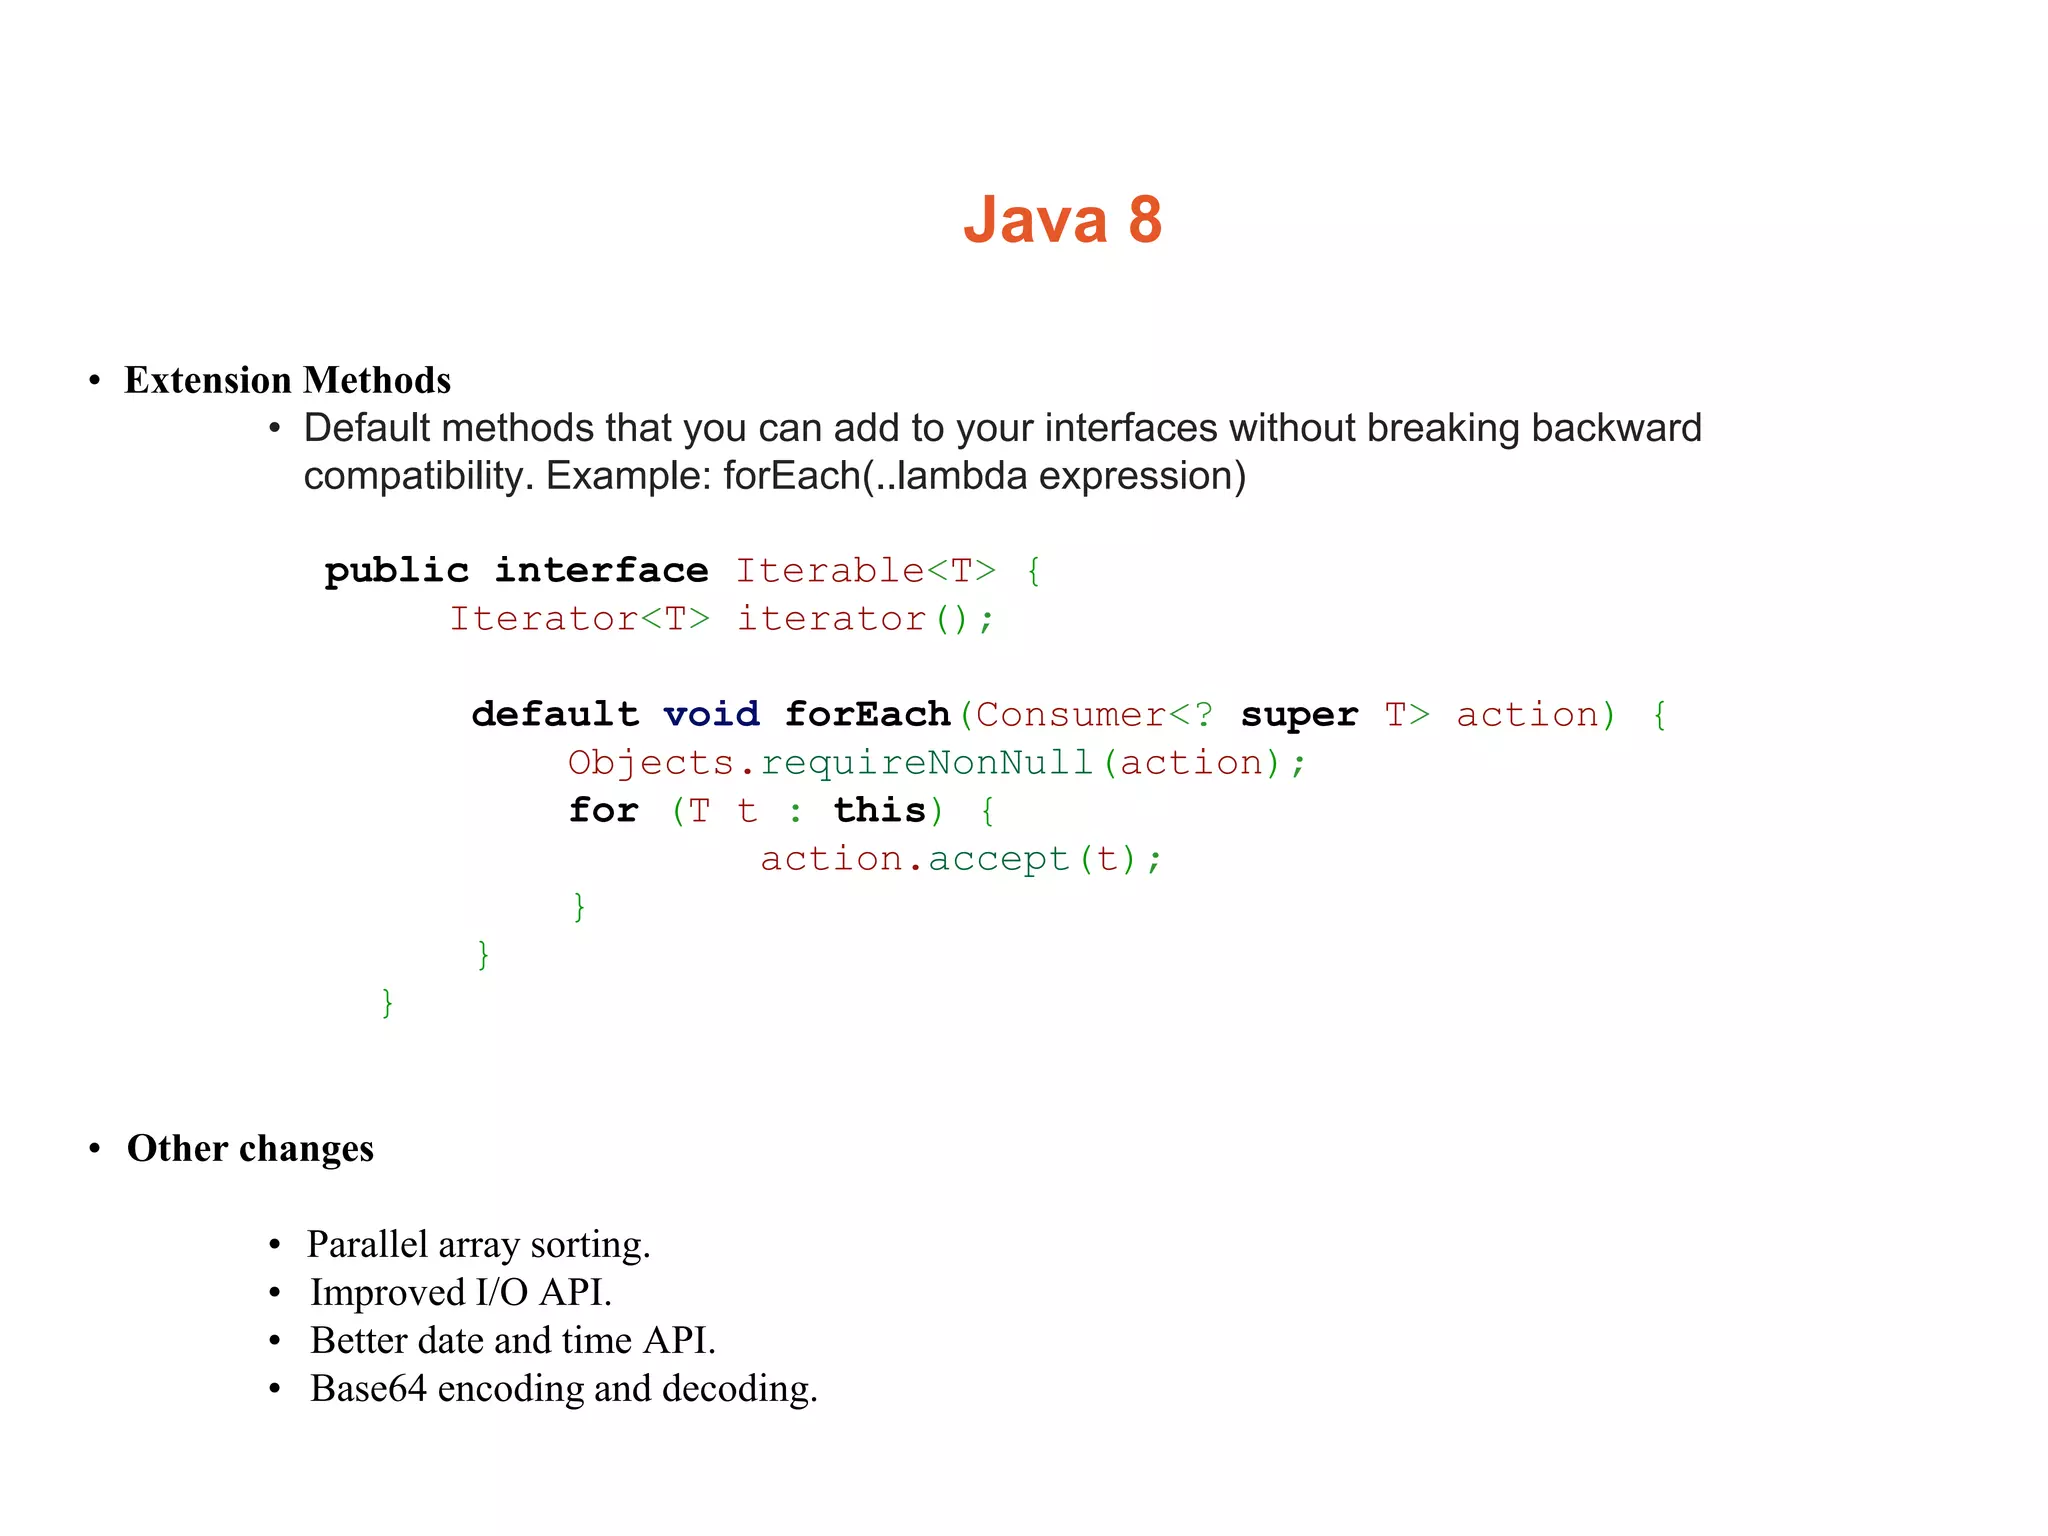
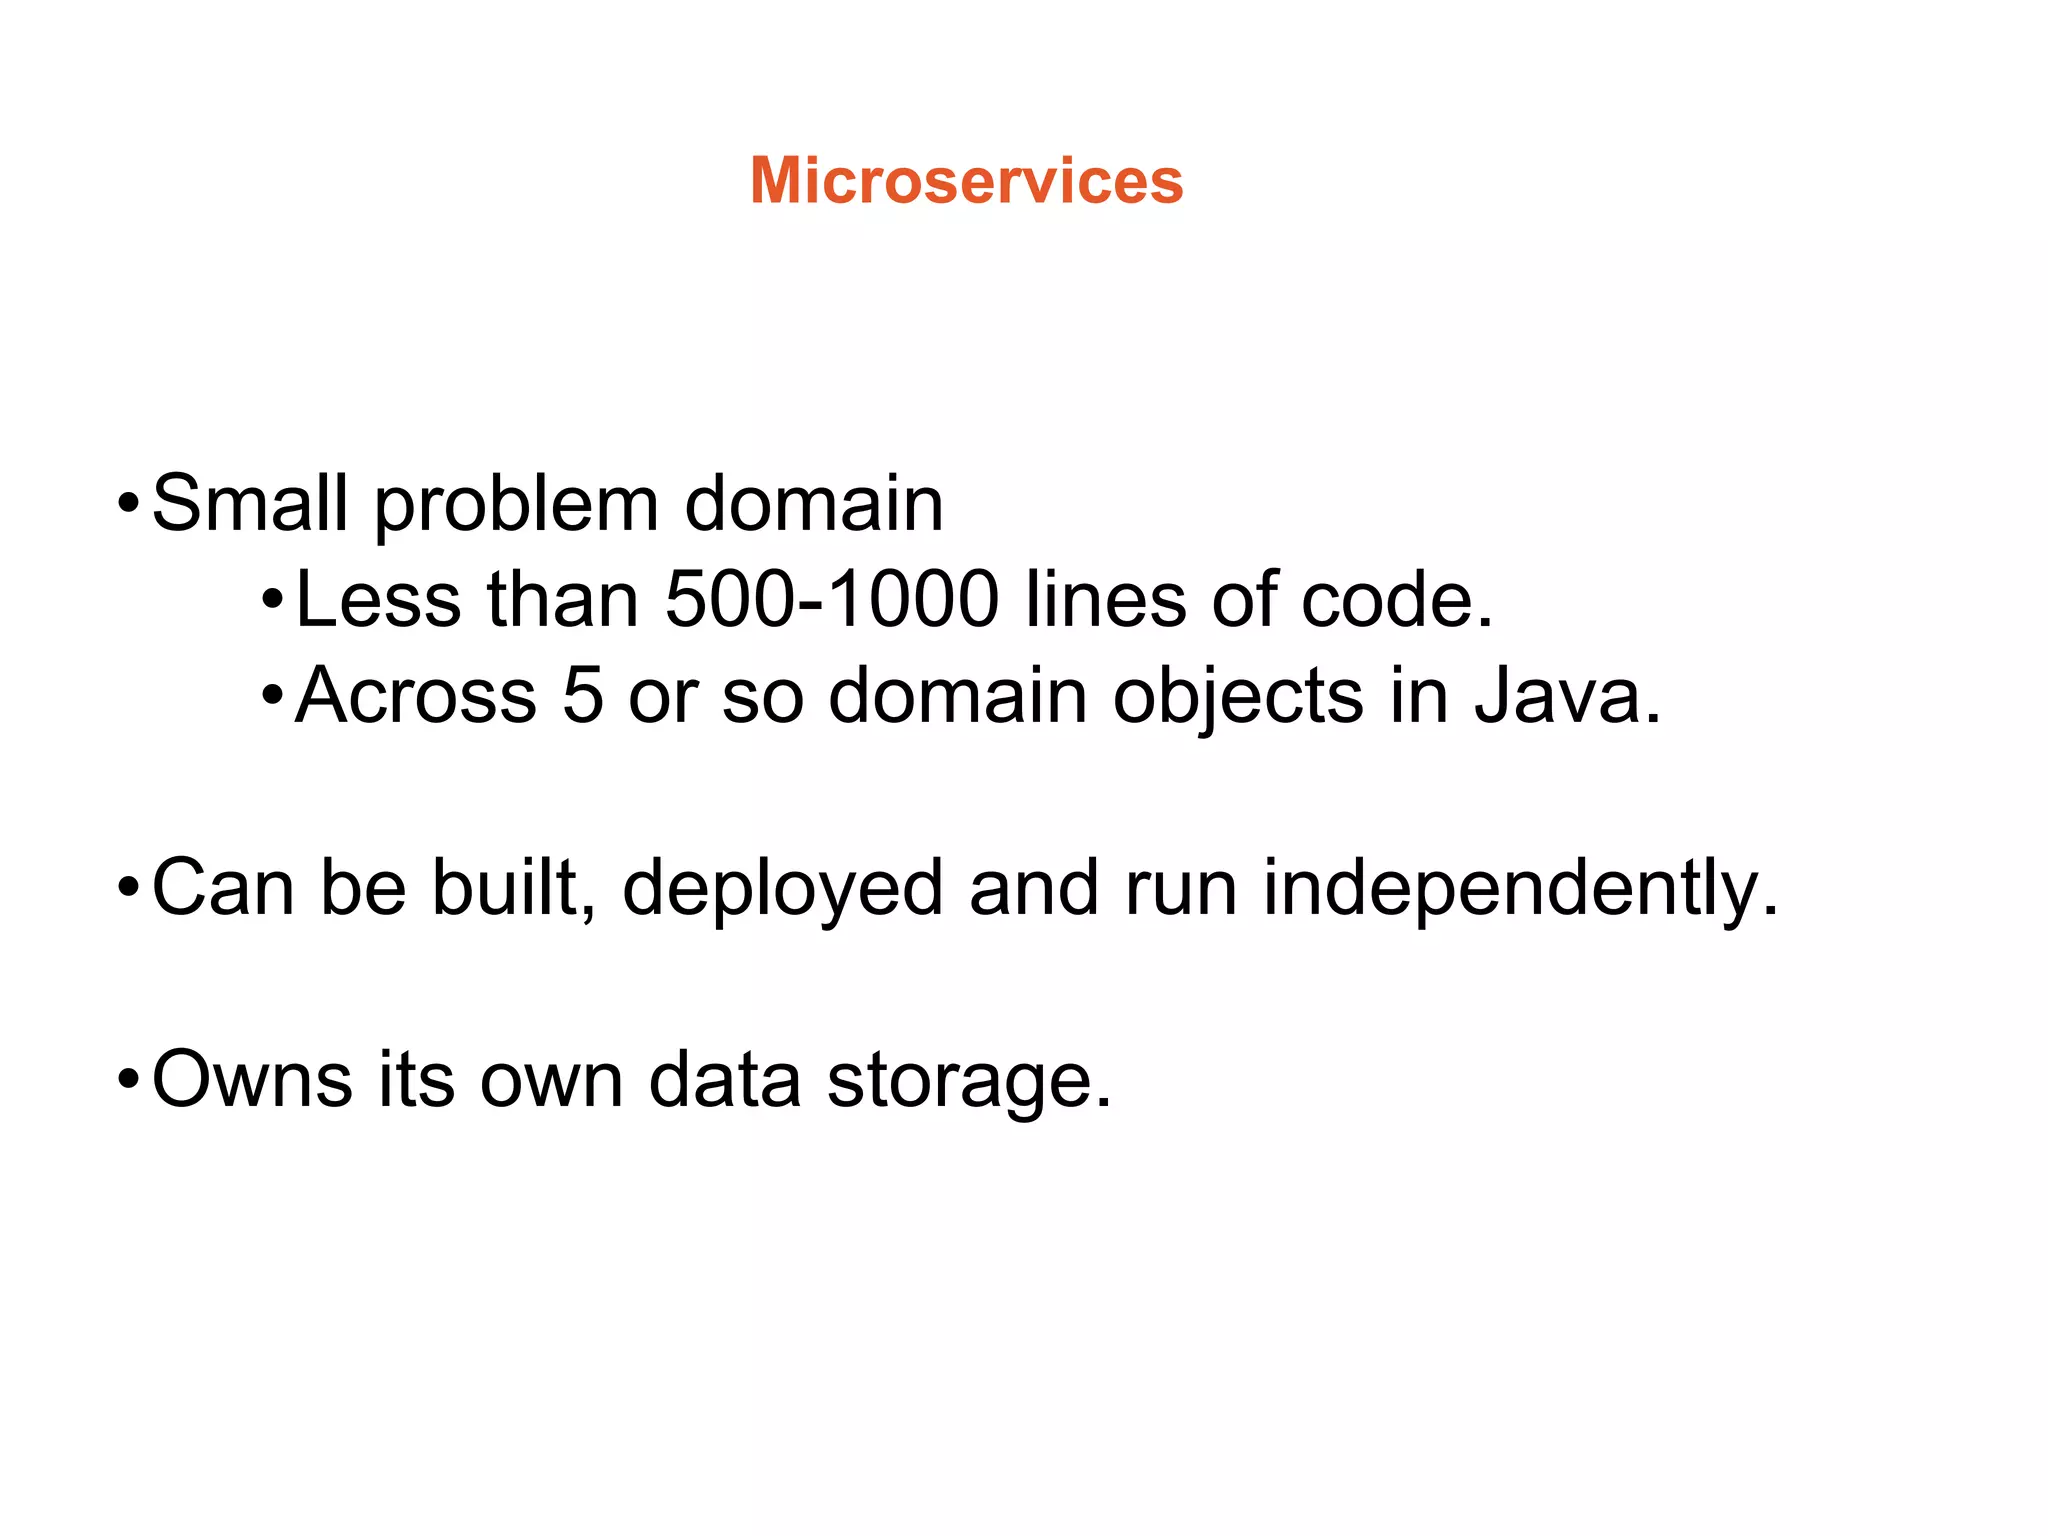
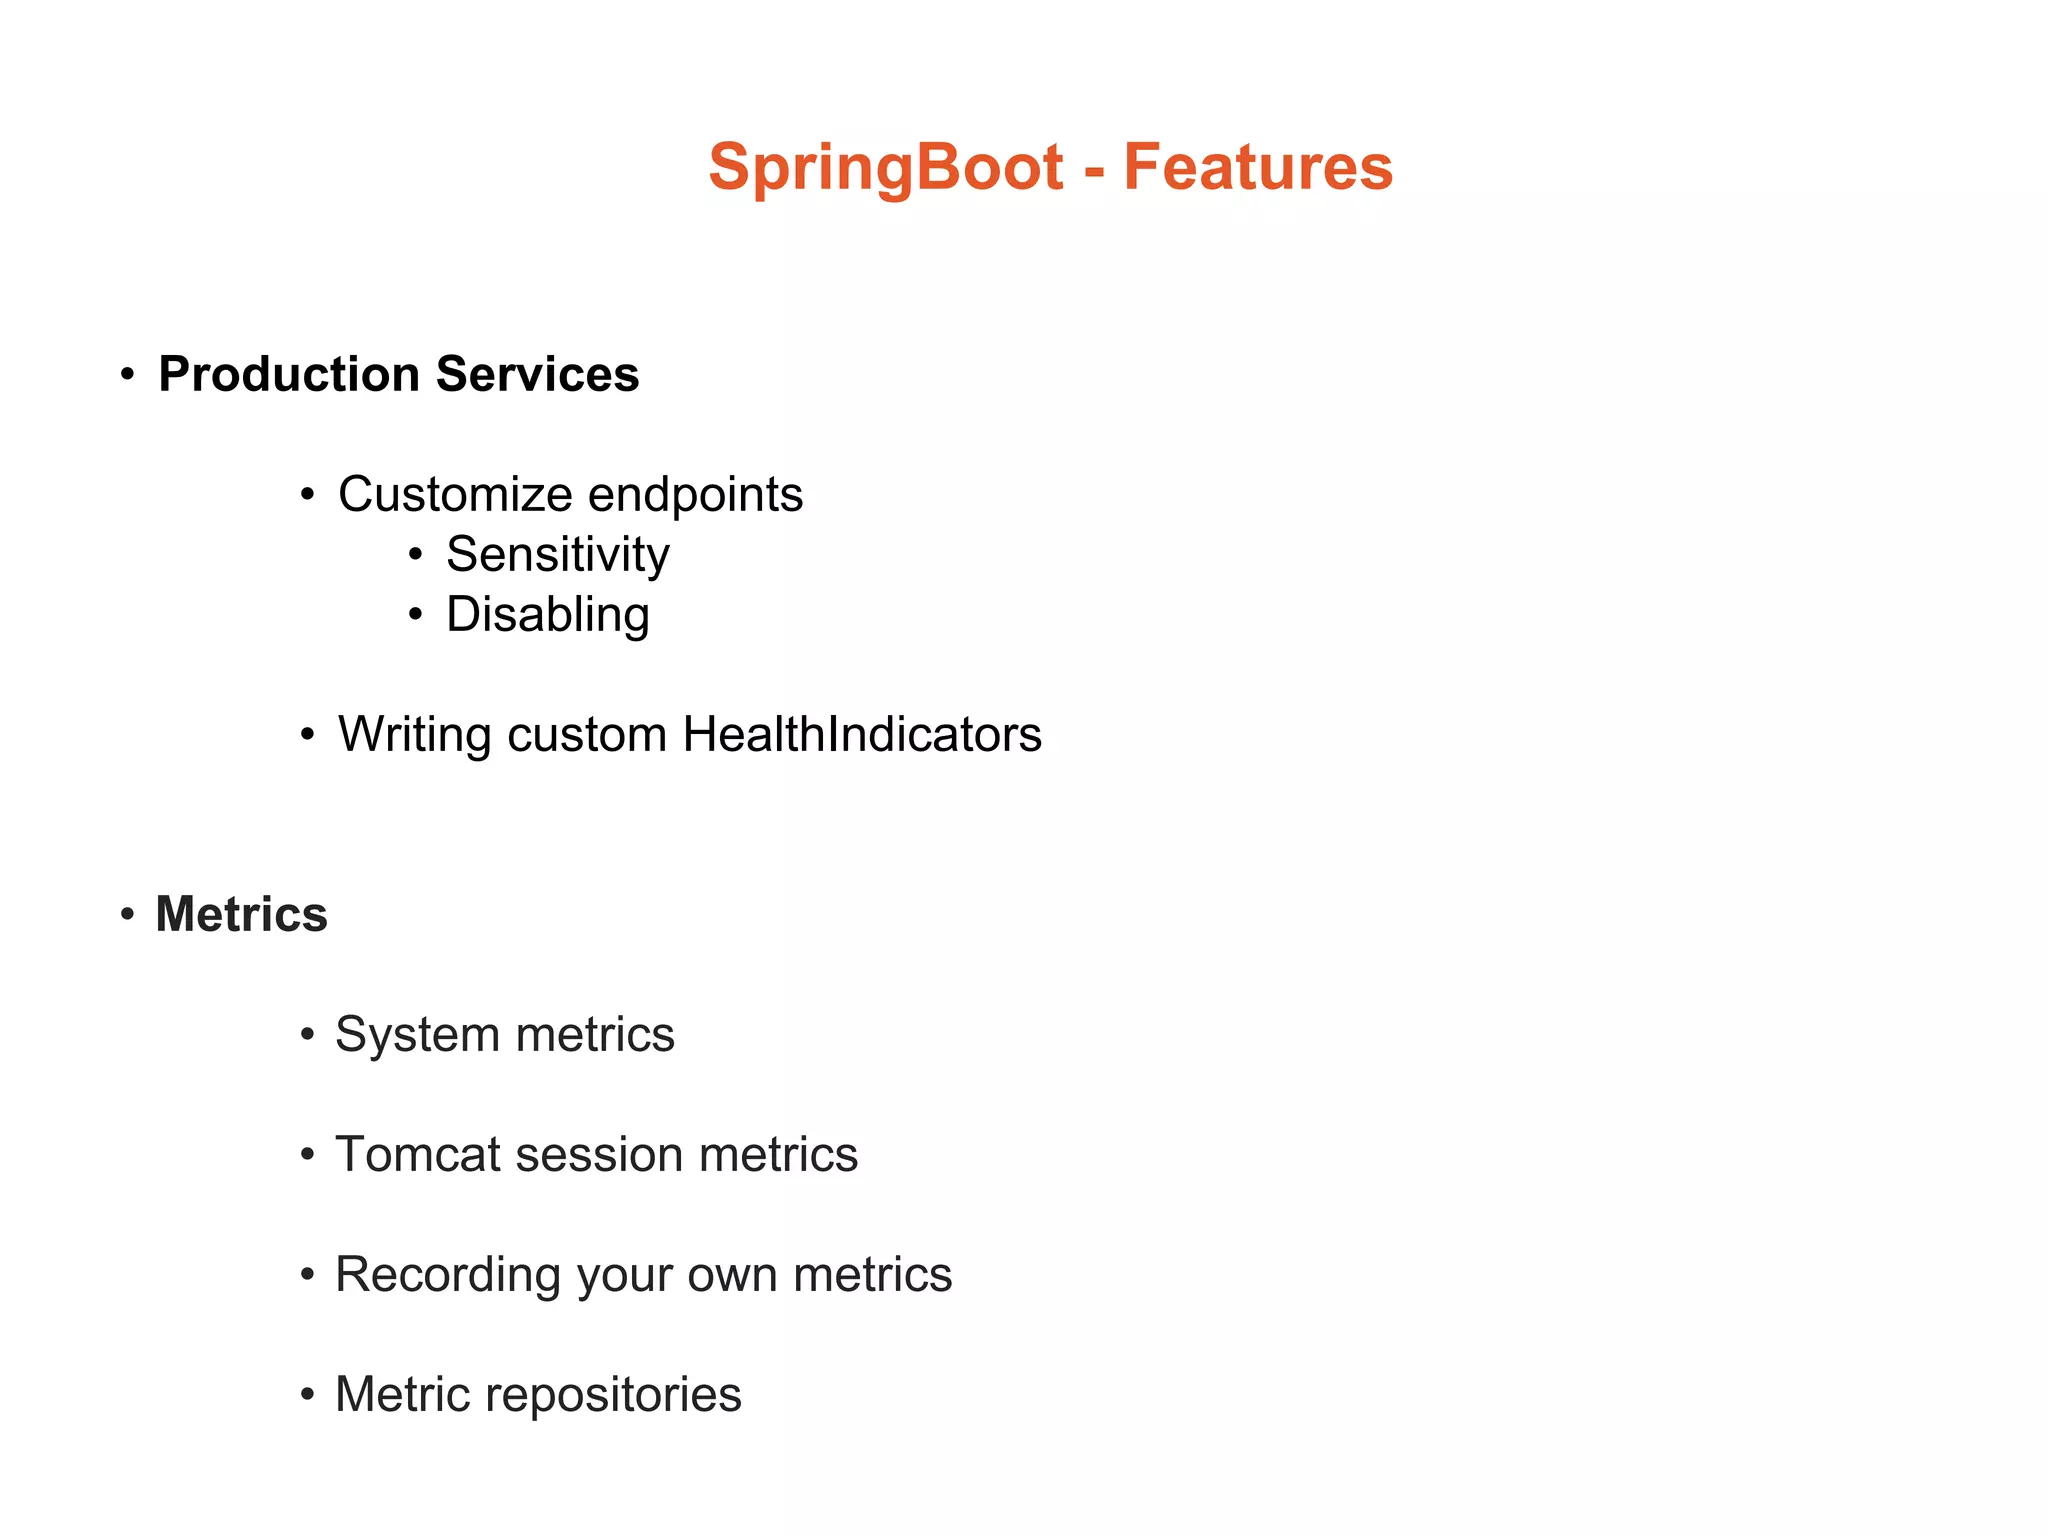
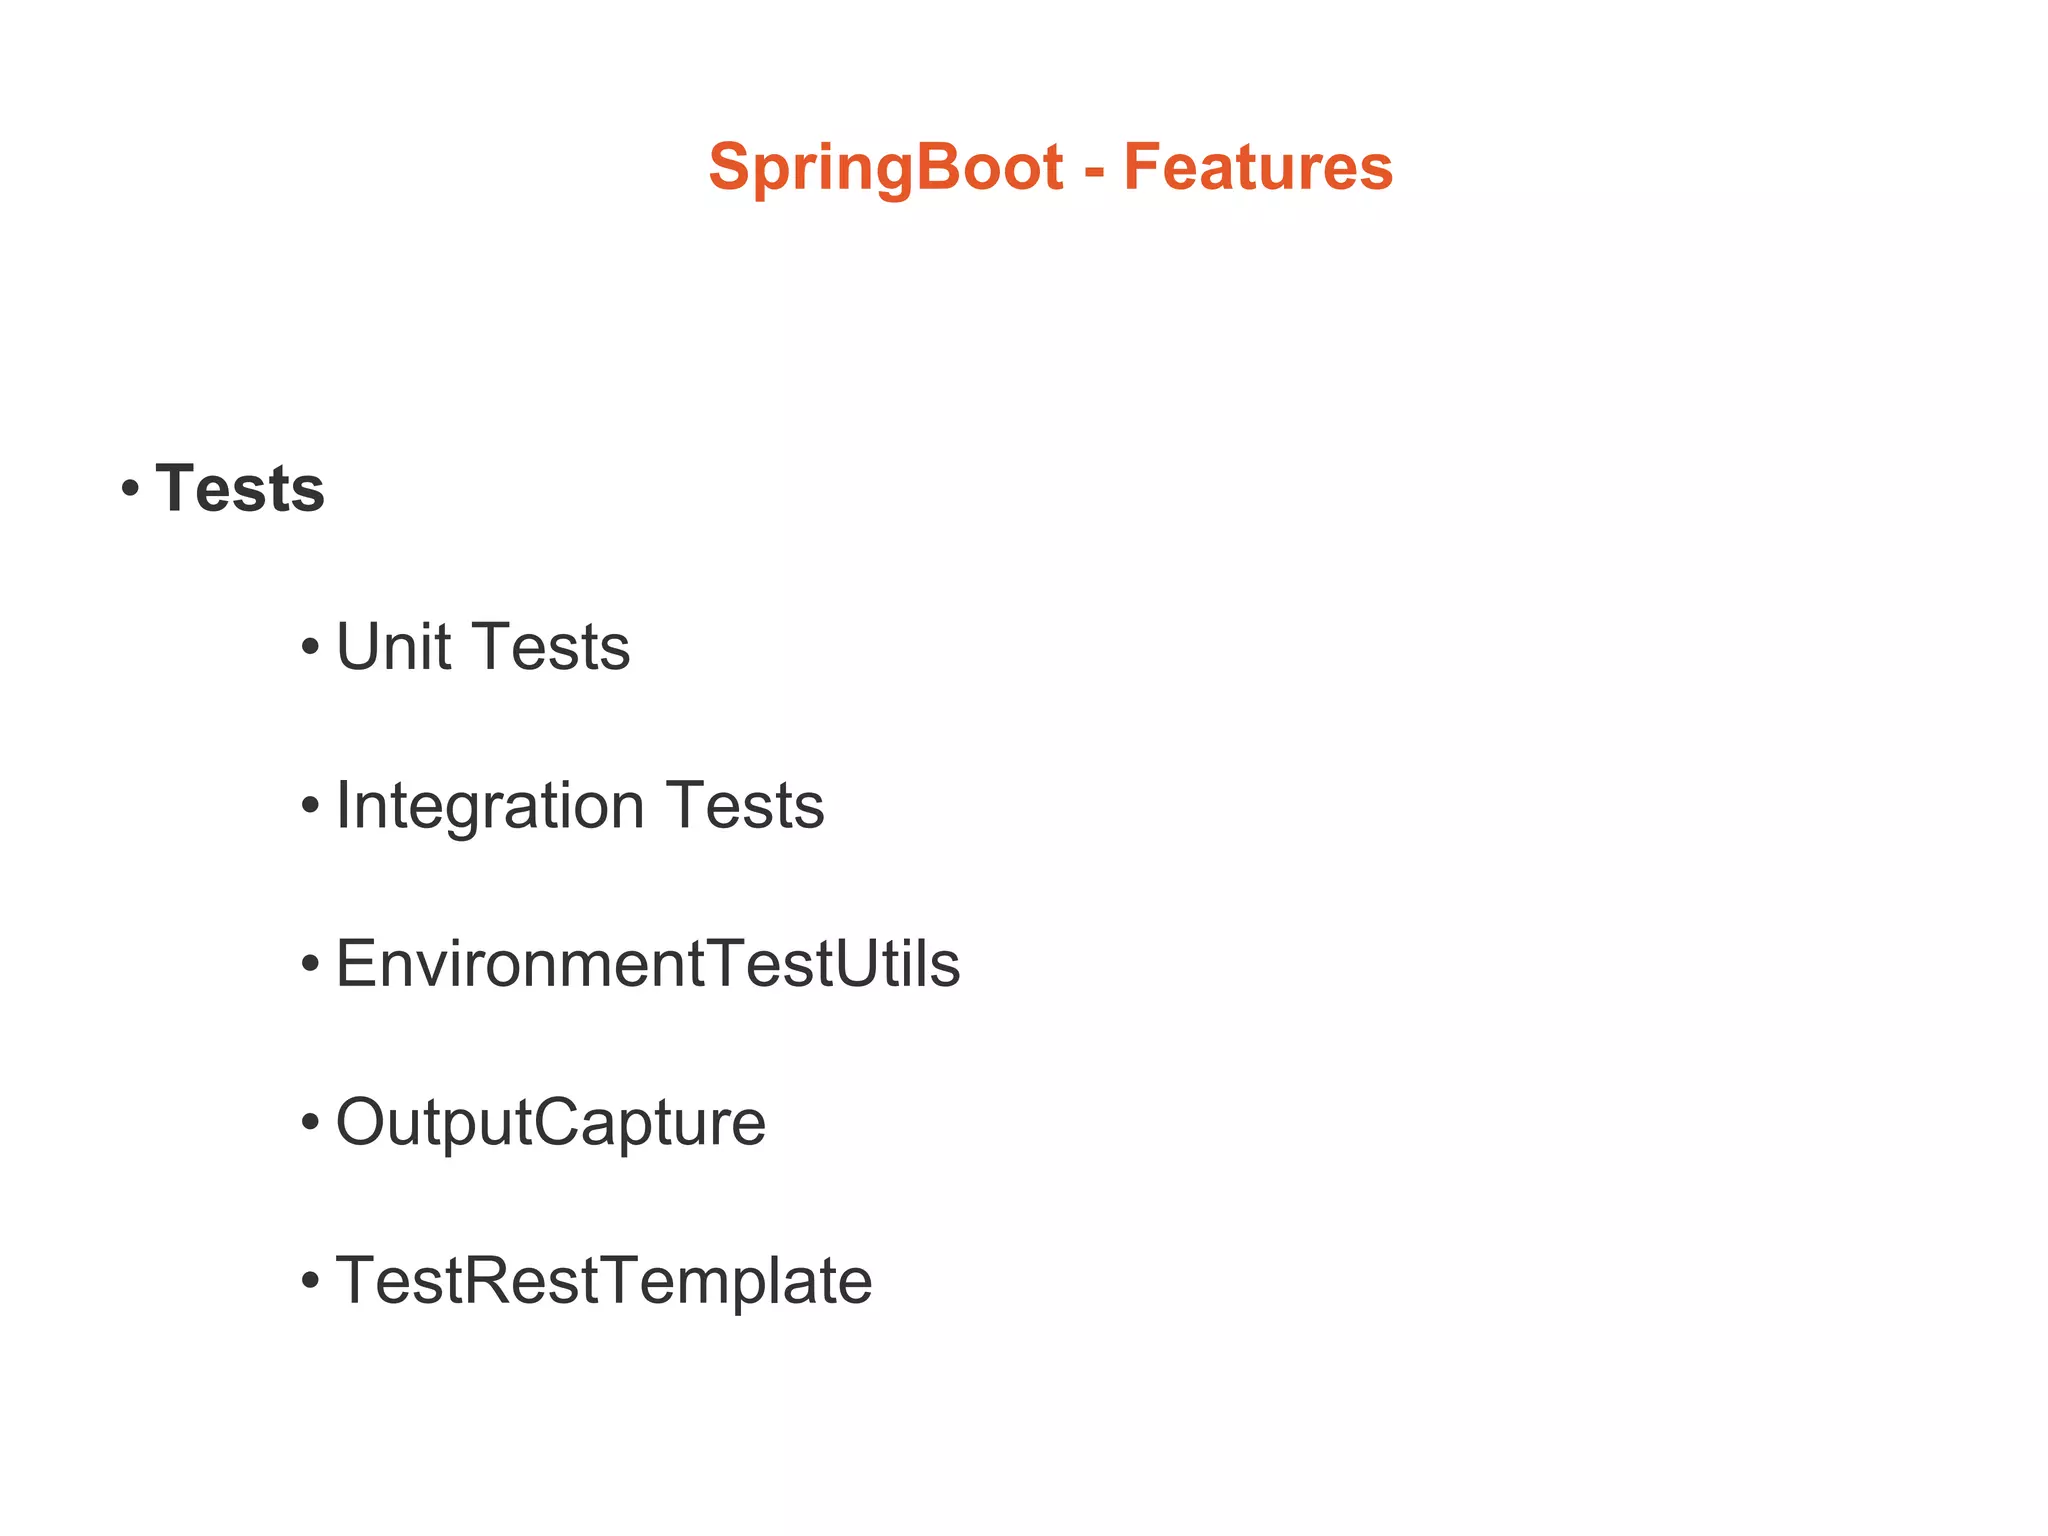
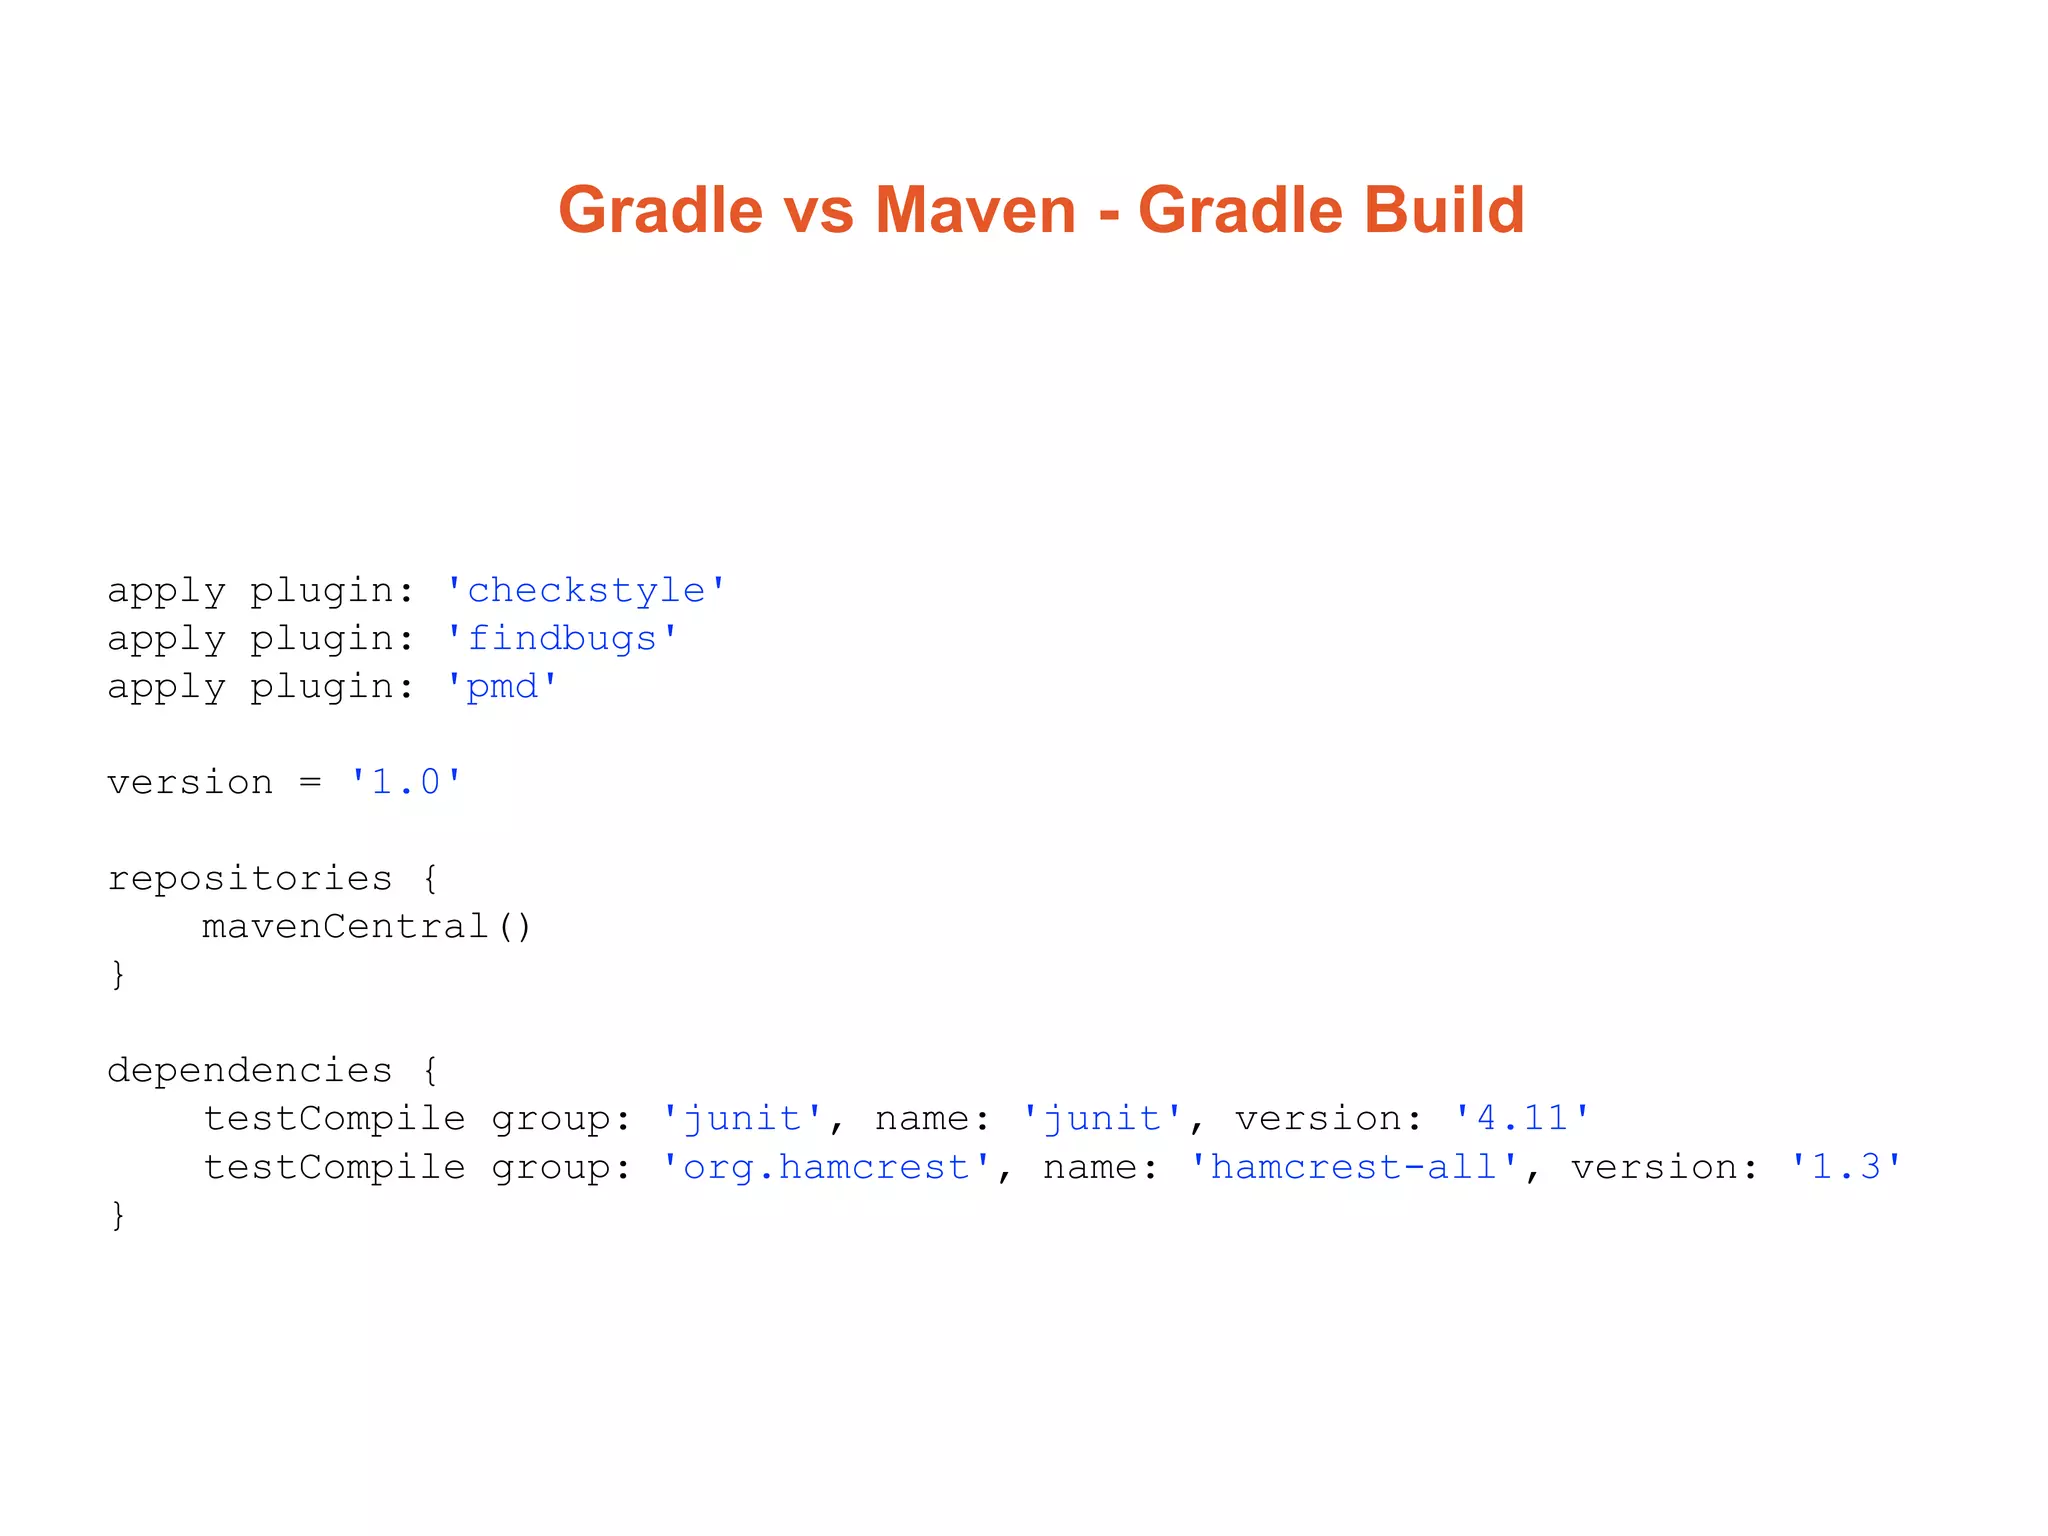
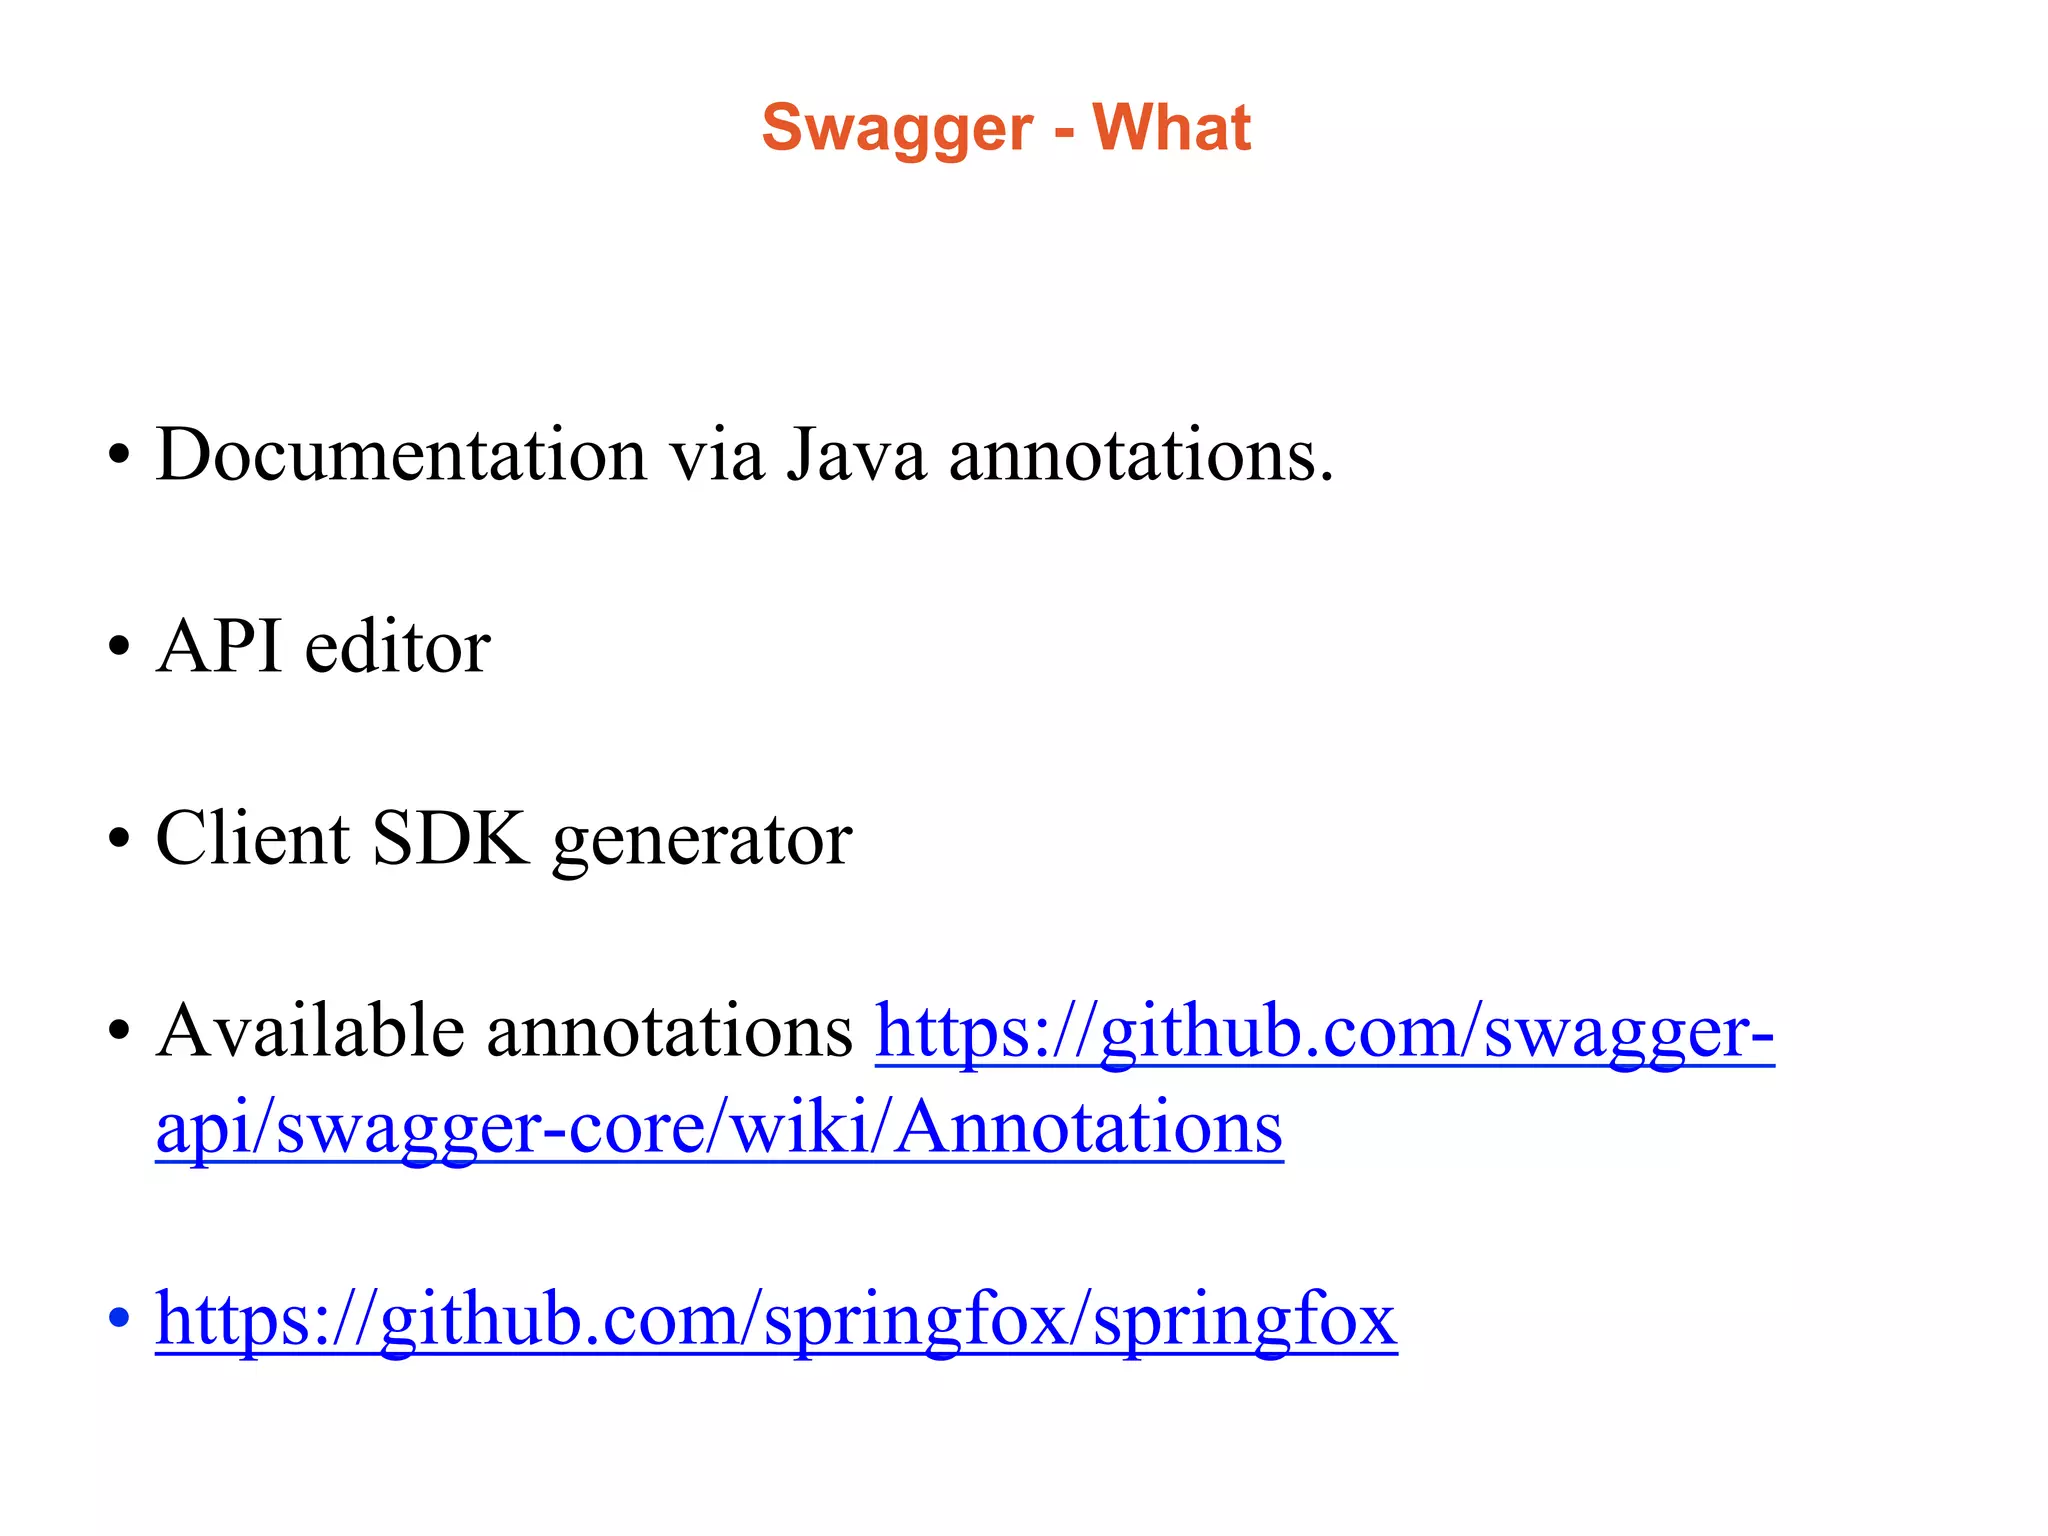
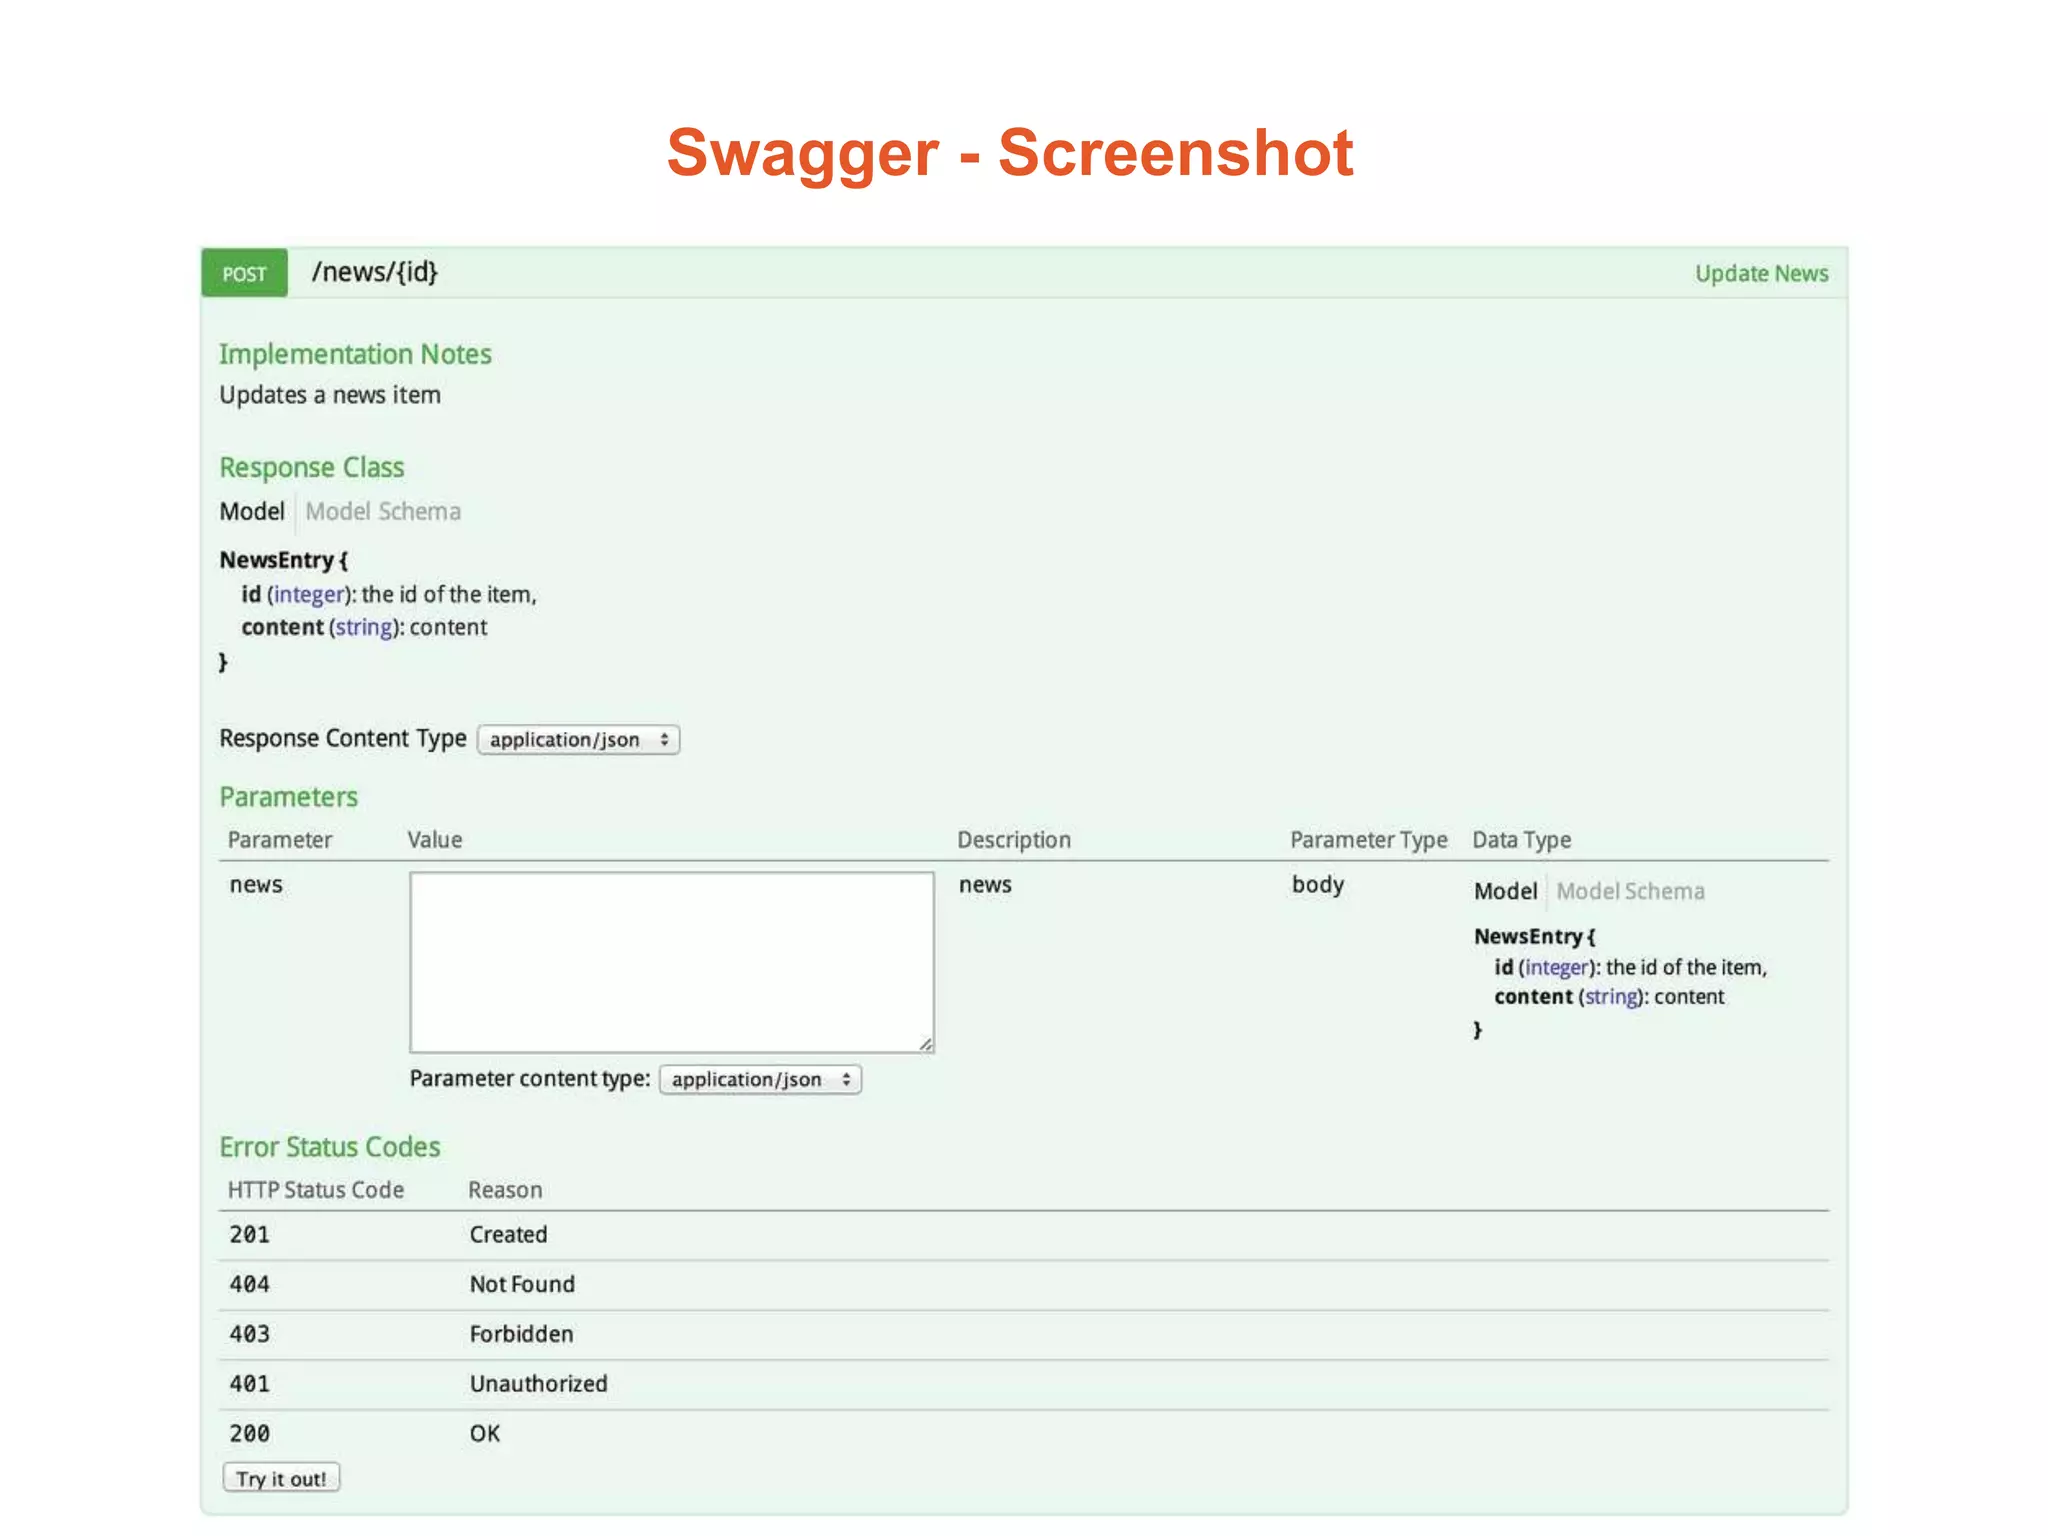
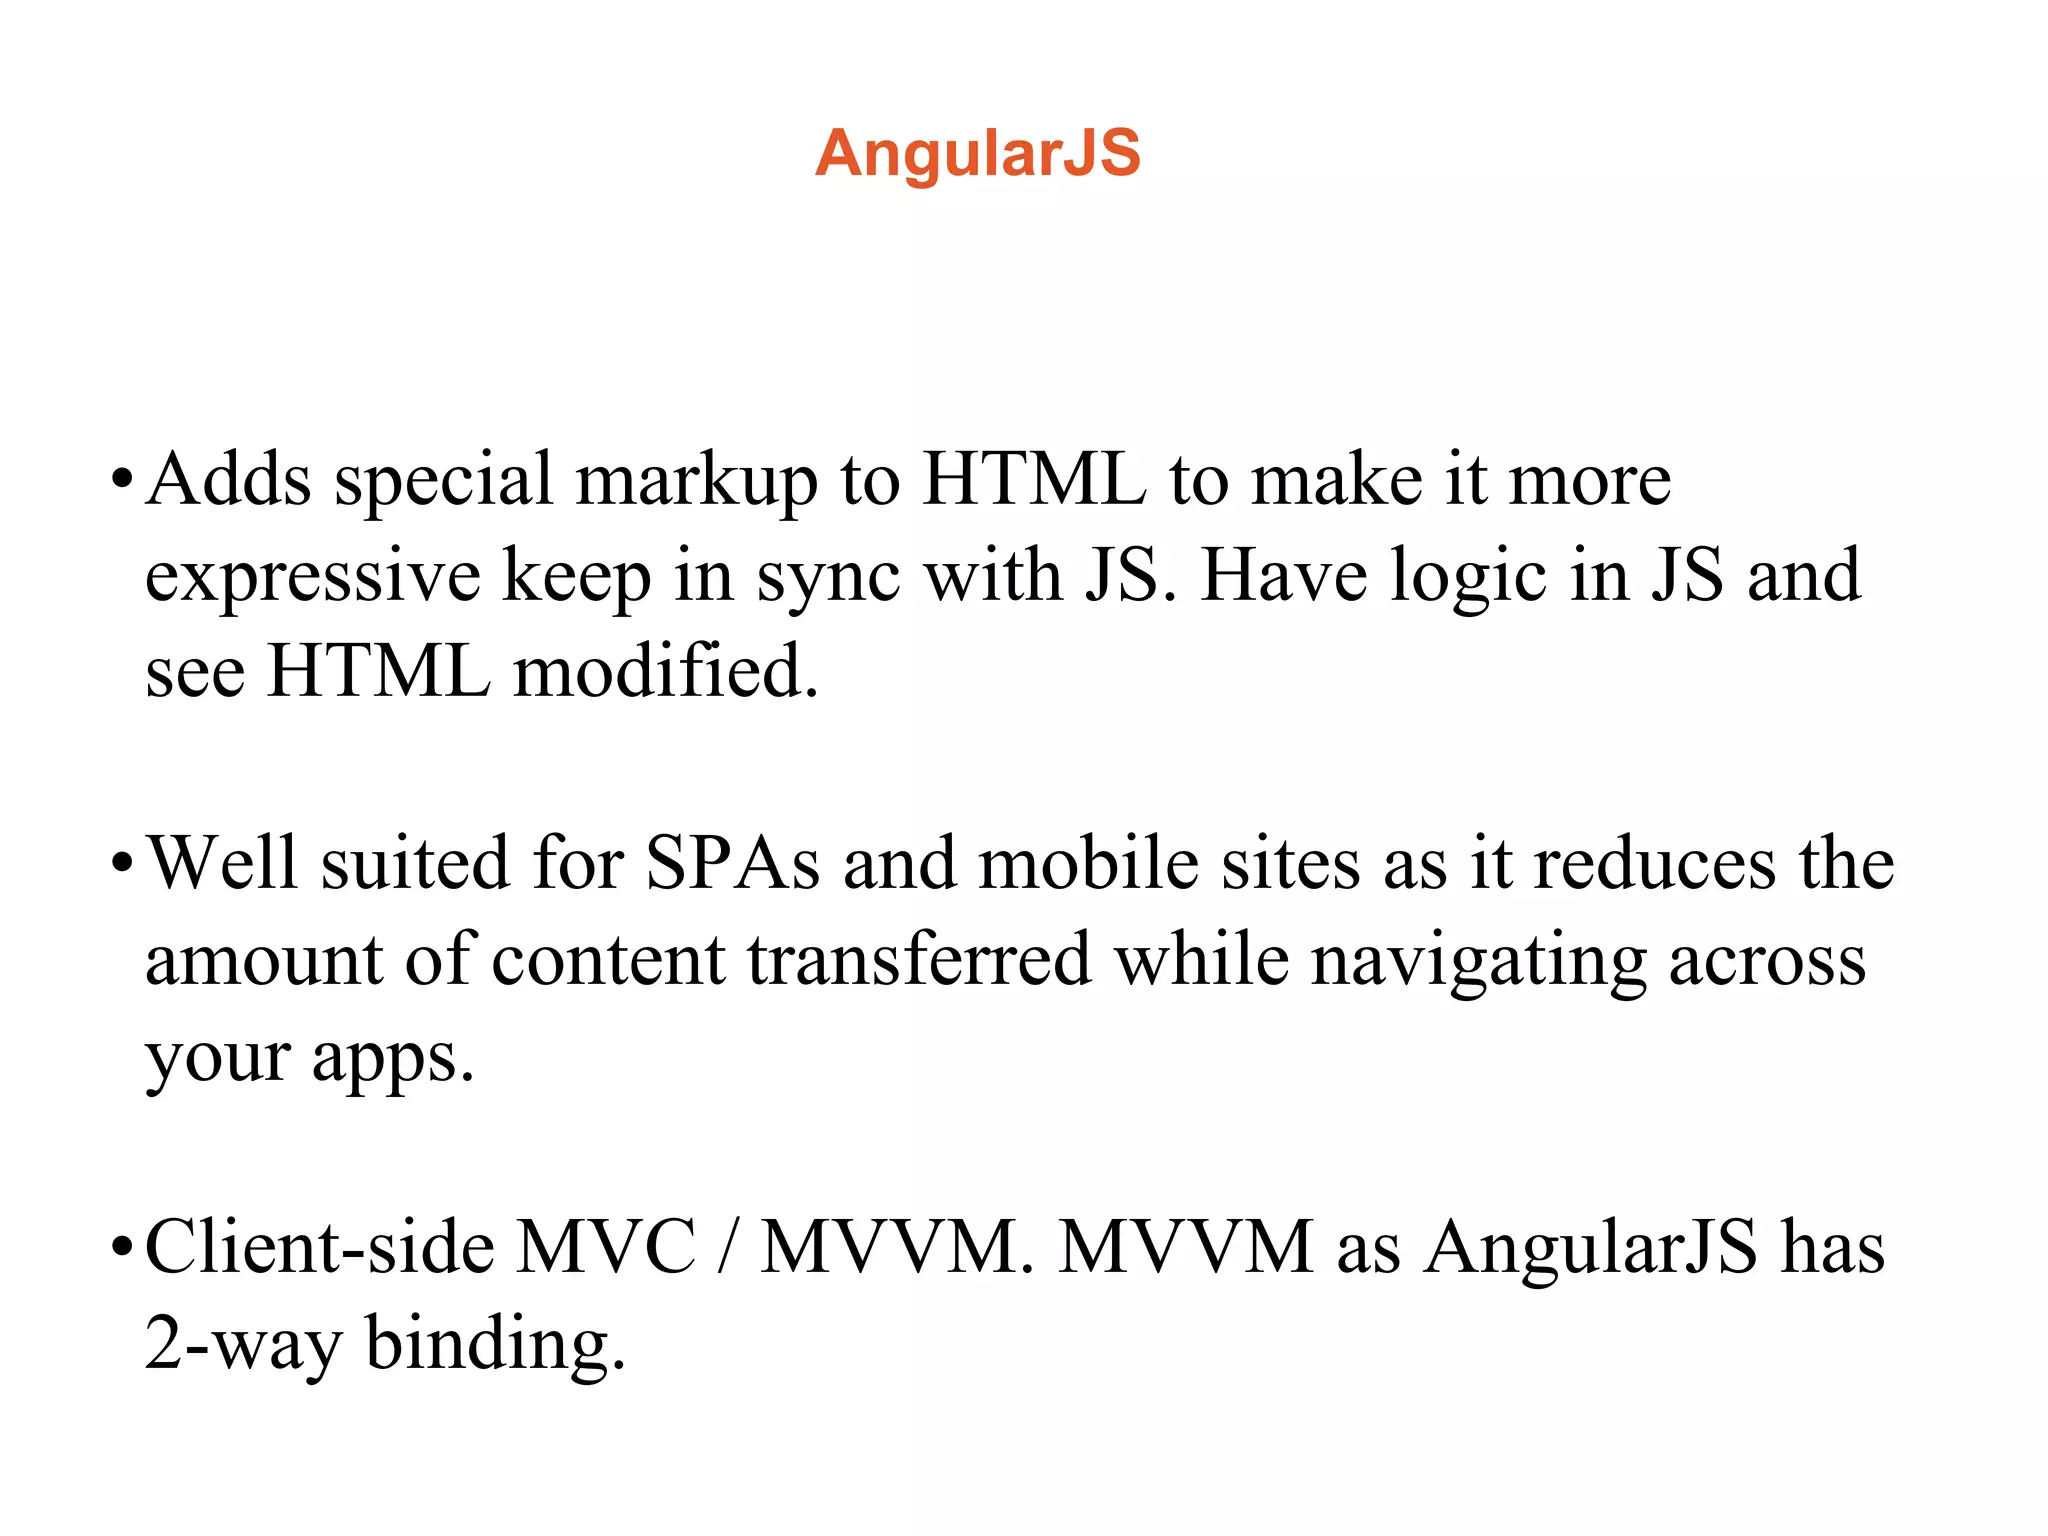
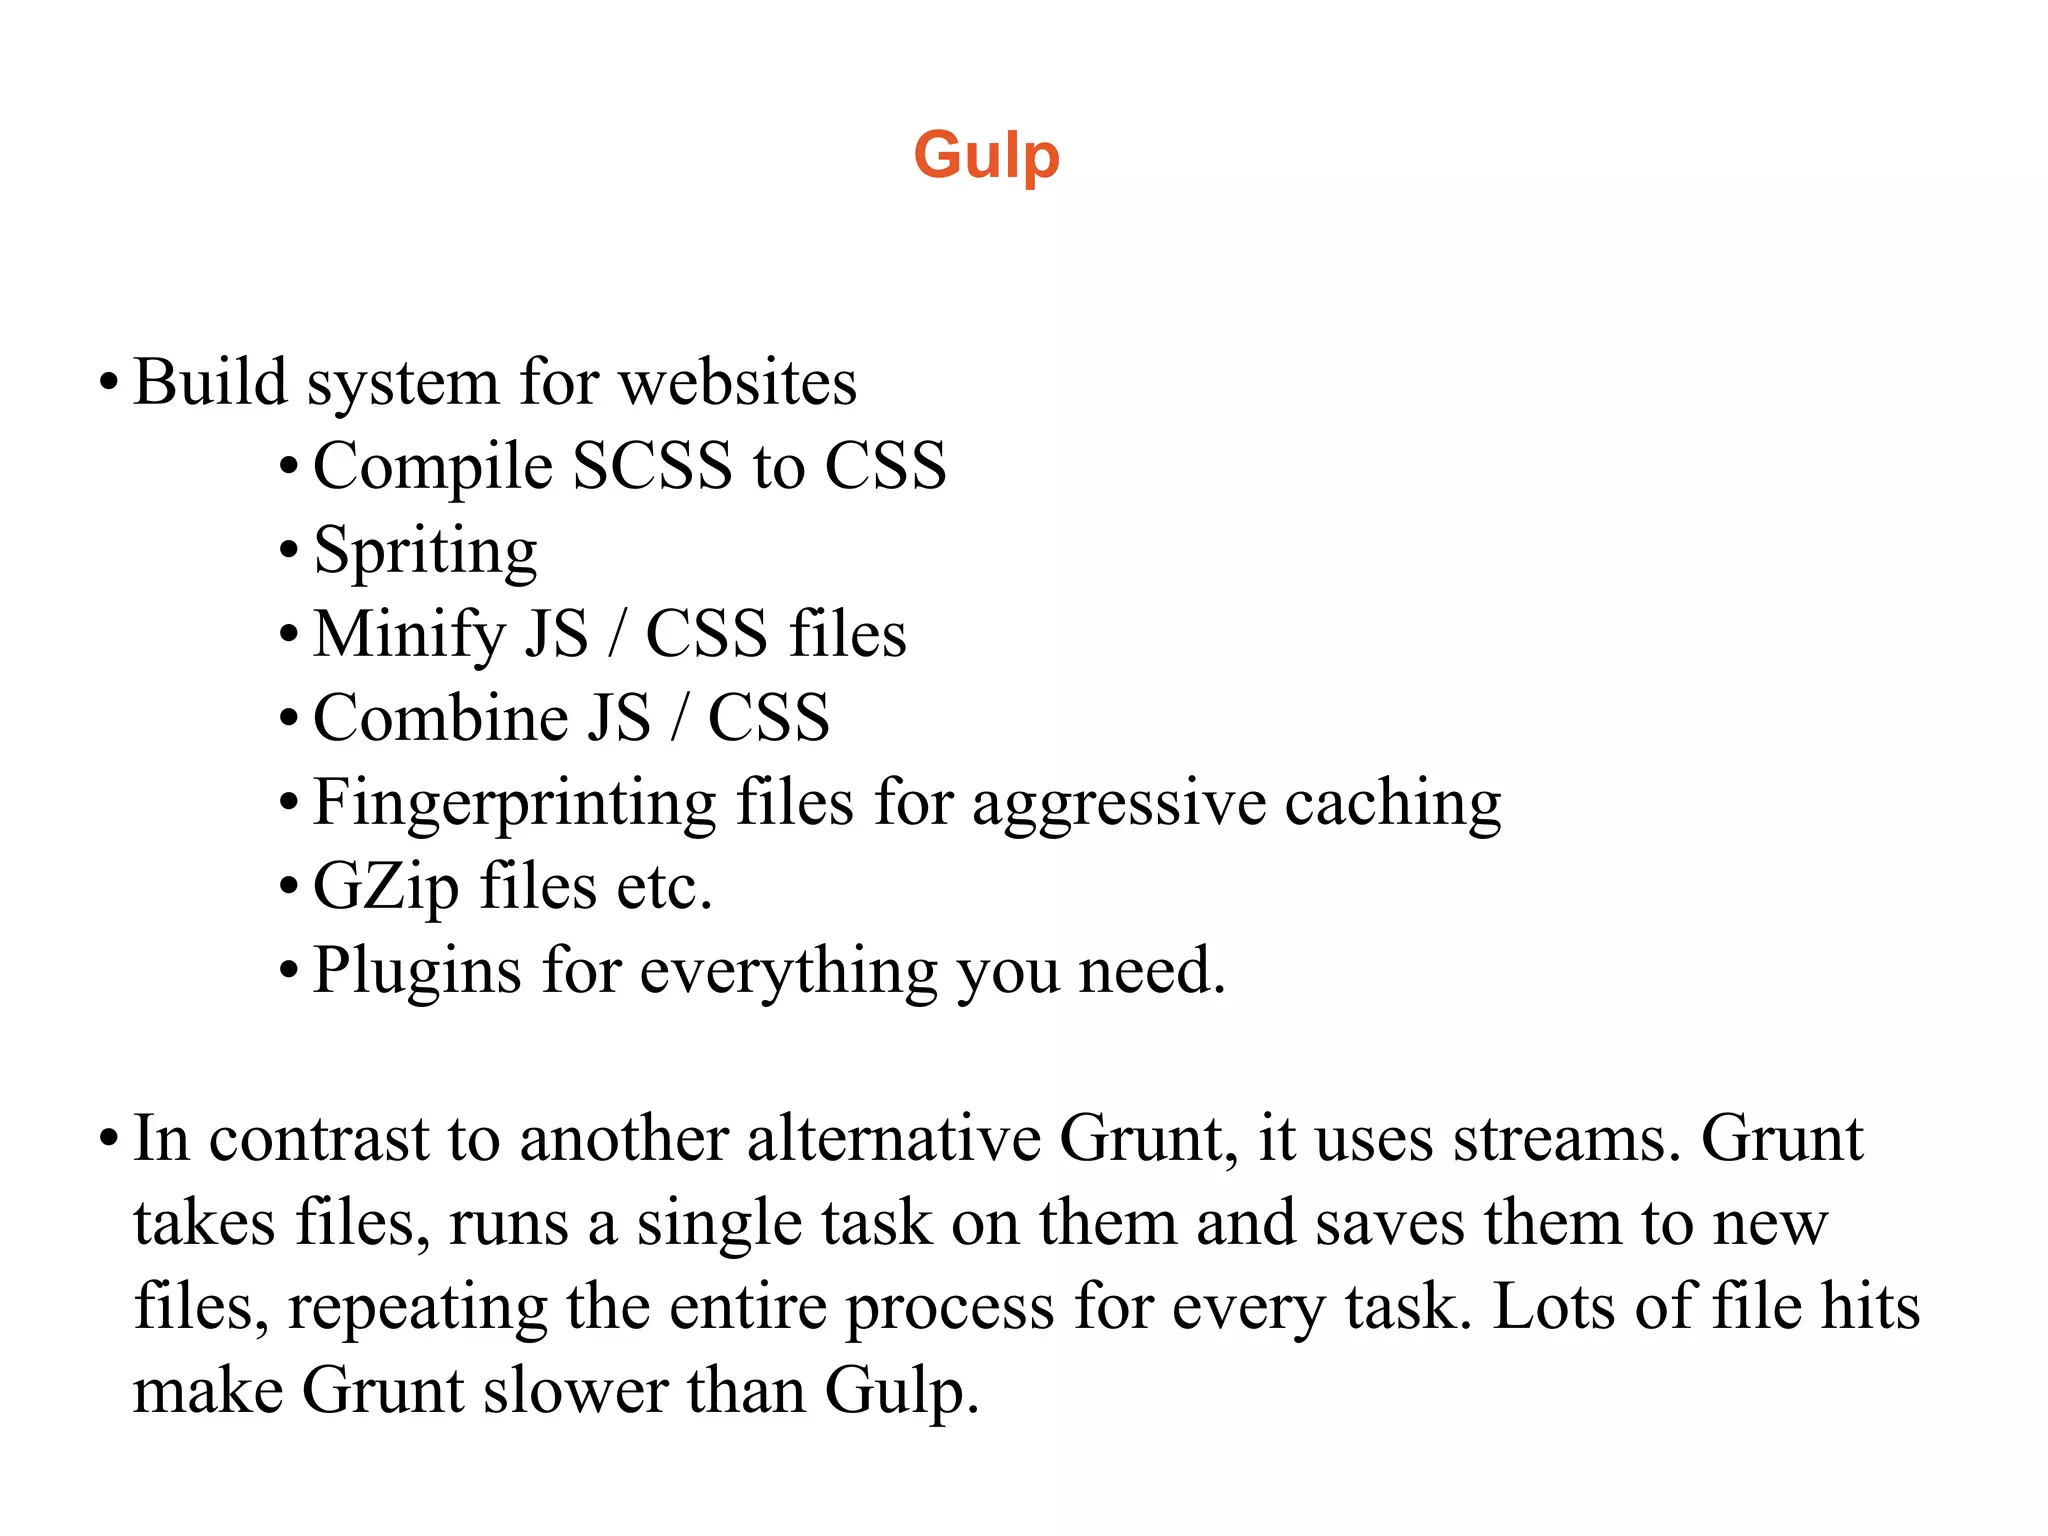
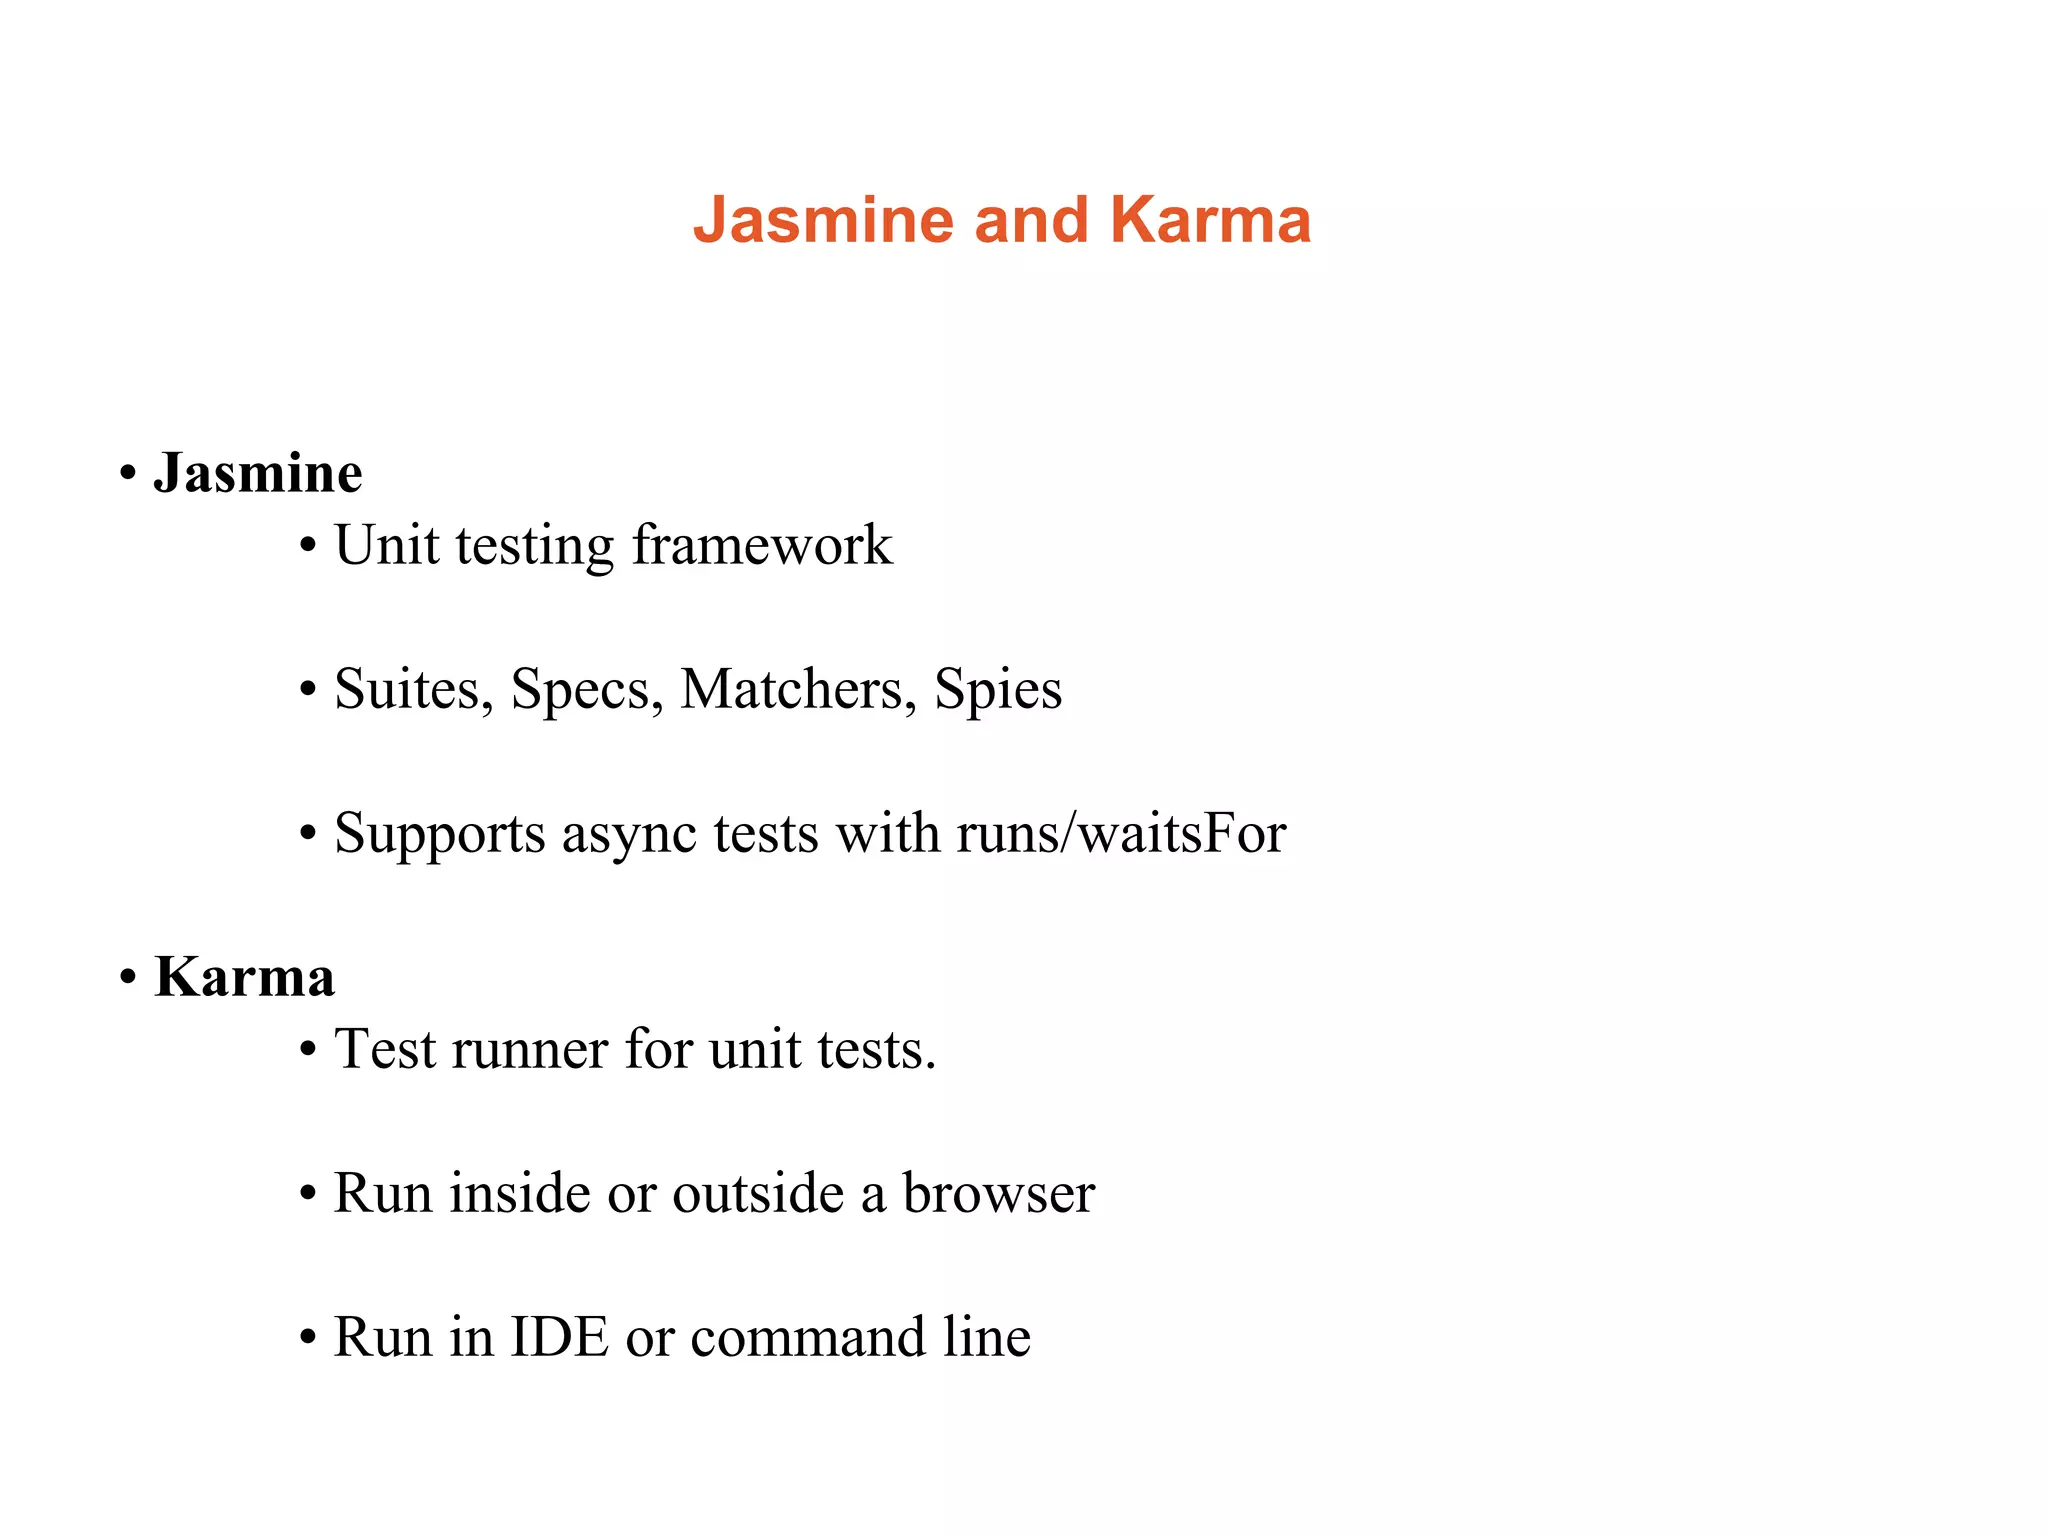
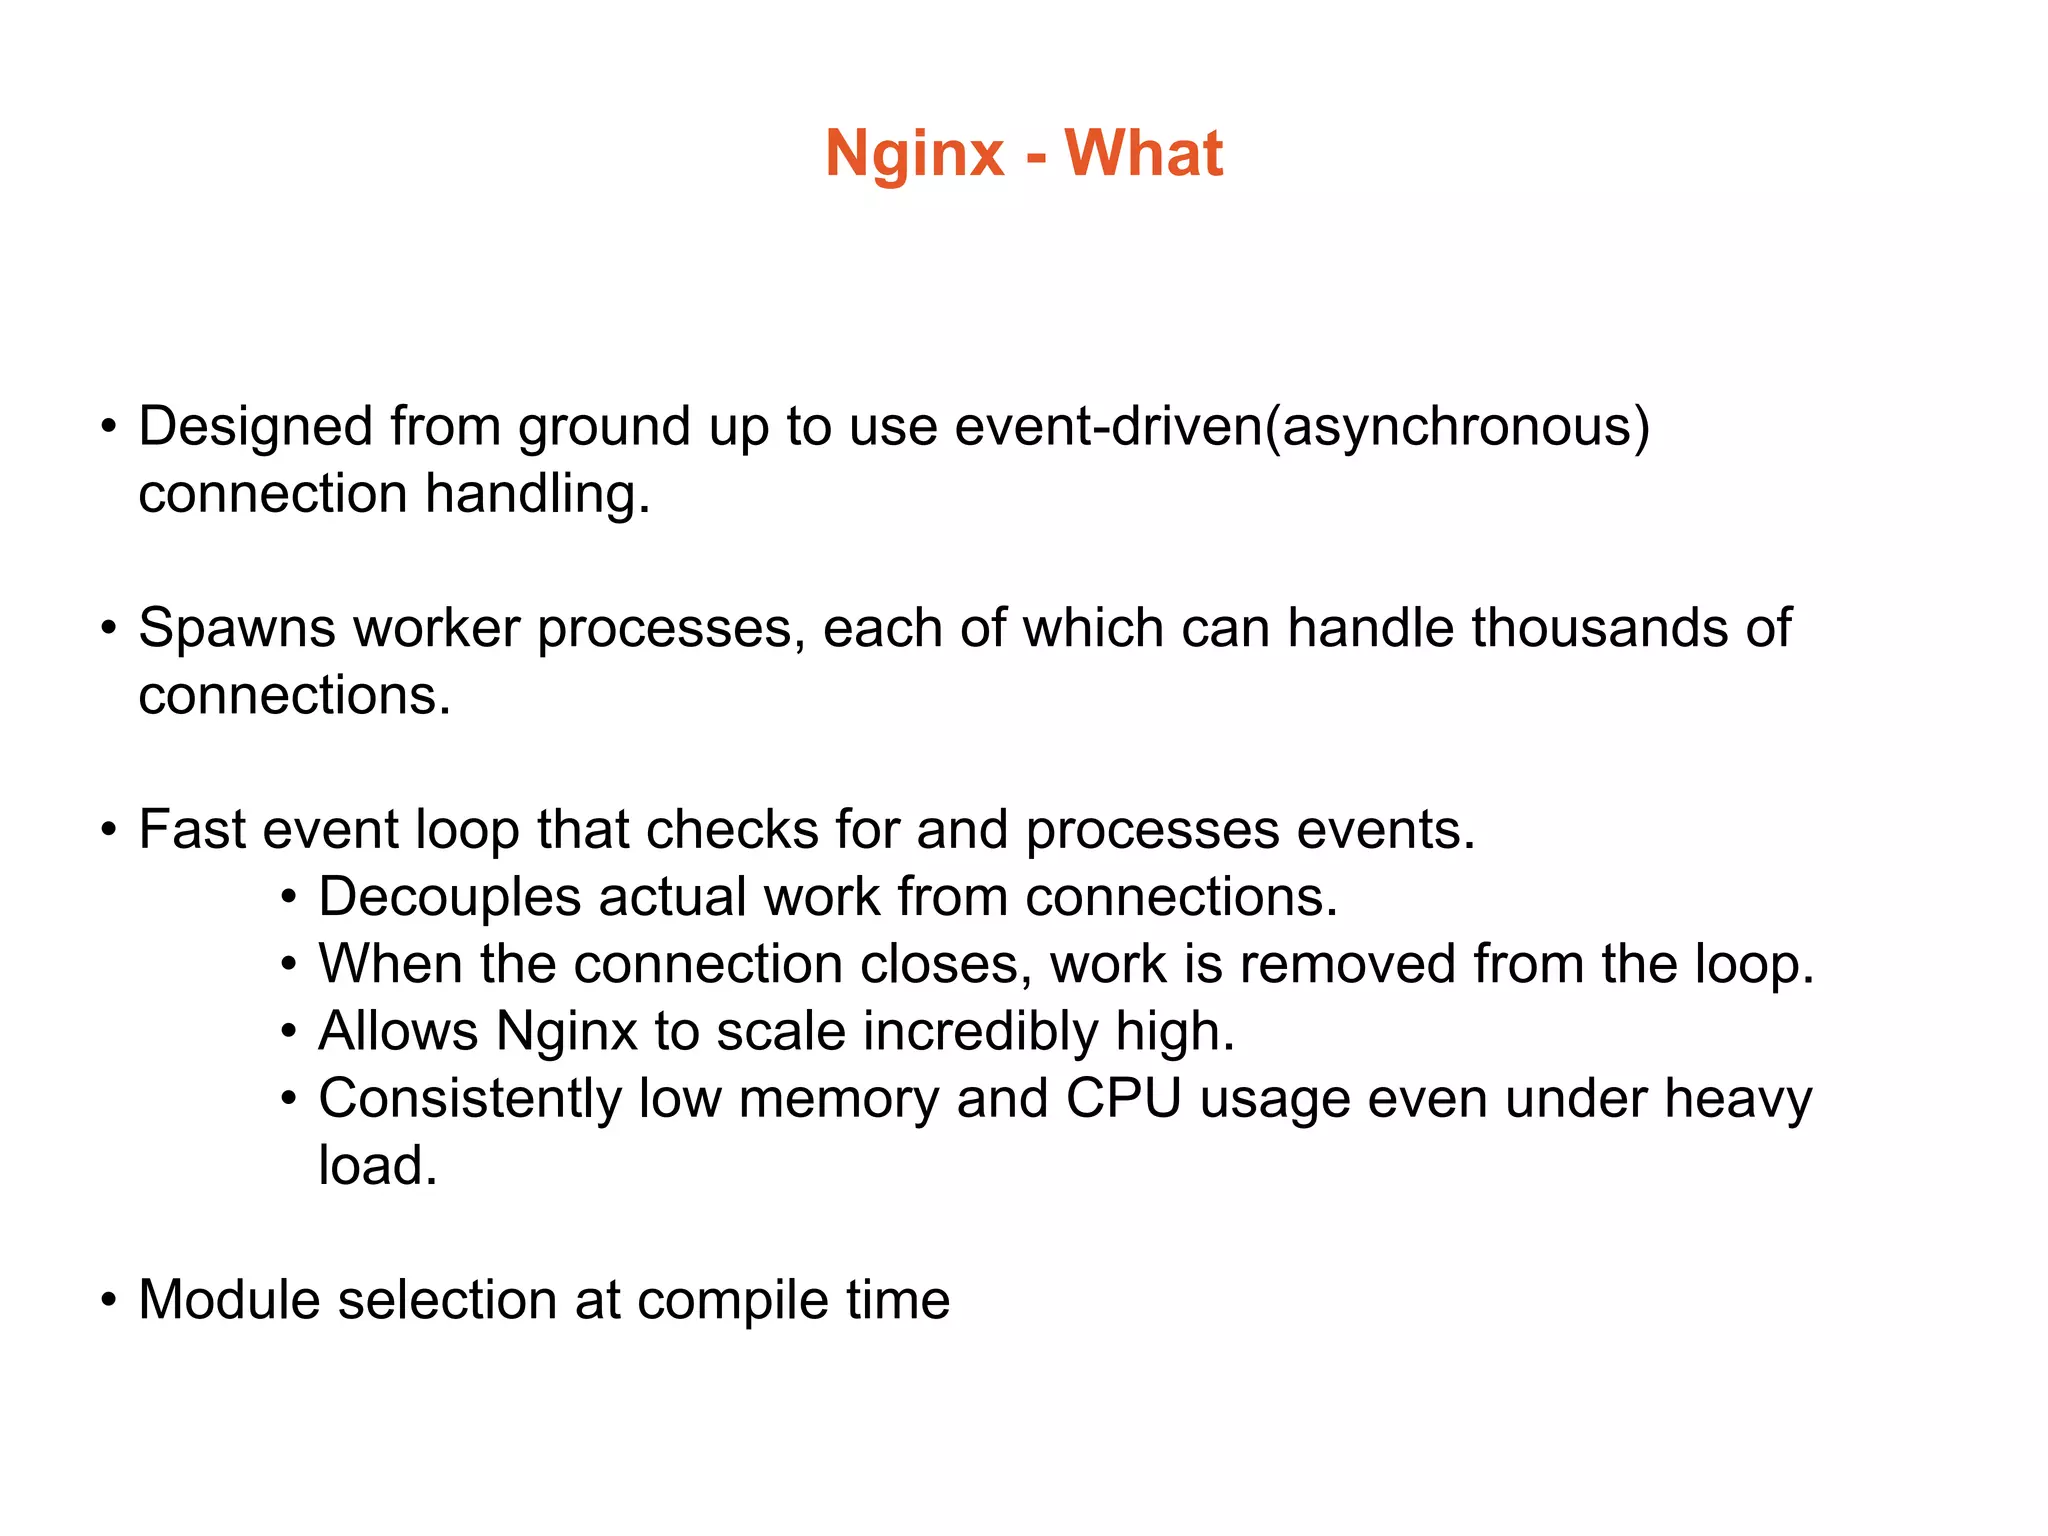
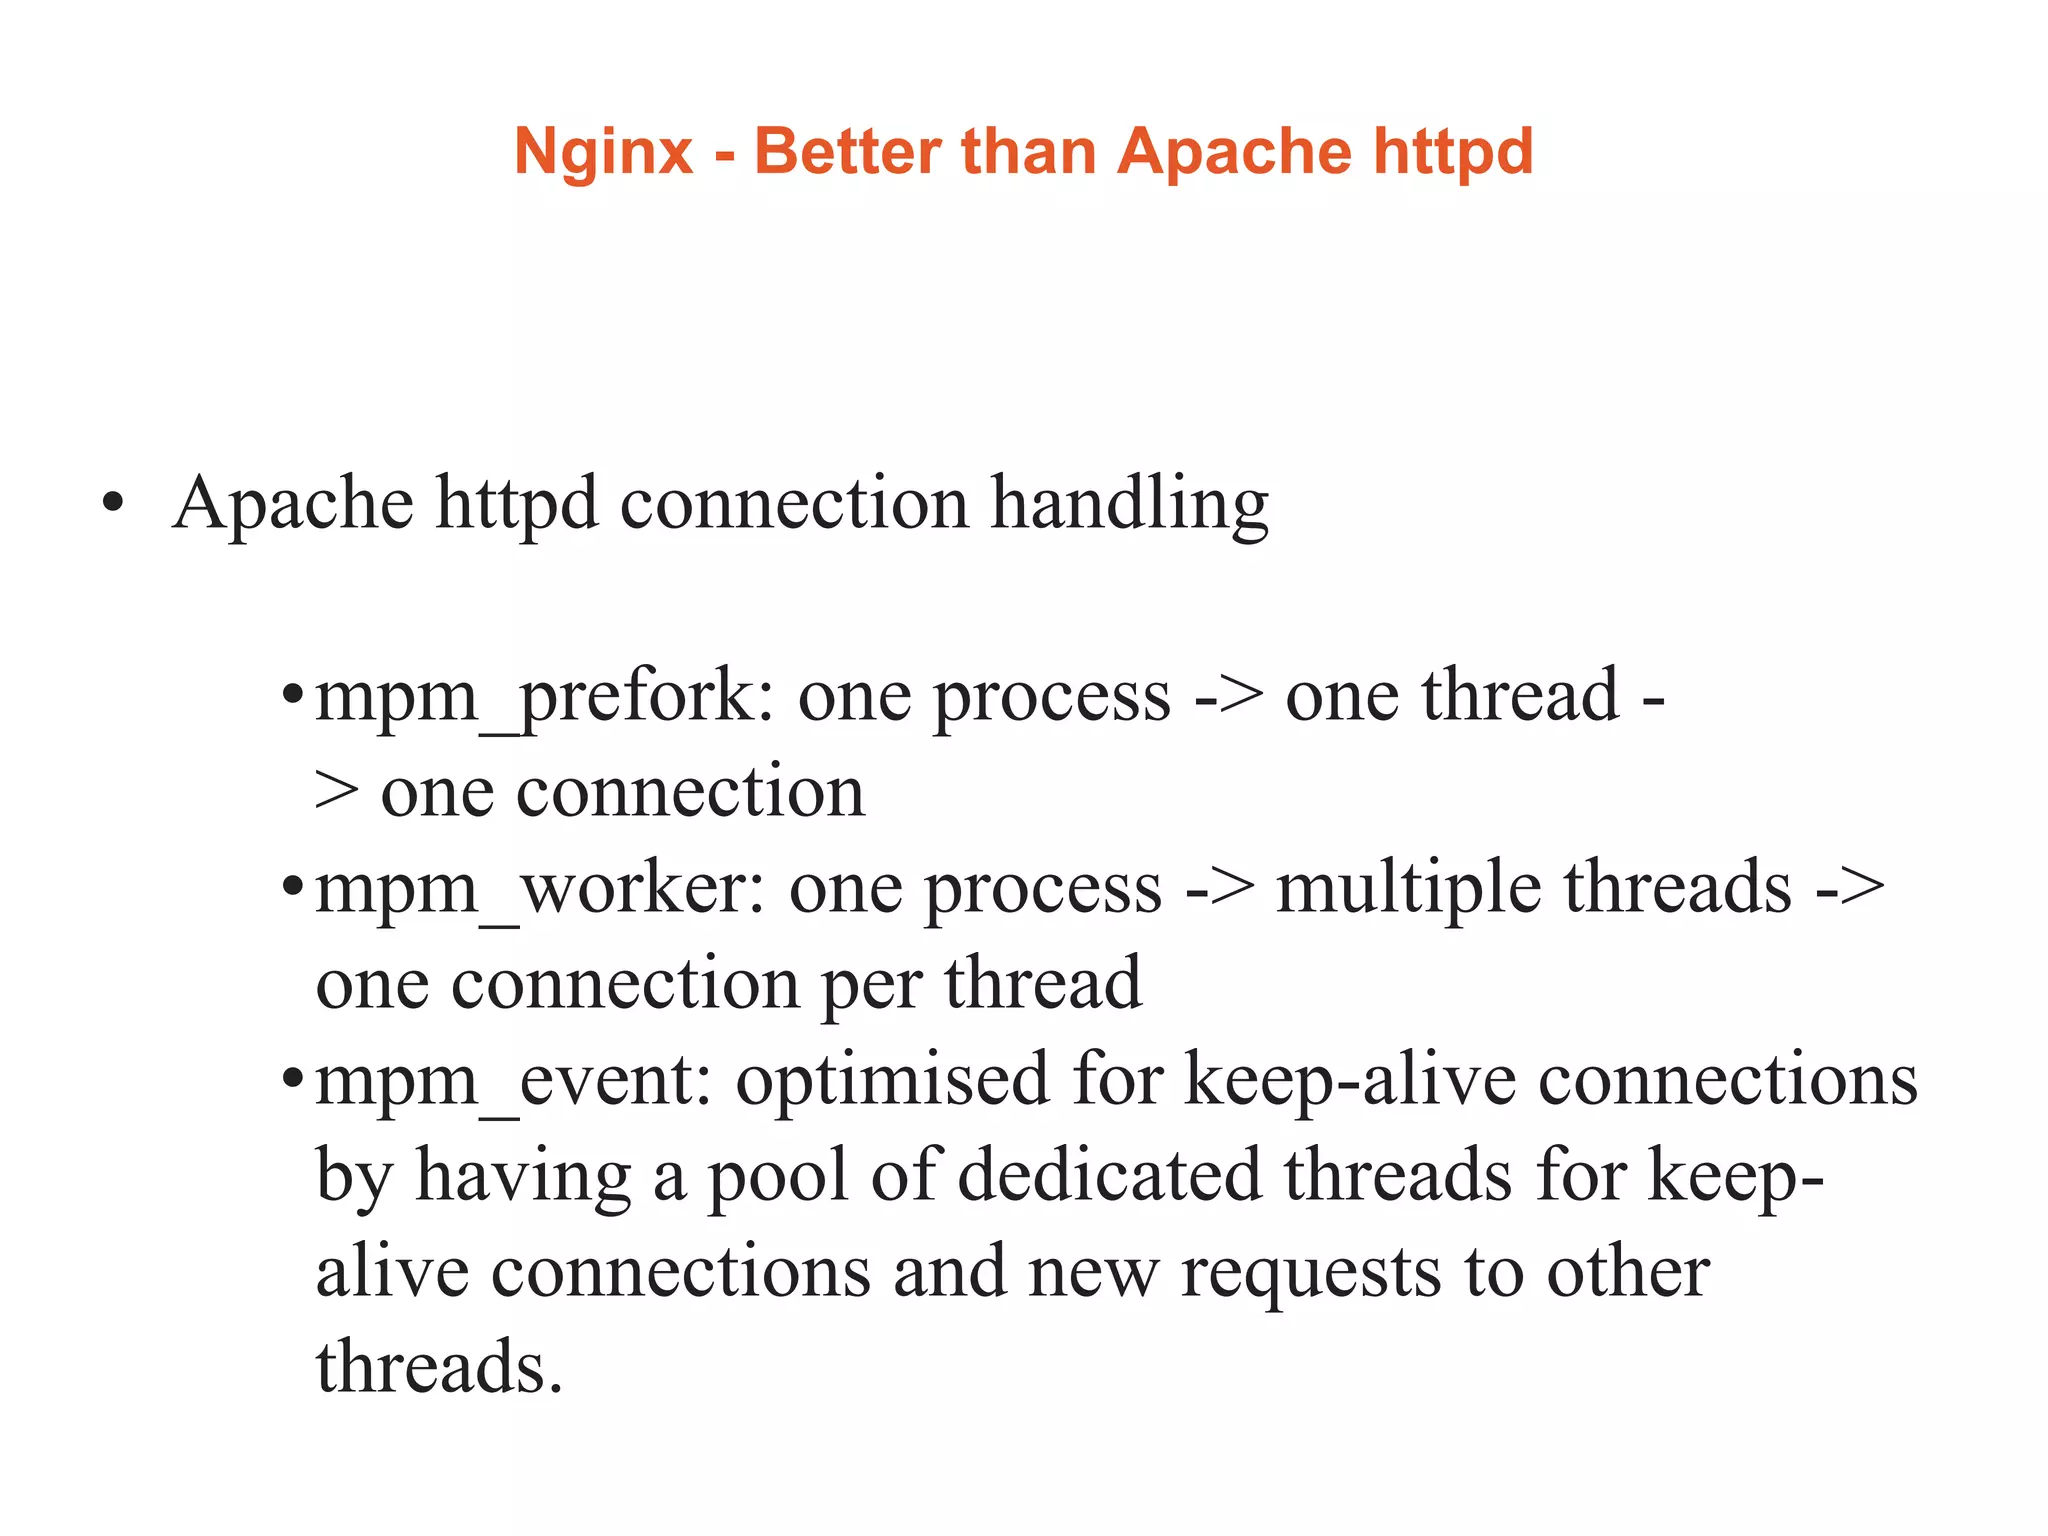
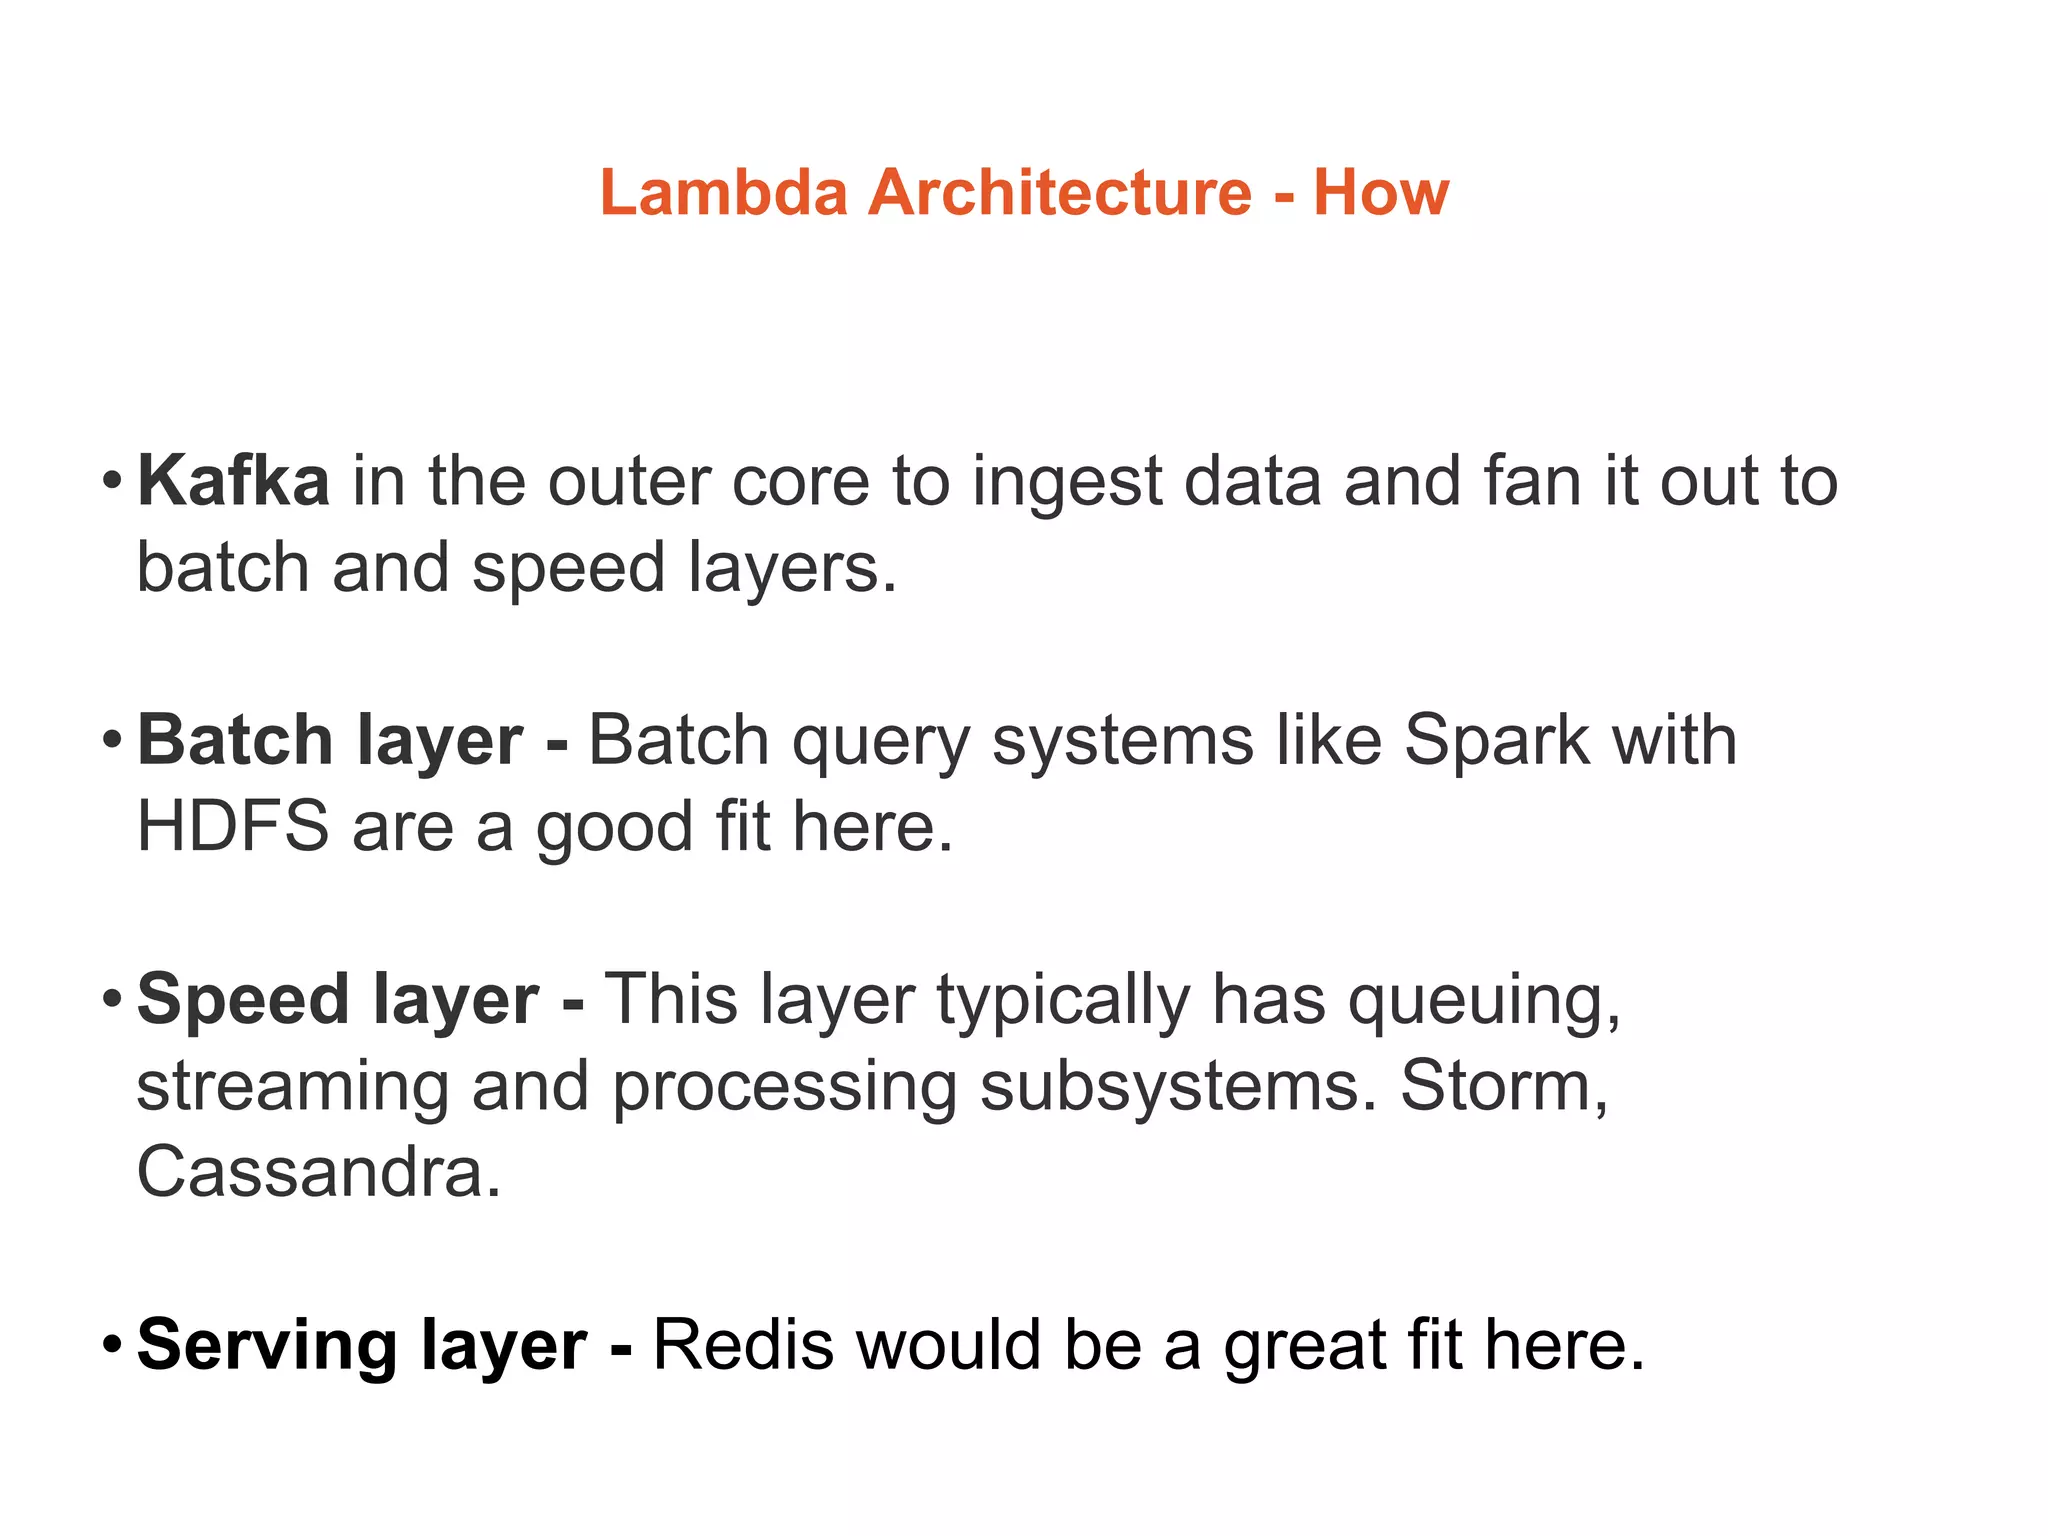
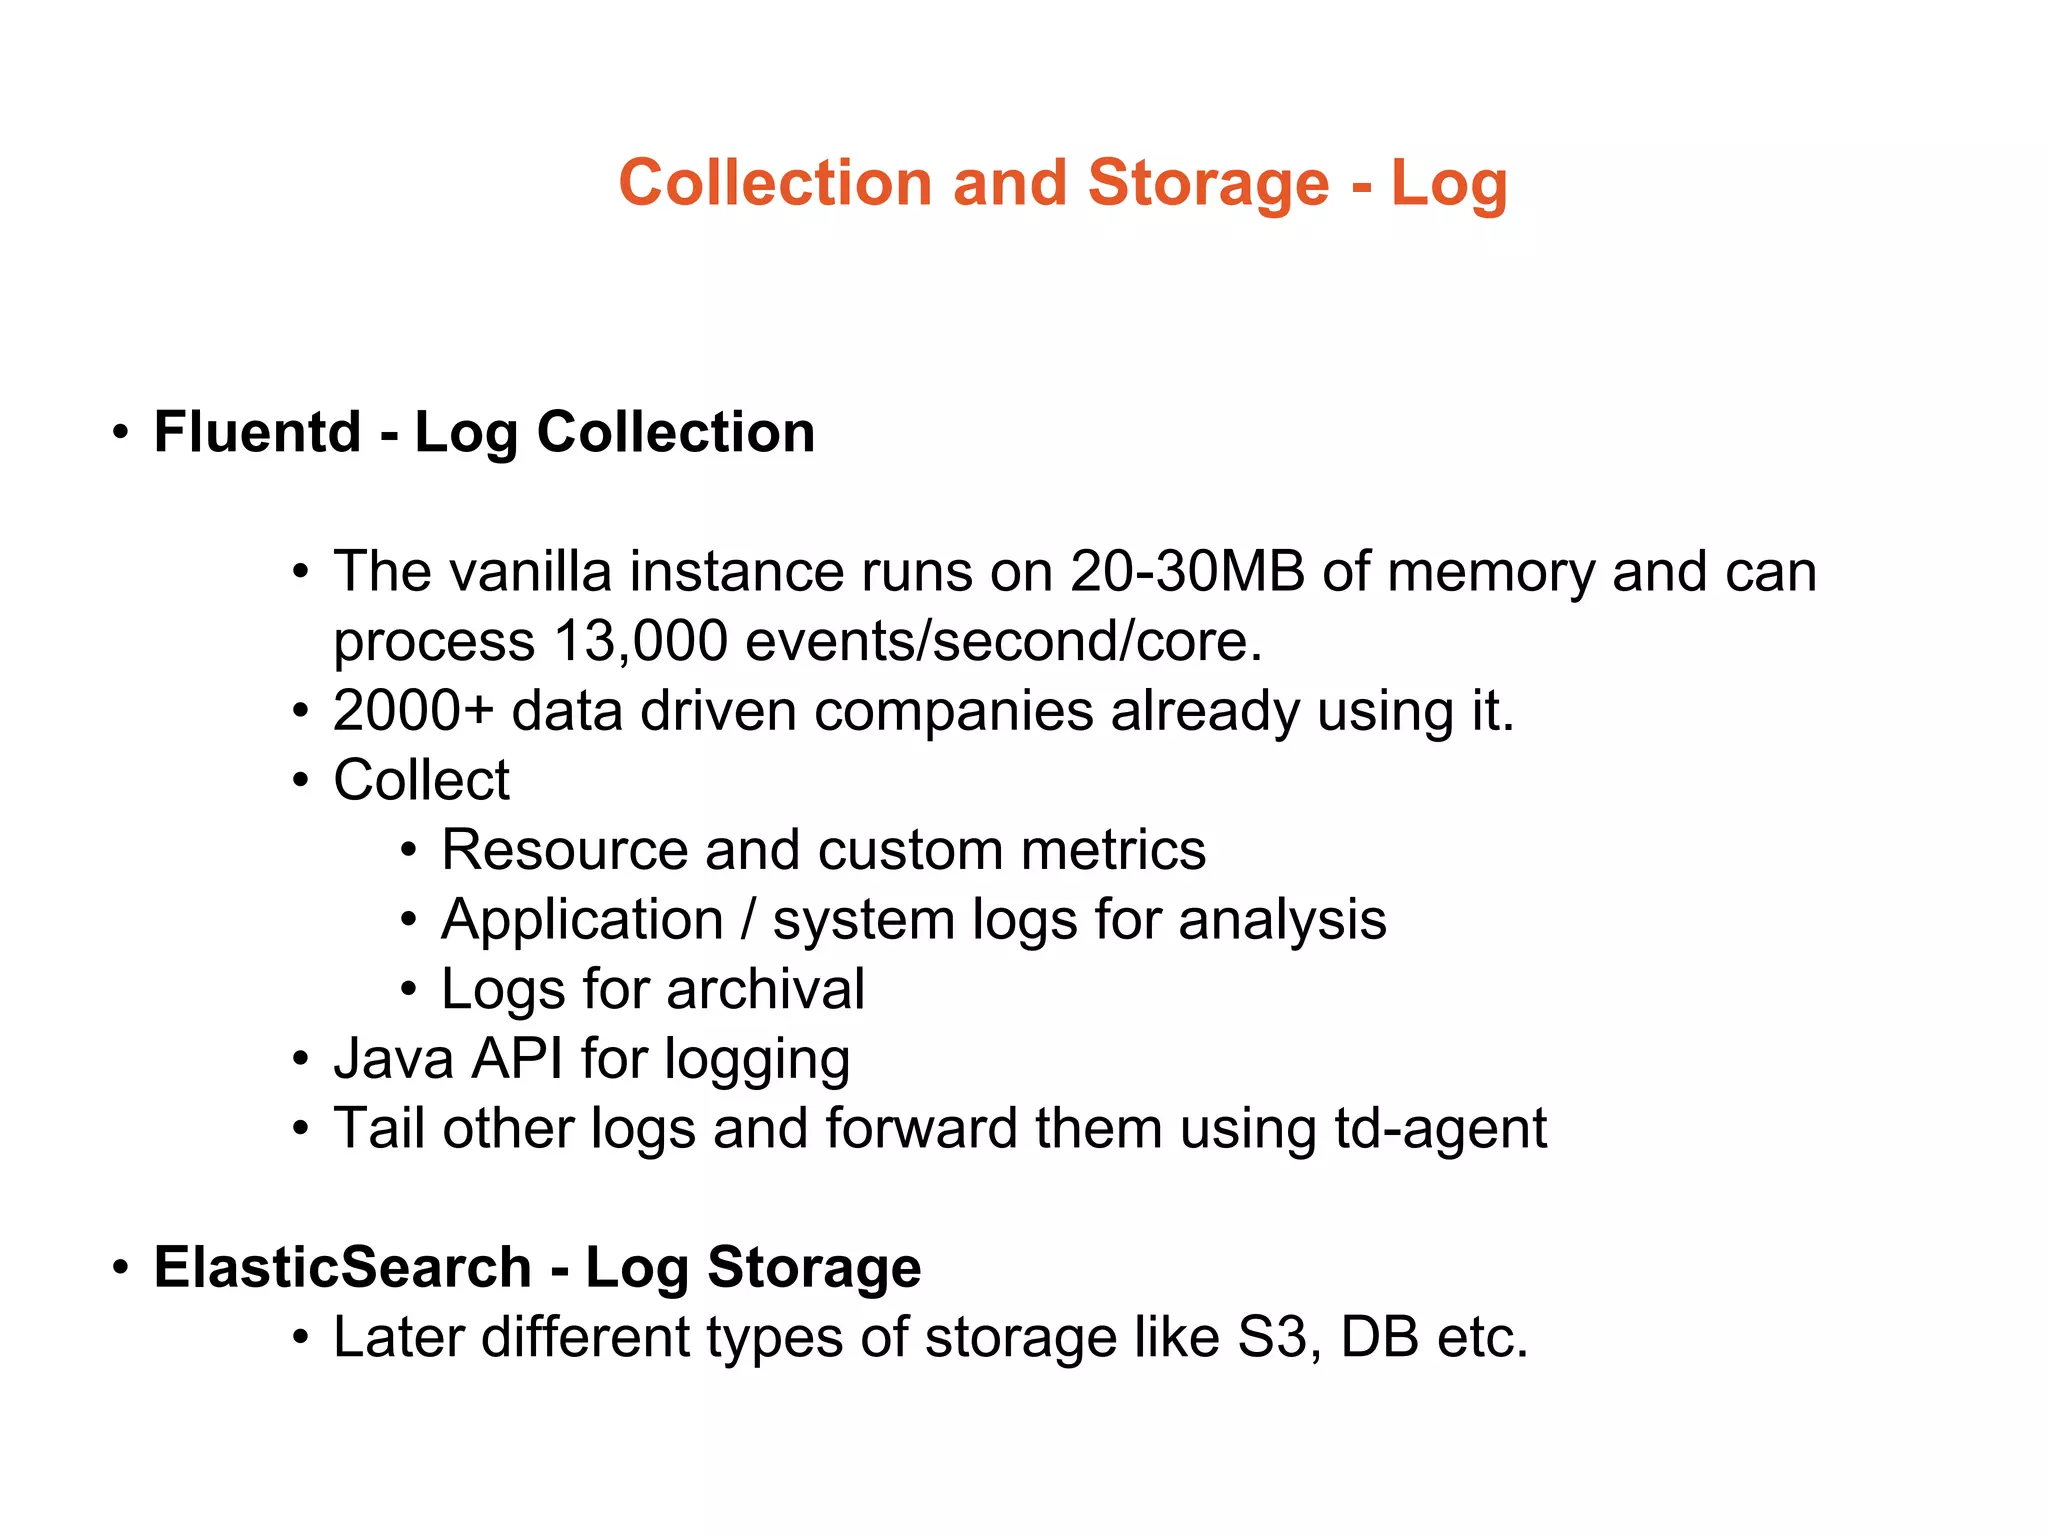
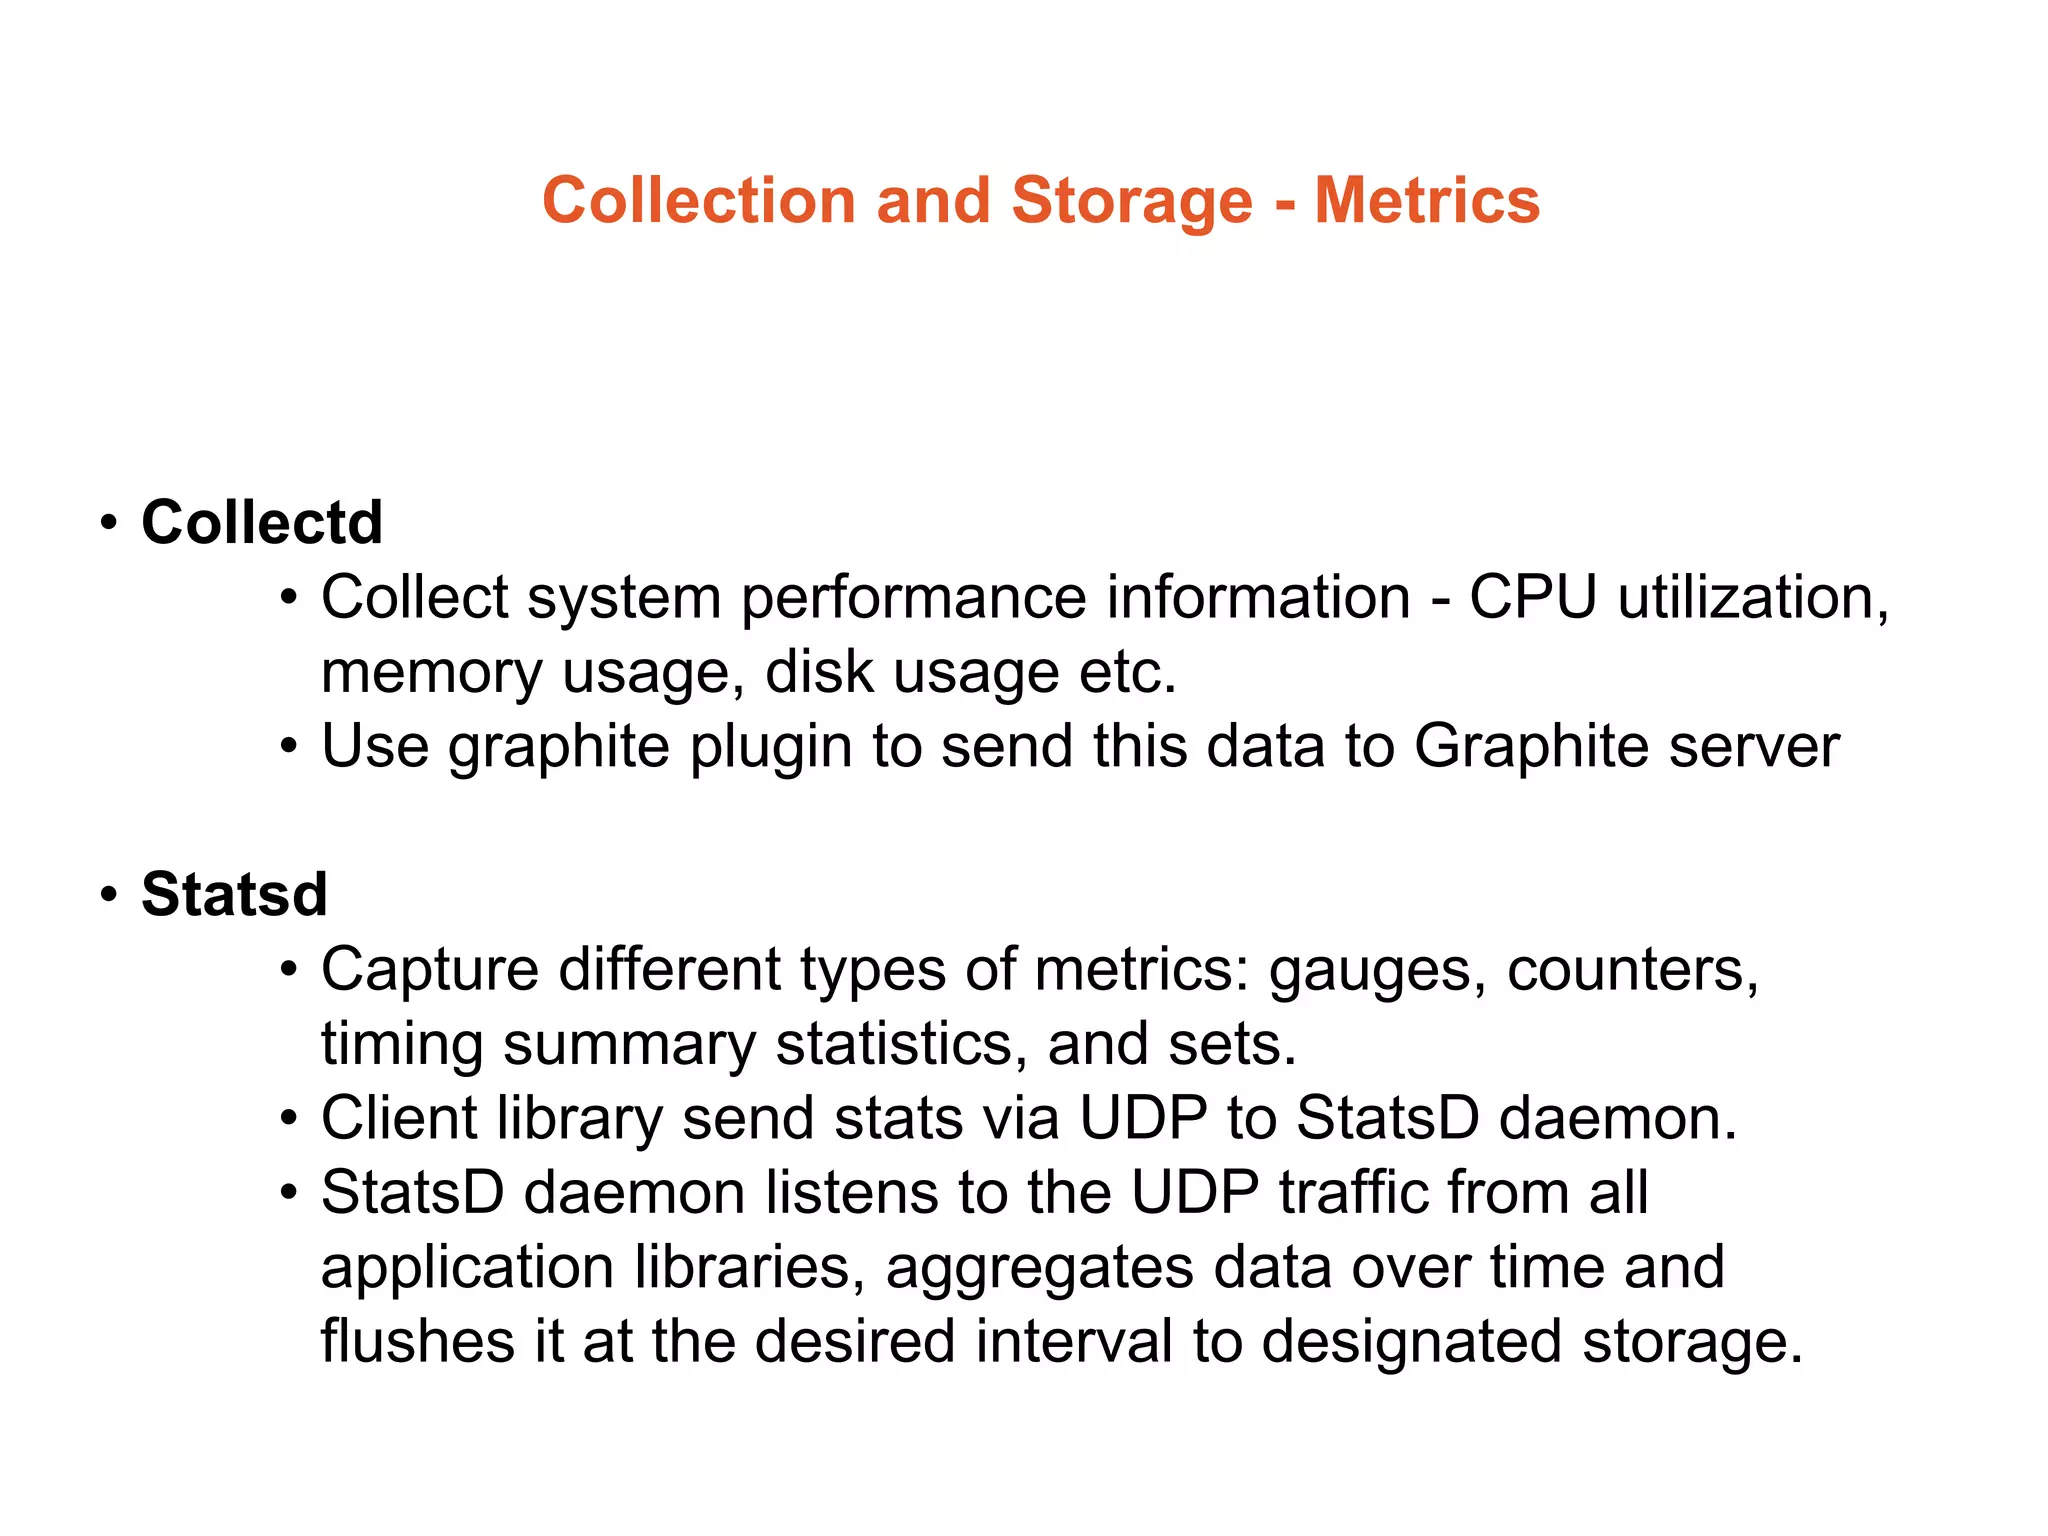
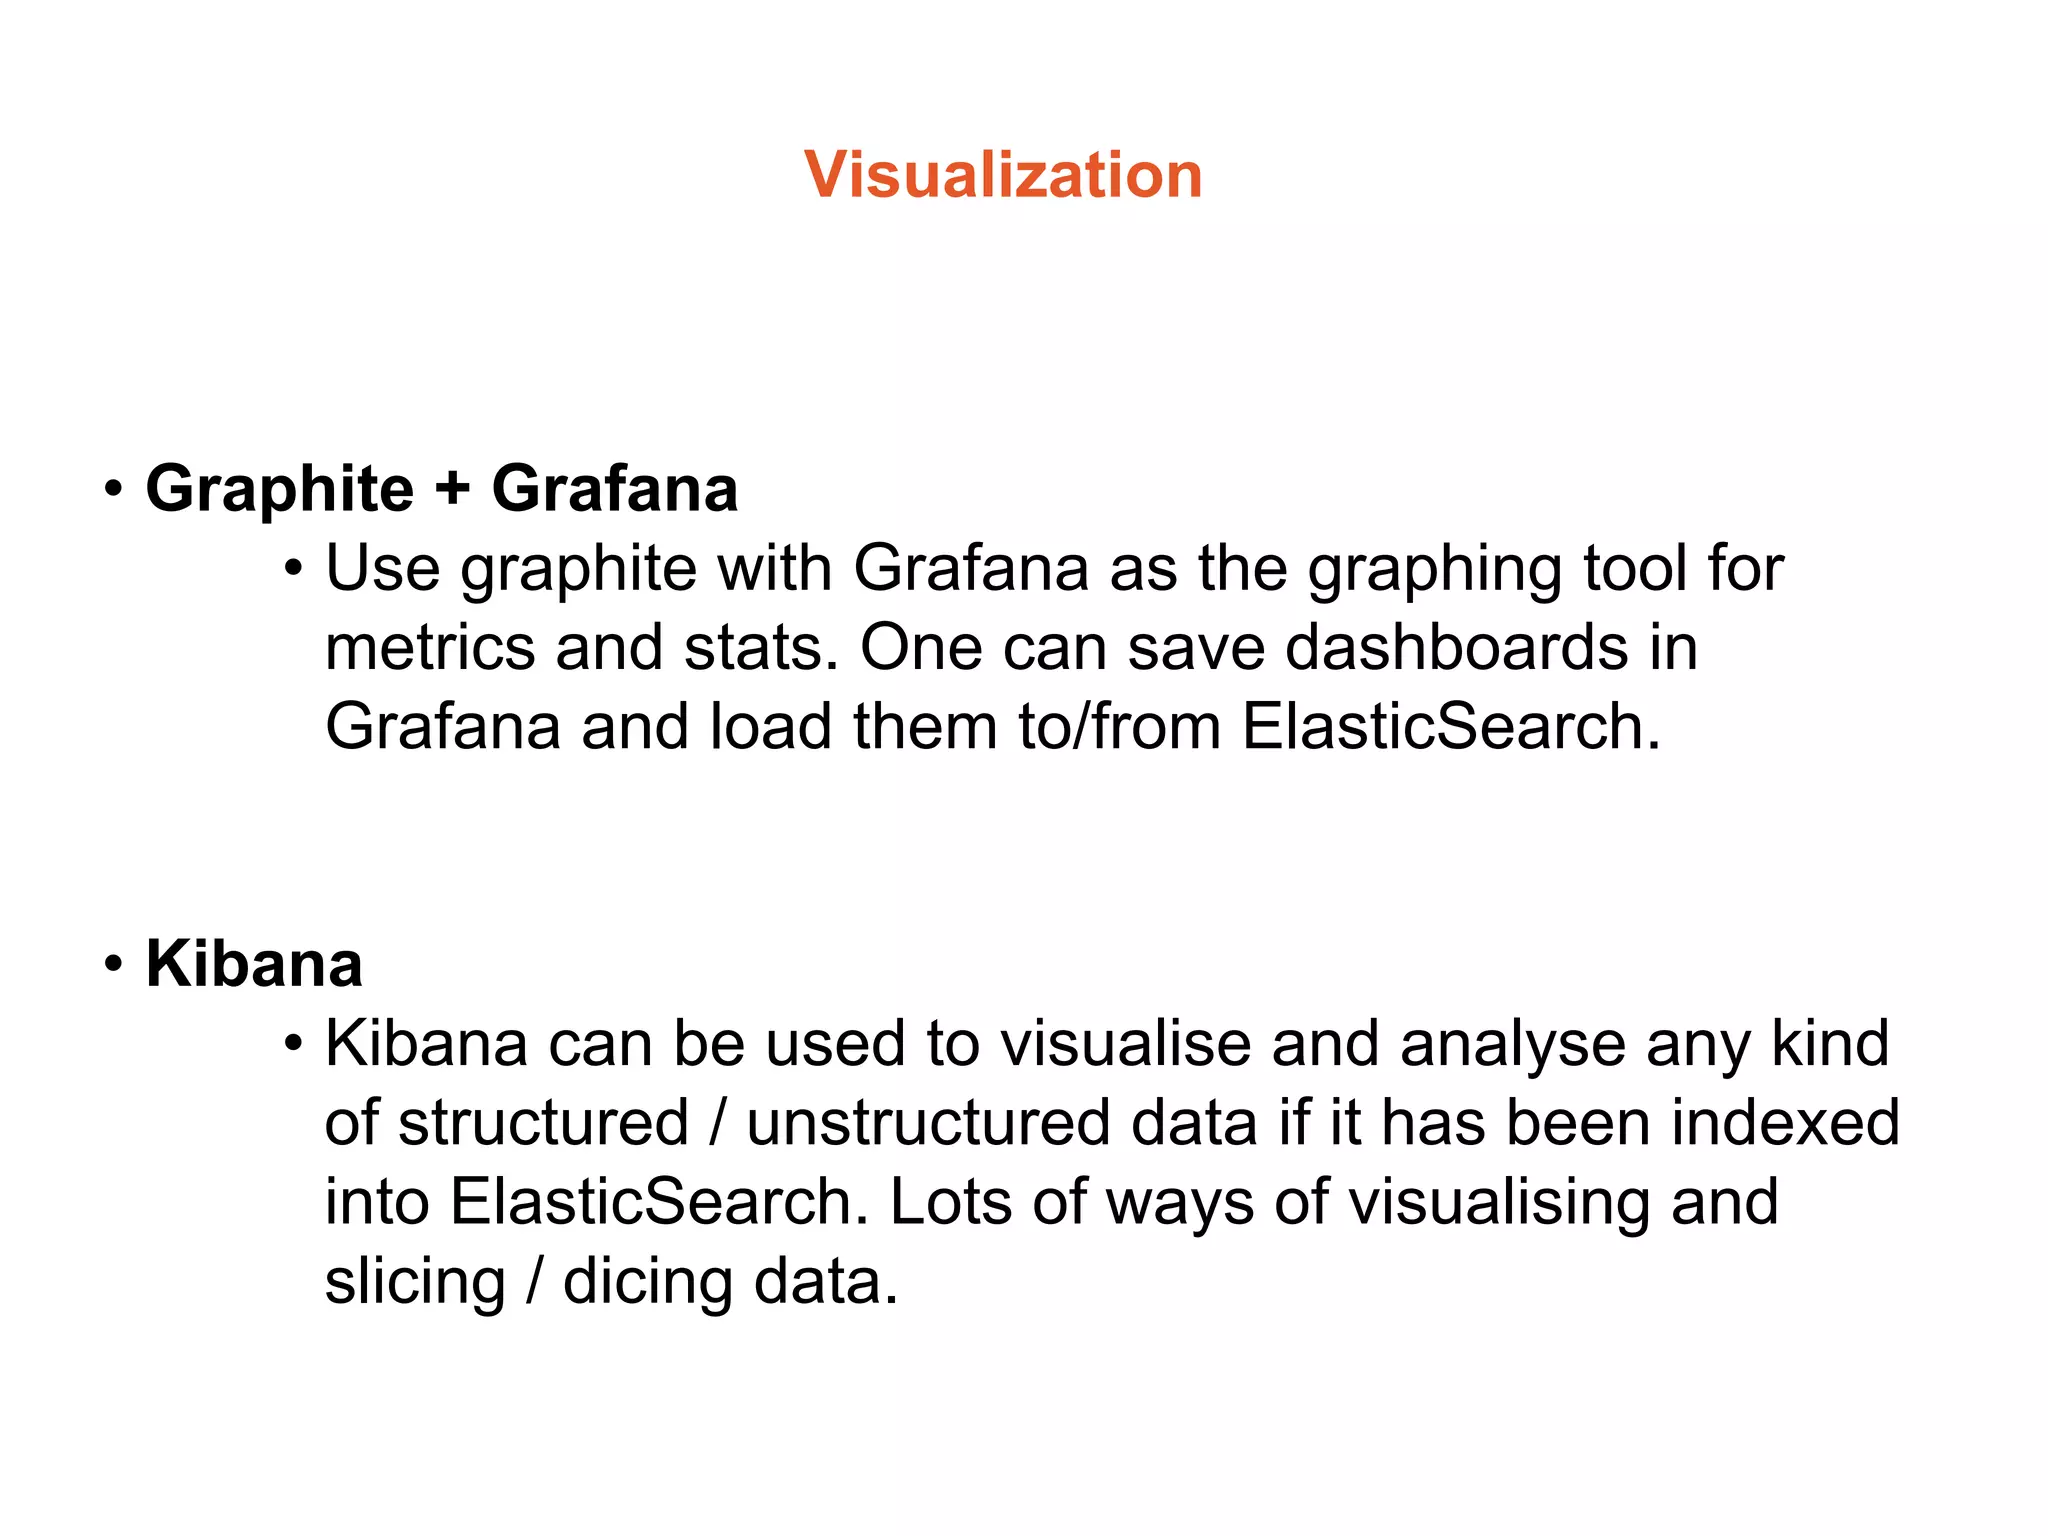
This document discusses various technologies related to architectures, frameworks, infrastructure, services, data stores, analytics, logging and metrics. It covers Java 8 features like lambda expressions and method references. It also discusses microservices, Spring Boot basics and features, Gradle vs Maven, Swagger, AngularJS, Gulp, Jasmine, Karma, Nginx, CloudFront, Couchbase, Lambda Architecture, logging with Fluentd and Elasticsearch, metrics collection with Collectd and Statsd, and visualization with Graphite and Grafana.
4. Java 8
• Lambda expressions and Method References
persons.stream().map(p -> p.email());
persons.stream().mapToInt(Person::getAge).sum();
Java 7 - Collections.sort(personList, new Comparator<Person>(){
public int compare(Person p1, Person p2){
return p1.firstName.compareTo(p2.firstName);
}
});
Java 8 - Collections.sort(personList, (Person p1, Person p2) ->
p1.firstName.compareTo(p2.firstName));
• Annotations on types
• @NonNull – Compile-time null checks.
• @ReadOnly – Compile-time error on any attempt to change the object.
5. Java 8
• Extension Methods
• Default methods that you can add to your interfaces without breaking backward
compatibility. Example: forEach(..lambda expression)
public interface Iterable<T> {
Iterator<T> iterator();
default void forEach(Consumer<? super T> action) {
Objects.requireNonNull(action);
for (T t : this) {
action.accept(t);
}
}
}
• Other changes
• Parallel array sorting.
• Improved I/O API.
• Better date and time API.
• Base64 encoding and decoding.
6. Microservices
•Small problem domain
•Less than 500-1000 lines of code.
•Across 5 or so domain objects in Java.
•Can be built, deployed and run independently.
•Owns its own data storage.
7. SpringBoot - Basics
• Basics
• Use Gradle plugin for runnable jar/war.
• Run a project in-place with bootRun task.
• Spring-Loaded - Reload Java classes without restarting the
container.
• Unlike 'hot code replace' which only allows simple changes
once a JVM is running (e.g. changes to method bodies),
Spring Loaded allows you to add/modify/delete
methods/fields/constructors.
• Datastores
[ If you are using auto-configuration, repositories will be searched from the package
containing your main configuration class (the one annotated with @EnableAutoConfiguration or
@SpringBootApplication) down.]
• JPA
• NoSQL
• Couchbase
• MongoDB
8. SpringBoot - Features
• Externalized Configuration
server:
address: 192.168.2.192
---
spring:
profiles: development
server:
address: 127.0.0.1
---
spring:
profiles: staging
server:
address: 192.168.22.184
• Profile specific configuration values
• Using YAML instead of Properties
• Profile specific application-[profile].yml files
• Multi-profile YAML documents
• Automatic property expansion using Gradle
• Adding active profiles
• -Dspring.profiles.active=production
9. SpringBoot - Features
• Production Services
• Customize endpoints
• Sensitivity
• Disabling
• Writing custom HealthIndicators
• Metrics
• System metrics
• Tomcat session metrics
• Recording your own metrics
• Metric repositories
10. SpringBoot - Features
• Tests
• Unit Tests
• Integration Tests
• EnvironmentTestUtils
• OutputCapture
• TestRestTemplate
11. SpringBoot - Features
• Customizing embedded servlet containers
• Configure Tomcat
• Enable Multiple Connectors with Tomcat
• Configure SSL
• Use Tomcat behind a front-end proxy server
• Enable HTTPS when running behind a proxy
server
• Switch off the Spring MVC DispatcherServlet
• Switch off the Default MVC configuration
• Customize ViewResolvers
12. SpringBoot - Features
• Auditing
• Tracing
• Deployment
• Unix/Linux services
• Converting Existing Applications to Spring Boot
• Servlet 3.0+ applications with no web.xml.
• Applications with a web.xml.
• Applications with a context hierarchy.
• Applications without a context hierarchy.
13. Gradle
• Build automation system for polyglot environment. Linkedin uses it to
build 60 programming languages.
• Plugins and integrations with almost every tool in the DevOps pipeline.
• Manage dependencies across repository types like Maven and Ivy.
• Concise and scriptable. Right balance of declarative and imperative.
• Incremental builds, build caching and parallelisation of builds.
• Build analytics and reporting to see problems and areas of optimisation.
19. AngularJS
•Adds special markup to HTML to make it more
expressive keep in sync with JS. Have logic in JS and
see HTML modified.
•Well suited for SPAs and mobile sites as it reduces the
amount of content transferred while navigating across
your apps.
•Client-side MVC / MVVM. MVVM as AngularJS has
2-way binding.
20. Gulp
• Build system for websites
• Compile SCSS to CSS
• Spriting
• Minify JS / CSS files
• Combine JS / CSS
• Fingerprinting files for aggressive caching
• GZip files etc.
• Plugins for everything you need.
• In contrast to another alternative Grunt, it uses streams. Grunt
takes files, runs a single task on them and saves them to new
files, repeating the entire process for every task. Lots of file hits
make Grunt slower than Gulp.
21. Jasmine and Karma
• Jasmine
• Unit testing framework
• Suites, Specs, Matchers, Spies
• Supports async tests with runs/waitsFor
• Karma
• Test runner for unit tests.
• Run inside or outside a browser
• Run in IDE or command line
22. Nginx - What
• Designed from ground up to use event-driven(asynchronous)
connection handling.
• Spawns worker processes, each of which can handle thousands of
connections.
• Fast event loop that checks for and processes events.
• Decouples actual work from connections.
• When the connection closes, work is removed from the loop.
• Allows Nginx to scale incredibly high.
• Consistently low memory and CPU usage even under heavy
load.
• Module selection at compile time
23. Nginx - Better than Apache httpd
• Apache httpd connection handling
•mpm_prefork: one process -> one thread -
> one connection
•mpm_worker: one process -> multiple threads ->
one connection per thread
•mpm_event: optimised for keep-alive connections
by having a pool of dedicated threads for keep-
alive connections and new requests to other
threads.
26. Couchbase
• Strong consistency within same data centre.
• Peer to peer architecture.
• Elastic scalability. Add / remove nodes.
• Ease of Administration
• Integrated admin console and scripting API with cluster-wide monitoring to manage large
deployments.
• General purpose
• A distributed cache, key/value store, and document database for enterprise web, mobile, and IoT
applications.
• Consistent high-performance
• Integrated cache for low latency reads.
• Fine-grained locking for high write throughput. No single point of failure.
• XA
• Automatic failover.
• Data replication within and between data centers ensures zero downtime.
• Java Library - spring-data-couchbase and Couchbase provided couchbase-java-client for low-level
access.
29. Lambda Architecture - What
• Batch layer - Historical archive of all data collected by the
system. Results are typically minutes to hours old.
• Speed layer - Compute analytics on data as it enters the
system with a sub-second latency. Dataset used for
analysis is zero to an hour old. Combine results from this
layer with those of batch layer for better decisions.
• Serving layer - Cache results from batch layer and
periodically refresh them.
30. Lambda Architecture - How
•Kafka in the outer core to ingest data and fan it out to
batch and speed layers.
•Batch layer - Batch query systems like Spark with
HDFS are a good fit here.
•Speed layer - This layer typically has queuing,
streaming and processing subsystems. Storm,
Cassandra.
•Serving layer - Redis would be a great fit here.
32. Collection and Storage - Log
• Fluentd - Log Collection
• The vanilla instance runs on 20-30MB of memory and can
process 13,000 events/second/core.
• 2000+ data driven companies already using it.
• Collect
• Resource and custom metrics
• Application / system logs for analysis
• Logs for archival
• Java API for logging
• Tail other logs and forward them using td-agent
• ElasticSearch - Log Storage
• Later different types of storage like S3, DB etc.
33. Collection and Storage - Metrics
• Collectd
• Collect system performance information - CPU utilization,
memory usage, disk usage etc.
• Use graphite plugin to send this data to Graphite server
• Statsd
• Capture different types of metrics: gauges, counters,
timing summary statistics, and sets.
• Client library send stats via UDP to StatsD daemon.
• StatsD daemon listens to the UDP traffic from all
application libraries, aggregates data over time and
flushes it at the desired interval to designated storage.
34. Visualization
• Graphite + Grafana
• Use graphite with Grafana as the graphing tool for
metrics and stats. One can save dashboards in
Grafana and load them to/from ElasticSearch.
• Kibana
• Kibana can be used to visualise and analyse any kind
of structured / unstructured data if it has been indexed
into ElasticSearch. Lots of ways of visualising and
slicing / dicing data.
36. Evaluation Criteria
• Idea is to introduce monitoring so that it could be supported and
monitored 24x7 with the hope of achieving minimal downtime.
• Scalable
• Can present large number of easy to understand checks.
• Can handle large no. of hosts and large no. of checks.
• UI
• Access to historical alerts.
• Ability to switch off alerts with comments.
• Easy to extend/change.
• Support custom checks.
• Ease of configuring alert thresholds.
• Good support for check dependencies.
• Cause and effect separation by having alert dependencies.
37. Options
• Sensu
• Local agents which push information to an AMQP broker. Various servers can now
ingest information from this broker. Weaker coupling and horizontal scaling. Central broker
is a SPOF and poses scaling challenges though.
• Icinga2
• Icinga 1 was a Nagios fork with a better UI but ran into some trademark/copyright
violations.
• Icinga2 is a complete rewrite. It can work in both modes: agents and central servers pulling
data.
• Ngios
• Nagios uses a group of central servers that are configured to perform checks on remote
hosts. This design makes it difficult to scale Nagios, as large fleets quickly reach the limit of
vertical scaling, and Nagios does not easily scale horizontally. Nagios is also notoriously
difficult to use with modern DevOps and configuration management tools, as local
configurations must be updated when remote servers are added or removed. Runs in a
loop and can use only one core.
• CloudWatch
• In-built features for monitoring AWS resources only. Send custom metrics yourself and then
it will be treated same from stats, graphs and alarms perspectives.
39. Redis
• In-memory data structure store.
• Can persist data, but keeps all data in-memory.
• Traditional data types.
• Stats
• Easily serves 100K’s of ops/sec.
• ~2 MB footprint.
• Mostly ACID
• Single-threaded, hence every operation is
• Atomic
• Consistent
• Isolated
• Watch / Multi / Discard / Exec allows multi-statement operations as as single unit but without rollbacks.
• Durability is configurable and is a tradeoff between safety and efficiency.
• Redis Cluster
• Redis 3.0 released on 5th May, 2015 (last week) introduces Redis Cluster.
• With automatic data sharding, fault tolerance and performance improvements.
• Alternatives: Memcached