Small Apartment Properties Form Core of Workforce Rental Demand In the Top Metros
•
0 likes•55 views

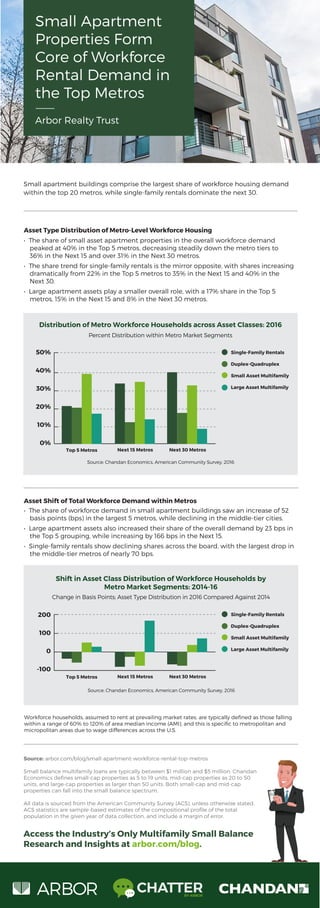
Small apartment buildings comprise the largest share of workforce housing demand within the top 20 metros, while single-family rentals dominate the next 30.
Recommended

Recommended
More Related Content
Similar to Small Apartment Properties Form Core of Workforce Rental Demand In the Top Metros
Similar to Small Apartment Properties Form Core of Workforce Rental Demand In the Top Metros (20)
More from Ivan Kaufman
More from Ivan Kaufman (15)
Recently uploaded
Recently uploaded (20)
Small Apartment Properties Form Core of Workforce Rental Demand In the Top Metros
- 1. Access the Industry’s Only Multifamily Small Balance Research and Insights at arbor.com/blog. BY ARBOR Source: arbor.com/blog/small-apartment-workforce-rental-top-metros Small balance multifamily loans are typically between $1 million and $5 million. Chandan Economics defines small-cap properties as 5 to 19 units, mid-cap properties as 20 to 50 units, and large-cap properties as larger than 50 units. Both small-cap and mid-cap properties can fall into the small balance spectrum. All data is sourced from the American Community Survey (ACS), unless otherwise stated. ACS statistics are sample-based estimates of the compositional profile of the total population in the given year of data collection, and include a margin of error. Shift in Asset Class Distribution of Workforce Households by Metro Market Segments: 2014-16 Asset Shift of Total Workforce Demand within Metros • The share of workforce demand in small apartment buildings saw an increase of 52 basis points (bps) in the largest 5 metros, while declining in the middle-tier cities. • Large apartment assets also increased their share of the overall demand by 23 bps in the Top 5 grouping, while increasing by 166 bps in the Next 15. • Single-family rentals show declining shares across the board, with the largest drop in the middle-tier metros of nearly 70 bps. Change in Basis Points; Asset Type Distribution in 2016 Compared Against 2014 Source: Chandan Economics, American Community Survey, 2016 Workforce households, assumed to rent at prevailing market rates, are typically defined as those falling within a range of 60% to 120% of area median income (AMI), and this is specific to metropolitan and micropolitan areas due to wage differences across the U.S. Top 5 Metros 200 100 0 -100 Next 15 Metros Next 30 Metros Single-Family Rentals Duplex-Quadruplex Small Asset Multifamily Large Asset Multifamily Asset Type Distribution of Metro-Level Workforce Housing • The share of small asset apartment properties in the overall workforce demand peaked at 40% in the Top 5 metros, decreasing steadily down the metro tiers to 36% in the Next 15 and over 31% in the Next 30 metros. • The share trend for single-family rentals is the mirror opposite, with shares increasing dramatically from 22% in the Top 5 metros to 35% in the Next 15 and 40% in the Next 30. • Large apartment assets play a smaller overall role, with a 17% share in the Top 5 metros, 15% in the Next 15 and 8% in the Next 30 metros. Distribution of Metro Workforce Households across Asset Classes: 2016 Percent Distribution within Metro Market Segments Single-Family Rentals Duplex-Quadruplex Small Asset Multifamily Large Asset Multifamily Top 5 Metros Source: Chandan Economics, American Community Survey, 2016 50% 40% 30% 20% 10% 0% Next 15 Metros Next 30 Metros Small Apartment Properties Form Core of Workforce Rental Demand in the Top Metros Arbor Realty Trust Small apartment buildings comprise the largest share of workforce housing demand within the top 20 metros, while single-family rentals dominate the next 30.