Olivier Desbarres - Right said fed
•Download as DOCX, PDF•
0 likes•91 views

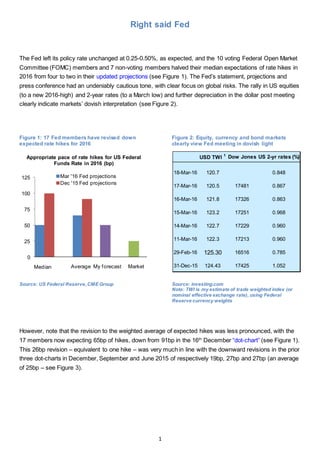
The Fed left its policy rate unchanged at 0.25-0.50%, as expected, and the 10 voting Federal Open Market Committee (FOMC) members and 7 non-voting members halved their median expectations of rate hikes in 2016 from four to two in their updated projections (see Figure 1). The Fed’s statement, projections and press conference had an undeniably cautious tone, with clear focus on global risks. The rally in US equities (to a new 2016-high) and 2-year rates (to a March low) and further depreciation in the dollar post meeting clearly indicate markets’ dovish interpretation (see Figure 2).

Recommended
Recommended
More Related Content
What's hot
What's hot (20)
Viewers also liked
Viewers also liked (20)
Similar to Olivier Desbarres - Right said fed
Similar to Olivier Desbarres - Right said fed (20)
Recently uploaded
Recently uploaded (20)
Olivier Desbarres - Right said fed
- 1. 1 Right said Fed The Fed left its policy rate unchanged at 0.25-0.50%, as expected, and the 10 voting Federal Open Market Committee (FOMC) members and 7 non-voting members halved their median expectations of rate hikes in 2016 from four to two in their updated projections (see Figure 1). The Fed’s statement, projections and press conference had an undeniably cautious tone, with clear focus on global risks. The rally in US equities (to a new 2016-high) and 2-year rates (to a March low) and further depreciation in the dollar post meeting clearly indicate markets’ dovish interpretation (see Figure 2). Figure 1: 17 Fed members have revised down expected rate hikes for 2016 Figure 2: Equity, currency and bond markets clearly view Fed meeting in dovish light Source: US Federal Reserve,CME Group Source: investing.com Note: TWI is my estimate of trade weighted index (or nominal effective exchange rate), using Federal Reserve currency weights However, note that the revision to the weighted average of expected hikes was less pronounced, with the 17 members now expecting 65bp of hikes, down from 91bp in the 16th December “dot-chart” (see Figure 1). This 26bp revision – equivalent to one hike – was very much in line with the downward revisions in the prior three dot-charts in December, September and June 2015 of respectively 19bp, 27bp and 27bp (an average of 25bp – see Figure 3). 0 25 50 75 100 125 Mar '16 Fed projections Dec '15 Fed projections Appropriate pace of rate hikes for US Federal Funds Rate in 2016 (bp) Median Average My forecast Market USD TWI 1 Dow Jones US 2-yr rates (%) 18-Mar-16 120.7 0.848 17-Mar-16 120.5 17481 0.867 16-Mar-16 121.8 17326 0.863 15-Mar-16 123.2 17251 0.968 14-Mar-16 122.7 17229 0.960 11-Mar-16 122.3 17213 0.960 29-Feb-16 125.30 16516 0.785 31-Dec-15 124.43 17425 1.052
- 2. 2 Figure 3: FOMC members have systematically revised down their Fed funds forecasts Source: Fed Board of Governors economic projections April meeting could see Fed starting to gently prep markets for June hike The Fed’s tendency in recent years to over-estimate the need for rate hikes begs the question of whether it will have to further cut back on its expected and actual rate hikes this year. The Fed’ accompanying statement yesterday left much wiggle-room to leave rates on hold on 15th June should domestic and/or international conditions deteriorate. The market certainly thinks the Fed is still being overly-hawkish, pricing in only 11bp of hikes in June (or a 44% probability of a 25bp hike) and one full hike this year. However, I think the Fed is ultimately trying to put itself in the best position to benefit from its preferred course of further modest rate hikes later this year while minimising the costs to the domestic economy and potential damage to the global economy and markets. I expect the Fed, at its 27th April policy meeting, to start tentatively preparing the ground for a hike on 15th June. Precedent suggests that the Fed would be reluctant to only deliver a single-hike this year and I would expect a second hike in H2 2016, in line with the 17 Fed members’ current median expectation of 50bp of hikes in 2016. By the April meeting, the Fed will have March employment and ISM figures and February income, spending, trade and durable goods orders data, which should give it a fair idea of how real GDP fared in Q1 (the advance estimate is out the day after the Fed meeting – see Figure 4). The Fed will want to see a growth recovery in productivity, exports, and the manufacturing and services sectors after seasonally- adjusted GDP growth halved in Q4 2015 to 1.0% quarter-on-quarter annualised. 0.0 0.5 1.0 1.5 2.0 2.5 3.0 3.5 4.0 end-2015 end-2016 end-2017 Dec 2014 projections March 2015 projections June 2015 projections Sept 2015 projections Dec 2015 projections March 2016 projections Weighted average of appropriate target level for the US federal funds rate (%) 2.54% 1.02% 3.47% 2.04%
- 3. 3 Figure 4: Key data and events ahead of April and June Fed policy meetings Source: BBC, ECB, investing.com, US Bureau of Economic Analysis, US Federal Reserve Importantly, the Fed will be able to assess its theory that the lagged dampening effect of low oil prices and a strong dollar may temporarily derail the four-month rise in core inflation to 2.3% yoy in February and in the core PCE price index to 1.7% yoy in January. A rebound in GDP growth and extension of the inflationary trend – my core scenario – would make it easier for the Fed to refocus the market’s attention on the reasonably buoyant US labour market and income growth, robust credit growth and a housing market gathering steam, as highlighted in Figure 5 (see Fed – this is what it sounds like when doves cry, 8 March 2016). 28-Mar US core PCE index (February) 28-Mar US goods exports and imports (February) 28-Mar US personal income & spending (February) 01-Apr US non-farm payrolls (March) 01-Apr US manufacturing ISM (March) 01-Apr Global manufacturing PMI (March) 13-Apr US PPI-inflation (March) 14-Apr US CPI-inflation (March) 21-Apr ECB policy meeting 24-Apr US core durable goods orders (February) 27-Apr US FOMC meeting 28-Apr US Q1 2016 GDP (advance estimate) 28-Apr US core PCE index (March) 06-May US non-farm payrolls (April) 27-May US Q1 2016 GDP (second estimate) 02-Jun OPEC meeting 02-Jun ECB policy meeting 15-Jun US FOMC meeting 23-Jun UK EU referendum
- 4. 4 Figure 5: US and global macro heat-map paints a nuanced picture Variable Unit 3-month average prior 16 Dec Fed meeting Average, past 3 months GDP 3m/3m SAAR1 2.0 (Q3 final) 1.0 (Q4 2nd estimate) Labor productivity2 3m/3m SAAR 2.0 -2.2 Global GDP growth3 % year-on-year 3.0 2.8 Global manufacturing PMI Index, seasonally adjusted 51.0 50.5 Global manufacturing PMI Index, seasonally adjusted 51.2 (November 2015) 50.0 (February 2016) Global services PMI Index, seasonally adjusted 53.6 52.2 Global services PMI Index, seasonally adjusted 53.9 (November 2015) 50.7 (February 2016) CPI-inflation % year-on-year 0.1 1.0 Core CPI-inflation % year-on-year 1.9 2.2 PCE4 price index % year-on-year 0.2 0.8 Core PCE price index % year-on-year 1.3 1.5 Market-based PCE price index % year-on-year 0.0 0.6 Core Market-based PCE price index% year-on-year 1.1 1.4 PPI-inflation % year-on-year -1.2 -0.4 5-year breakeven inflation rate % 1.21 1.19 Crude oil Brent, US dollars per barrel 46.5 34.8 House prices (Case-Shiller) % year-on-year 4.6 5.2 Total5 % year-on-year 6.9 6.6 Revolving % year-on-year 7.8 7.1 Non-revolving % year-on-year 4.4 5.2 Personal income Current prices, % year-on-year 4.4 4.1 Personal income Current prices, 3m/3m SAAR 3.5 3.6 Personal disposable income Current prices, % year-on-year 3.8 3.7 Personal disposable income Current prices, 3m/3m SAAR 3.6 3.2 Wages & salaries Current prices, % year-on-year 4.5 4.2 Wages & salaries Current prices, 3m/3m SAAR 3.2 4.9 Private nonfarm hourly earnings Current prices, % year-on-year 2.4 2.5 Private nonfarm weekly earnings Current prices, % year-on-year 2.3 2.2 Unemployment rate % of labour force, SA6 5.0 4.9 Participation rate %, SA6 62.5 62.7 Nonfarm payrolls Thousands, SA6 241.3 228.3 PCE Current prices, % year-on-year 3.2 3.5 PCE Current prices, 3m/3m SAAR 3.1 3.0 Retail sales Current prices, % year-on-year 1.9 2.5 Retail sales Current prices, 3m/3m SAAR 1.8 1.9 Industrial output % year-on-year 0.8 -1.2 Industrial output 3m/3m SAAR 1.9 -2.7 Manufacturing ISM Index 49.3 48.6 Non-manufacturing ISM Index 57.2 54.2 Durable goods orders % year-on-year -1.8 0.7 Durable goods orders 3m/3m SAAR -0.2 -2.1 Core capital goods orders7 % year-on-year -4.4 -4.1 Core capital goods orders 3m/3m SAAR 3.3 -6.6 Exports % year-on-year -9.5 -10.3 Exports 3m/3m SAAR -8.4 -16.3 Imports % year-on-year -6.1 -7.3 Imports 3m/3m SAAR -1.2 -13.6 US Dollar Trade weighted index8 121.4 125.1 US Dollar % change on previous 3 months 2.3 3.1 US Dow Jones Index 17284 16657 US Dow Jones % change on previous 3 months -0.3 -3.7 MSCI World Equity Index 402.0 378.4 MSCI World Equity % change on previous 3 months -3.3 -5.9 Currency& equities PricesGrowthIndustry&ServicesInflation Income,wagesand earnings Labour market ConsumptionCredit Goods trade
- 5. 5 Source: US Bureau of Economic Analysis, US Bureau of Labor Statistics, United States Census Bureau, Federal Reserve Bank of St Louis, IMF, investing.com, Markit/JP Morgan, MSCI, S&P/Case-Shiller Note: 1. Seasonally-adjusted annualized rate; 2. Nonfarm business sector; 3. Estimate using IMF methodology; 4. Personal Consumption Expenditure; 5. Outstanding consumer credit; 6. Seasonally-adjusted; 7. Non-defense capital goods orders excluding aircrafts; 8. My estimate,23 April = 100 The global picture has come into sharp focus for Fed The global perspective, which can be broken down into two sub-components, clearly weighed heavily on the Fed’s thinking. First, economic growth in the economies of the US’ main trading partners, including China, the eurozone, Japan, UK and Brazil likely slowed in recent months based on the fall, in some cases quite sharp, in manufacturing and services PMI in February (global PMI data for March are due on 1 April). The fall in energy prices and global equities in January-February was certainly partly to blame and this takes us to the second component of the global picture – the impact of US monetary policy on global markets and economies going forward. The dovish argument is that the Fed needs to keep rates on hold in order to keep the dollar under control and further spur global energy and equity prices and ultimately put a floor under global growth. The Fed itself seemingly doubts whether the recent rally in global energy prices and equity markets, after a very volatile few months, and dollar depreciation will extend or reverse. Figure 6: A very, very simplified chart of what is driving Fed’s overt cautiousness Source: www.olivierdesbarres.co.uk Policy divergence… and the beginning of currency convergence US Federal Reserve Interest rates and US dollar (monetary conditions) Global economy (slowing growth, risk of deflation) Global markets (energy prices, equities) Domestic economy (core inflation...)
- 6. 6 Doves also argue that the Fed should be weary of hiking rates, or even signalling possible hikes, when other major central banks are cutting and in the case of the Bank of Japan (BoJ) and European Central Bank (ECB) pushing ahead with quantitative easing (QE). But the interest rate policy divergence since the Fed’s December hike, along with stronger global energy prices, has actually been associated with a degree of exchange rate convergence (see Figure 7). The net effect is that monetary conditions – the product of interest and exchange rates – have been reasonably stable in major economies. Specifically: The dollar nominal effective exchange rate (NEER) is down 3.2% since the 16th December Fed meeting. The yen NEER has appreciated nearly 10% since early December, despite the BoJ’s attempt to loosen monetary policy to sustain economic growth. The euro NEER has been remarkably stable in the past six years, despite the ECB taking policy rates into negative territory and expanding its QE program. The sterling NEER, which had appreciated throughout 2015, has given up all of its gains and more this year. Yields are also broadly back to early 2015 levels, implying that UK monetary conditions are currently not much different from 15 month ago. Commodity currencies, which had been depressed in both developed economies (Australia and Canada) and emerging economies (Brazil, Indonesia and Malaysia) have been edging stronger. Figure 7: Nominal effective exchange rates have started to converge… Source: Bank of England, BIS, US Federal Reserve,investing.com 40 50 60 70 80 90 100 110 120 130 140 150 Apr 10 Sep 10 Feb 11 Jul 11 Dec 11 May 12 Oct 12 Mar 13 Aug 13 Jan 14 Jun 14 Nov 14 Apr 15 Sep 15 Feb 16 JPY USD EUR GBP CNY AUD CAD BRL MYR IDR Divergence Convergence?Pack hunting Differentiation & EM (exc CNY) weakness
- 7. 7 This “currency convergence” has admittedly not been uniform. Economic, political and geopolitical considerations are still hampering the Mexican Peso, Russian Rouble, South Africa rand Turkish Lira, while the Swiss Franc has unwound only half of its January 2015 revaluation (see Figure 8). Figure 8: …but still some outliers Source: Bank of England, BIS, US Federal Reserve,investing.com Moreover, this currency convergence is still in its infancy and if the Fed mishandles or mistimes its hiking process – however gradual – the dollar could recover while global energy and equity prices weaken, causing volatility in global markets and damaging other economies which would in turn impede the US economy’s recovery. So the Fed will be hoping that data in coming weeks are strong enough for it to start preparing the markets for a June hike, without spooking equity or energy markets like it did in January, and that it can eventually deliver a “dovish hike” which will not interrupt the dollar’s downtrend. It’s a tough balancing act – if the Fed leaves it too late the market may not have time to digest a 180 degree turnabout from dovish to hawkish. 40 50 60 70 80 90 100 110 120 130 140 150 Apr 10 Sep 10 Feb 11 Jul 11 Dec 11 May 12 Oct 12 Mar 13 Aug 13 Jan 14 Jun 14 Nov 14 Apr 15 Sep 15 Feb 16 CHF ZAR TRY RUB Divergence Convergence?Pack hunting Differentiation & EM (exc CNY) weakness