Download as PDF, PPTX

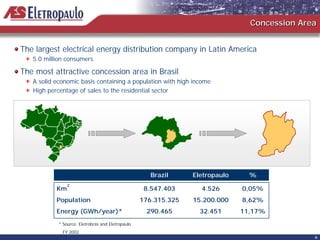
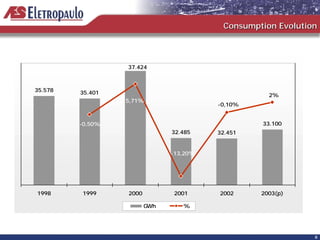
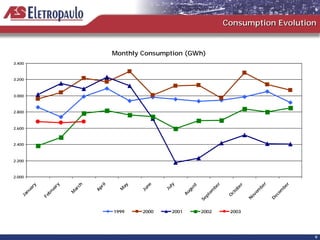
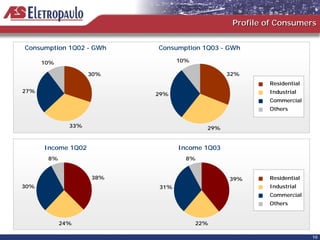

The document summarizes Eletropaulo's first quarter 2003 results. It provides an overview of the company, noting it is Brazil's largest electricity distributor serving over 5 million consumers. It reviews the energy distribution market and Eletropaulo's operational performance, including increased consumption and changes in consumer profiles. Financial indicators and the regulatory scenario are also examined.


