Download as PDF, PPTX
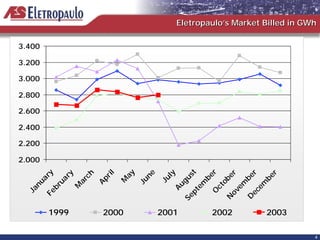
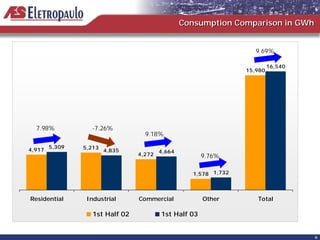
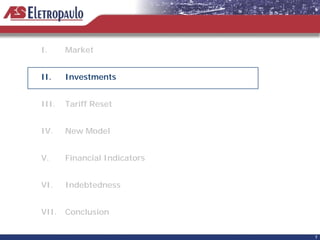
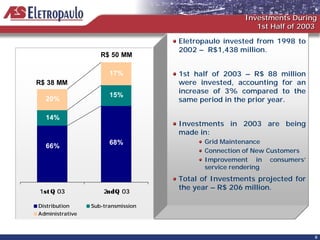
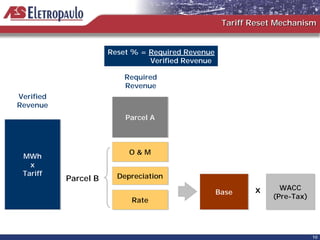
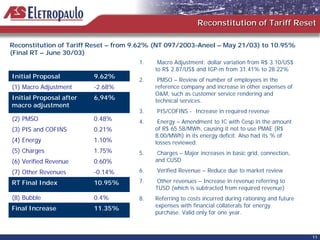
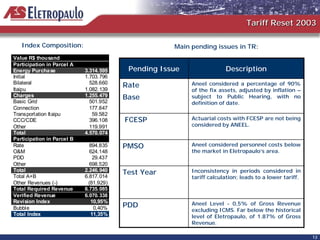
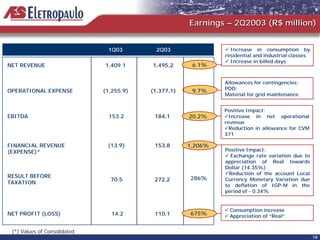


This document summarizes Eletropaulo's 2nd quarter 2003 earnings presentation. It discusses key topics like the company's market performance, investments, tariff reset process, and financial indicators. Consumption increased 9.69% compared to the prior year, with investments of R$88 million in the 1st half of 2003. The initial proposed tariff reset of 9.62% was adjusted to 10.95% after considering various factors in Eletropaulo's required revenue calculation. Key pending issues in the tariff reset included determining the asset base, actuarial costs, operating expenses, and the test year used.


