Download to read offline
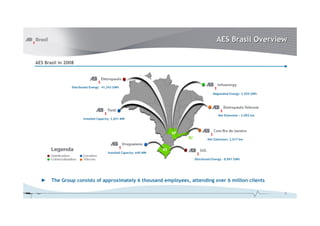
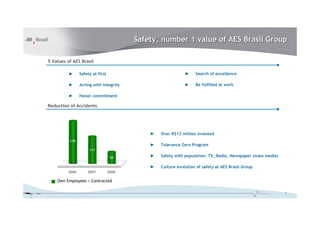
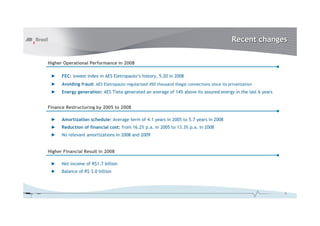
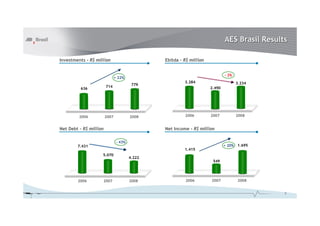

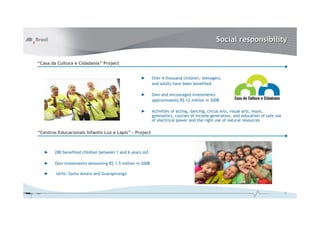
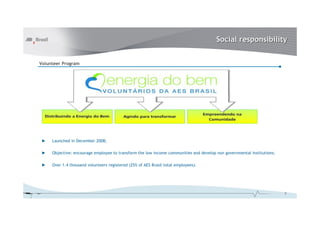

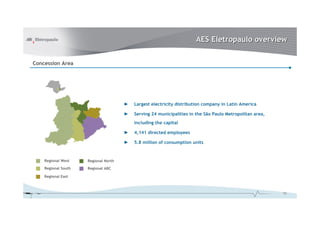

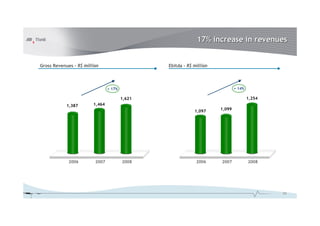
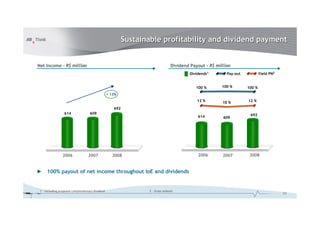
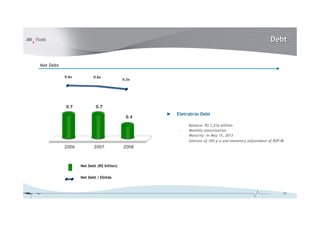

This document provides an overview of AES Brasil for 2008. It discusses the following key points: - AES Brasil has over 6,000 employees serving over 6 million customers across its distributed energy, negotiated energy, and installed capacity totals. - Safety is the top value at AES Brasil. Investments in safety programs have helped reduce accidents from 178 in 2006 to 111 in 2008. - AES Brasil saw improved operational and financial performance in 2008, with higher EBITDA, net income, and dividends while continuing to reduce debt levels. - The company remains focused on social responsibility programs in areas like education, culture, and volunteer initiatives.


