Application of panel data to the effect of five (5) world development indicators (wdi) on gdp per capita of twenty (20) african union (au) countries (1981 2011)
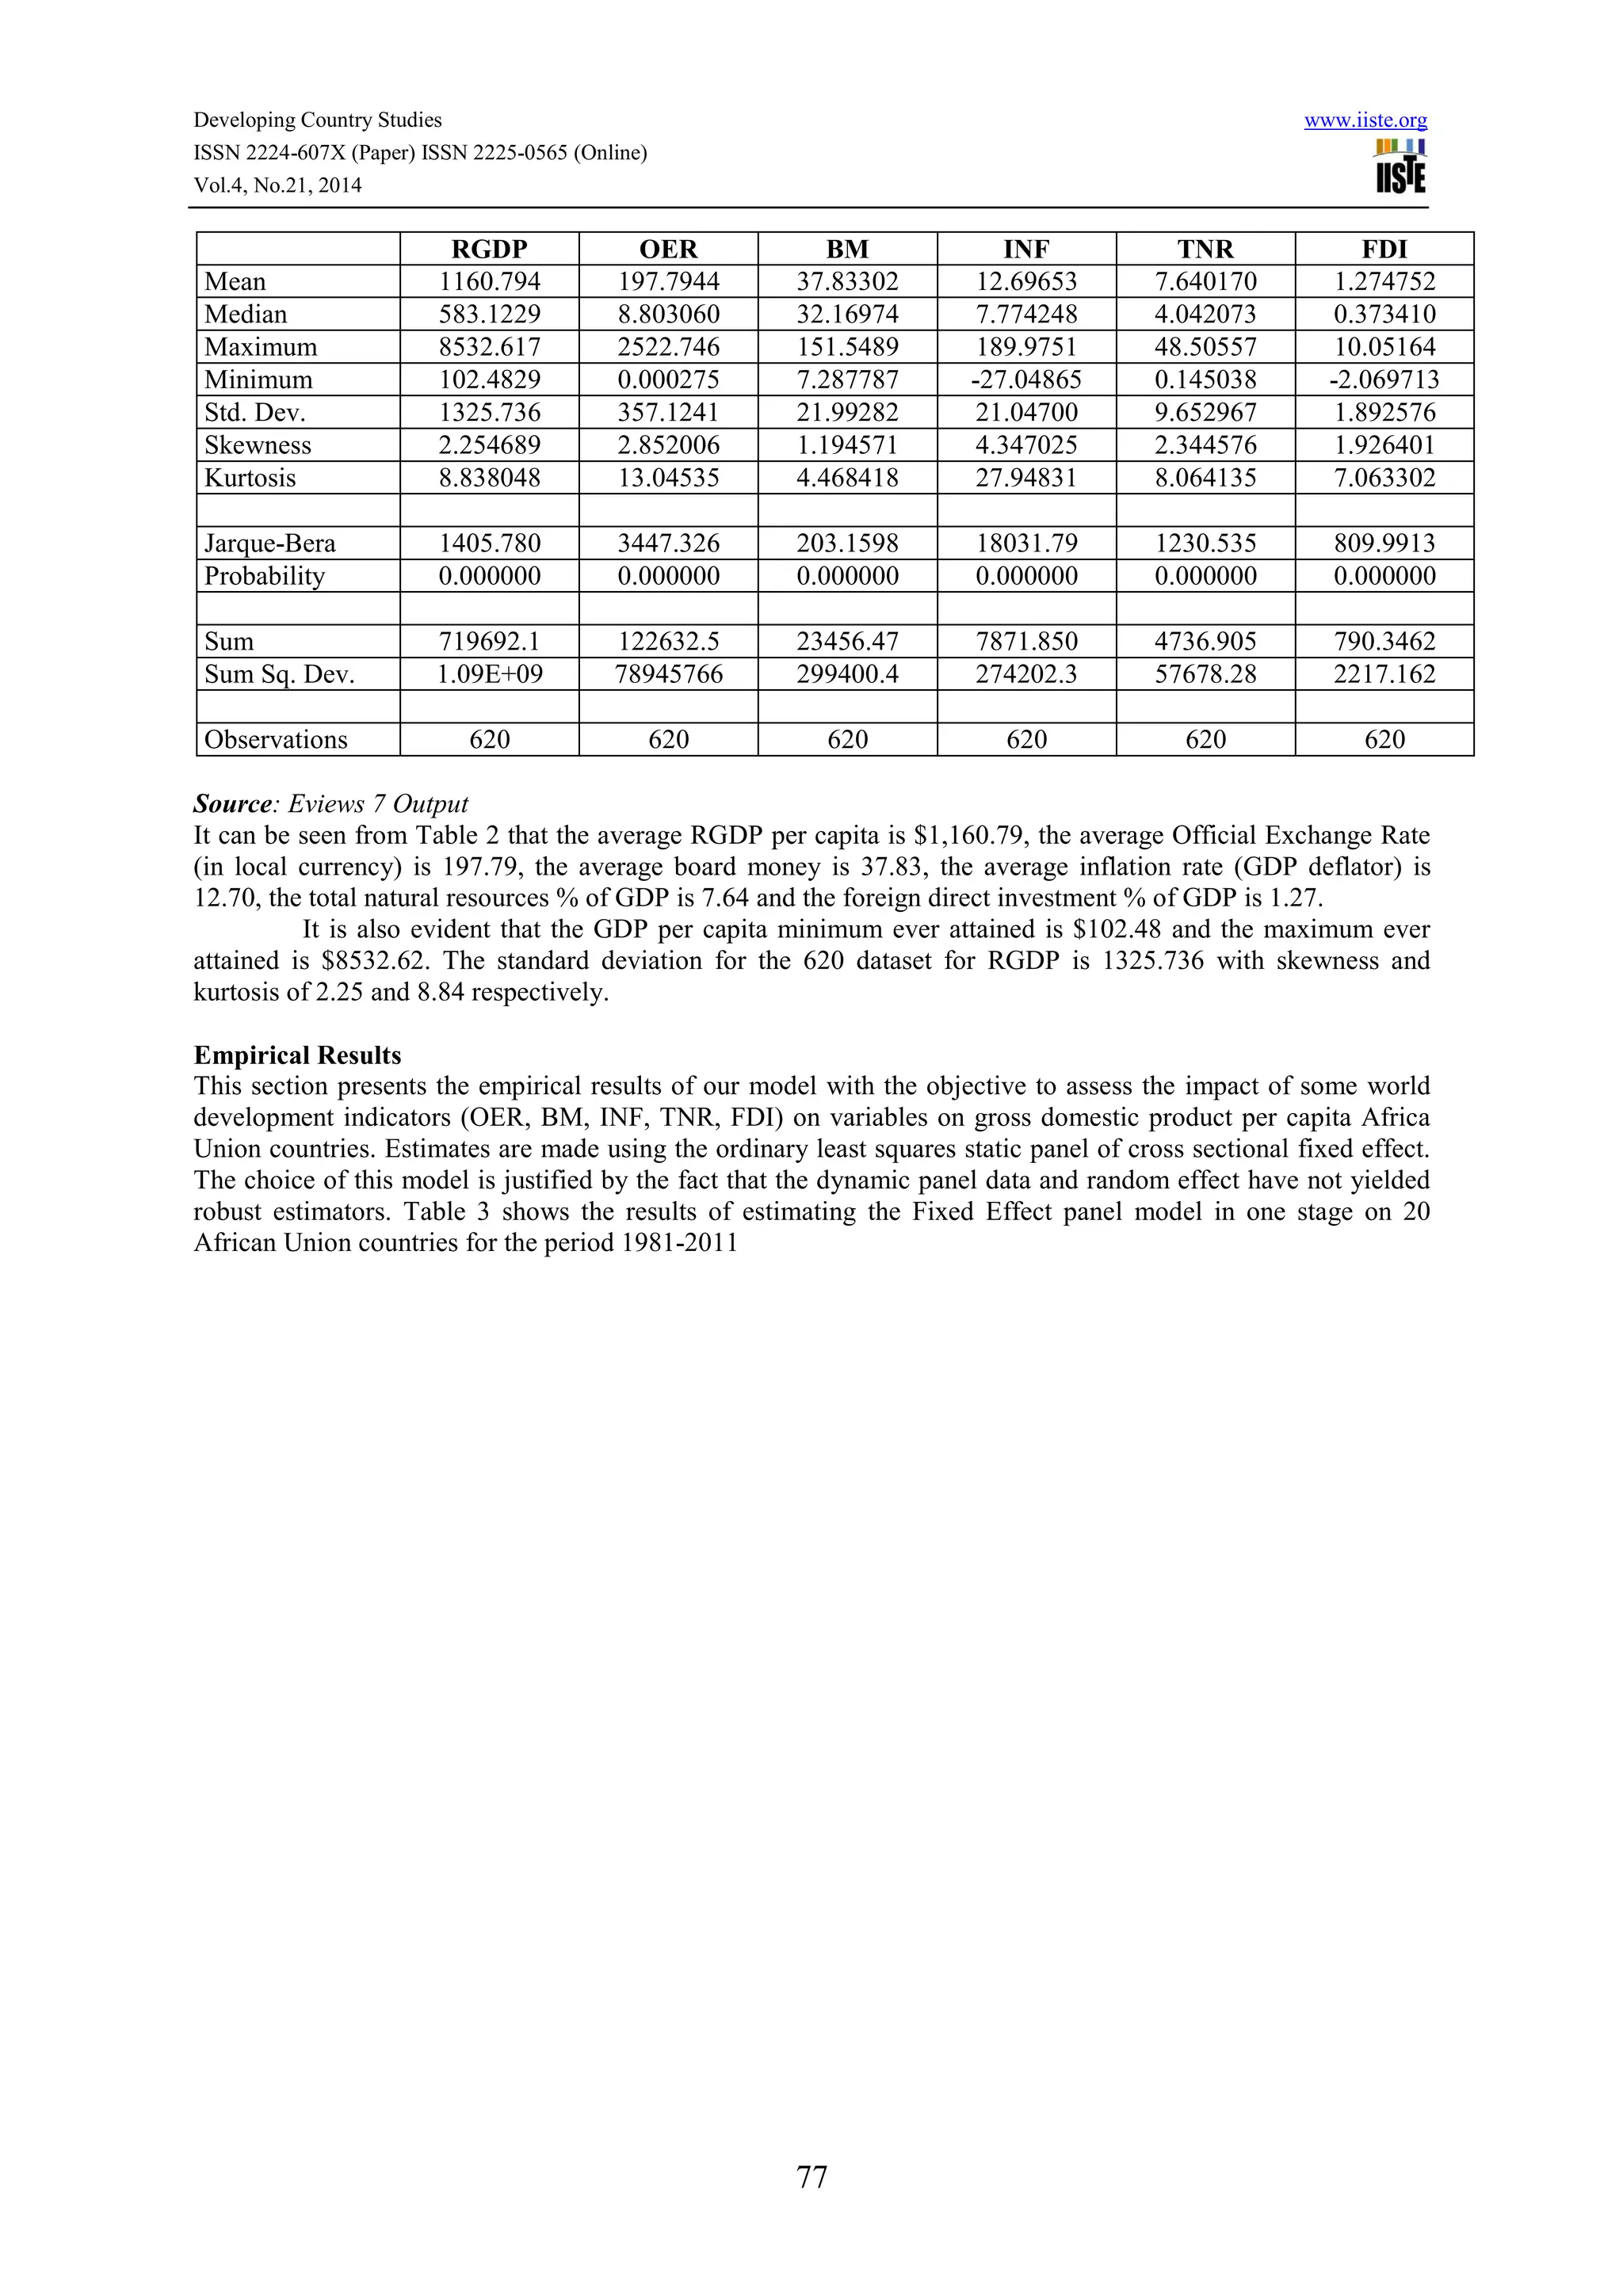
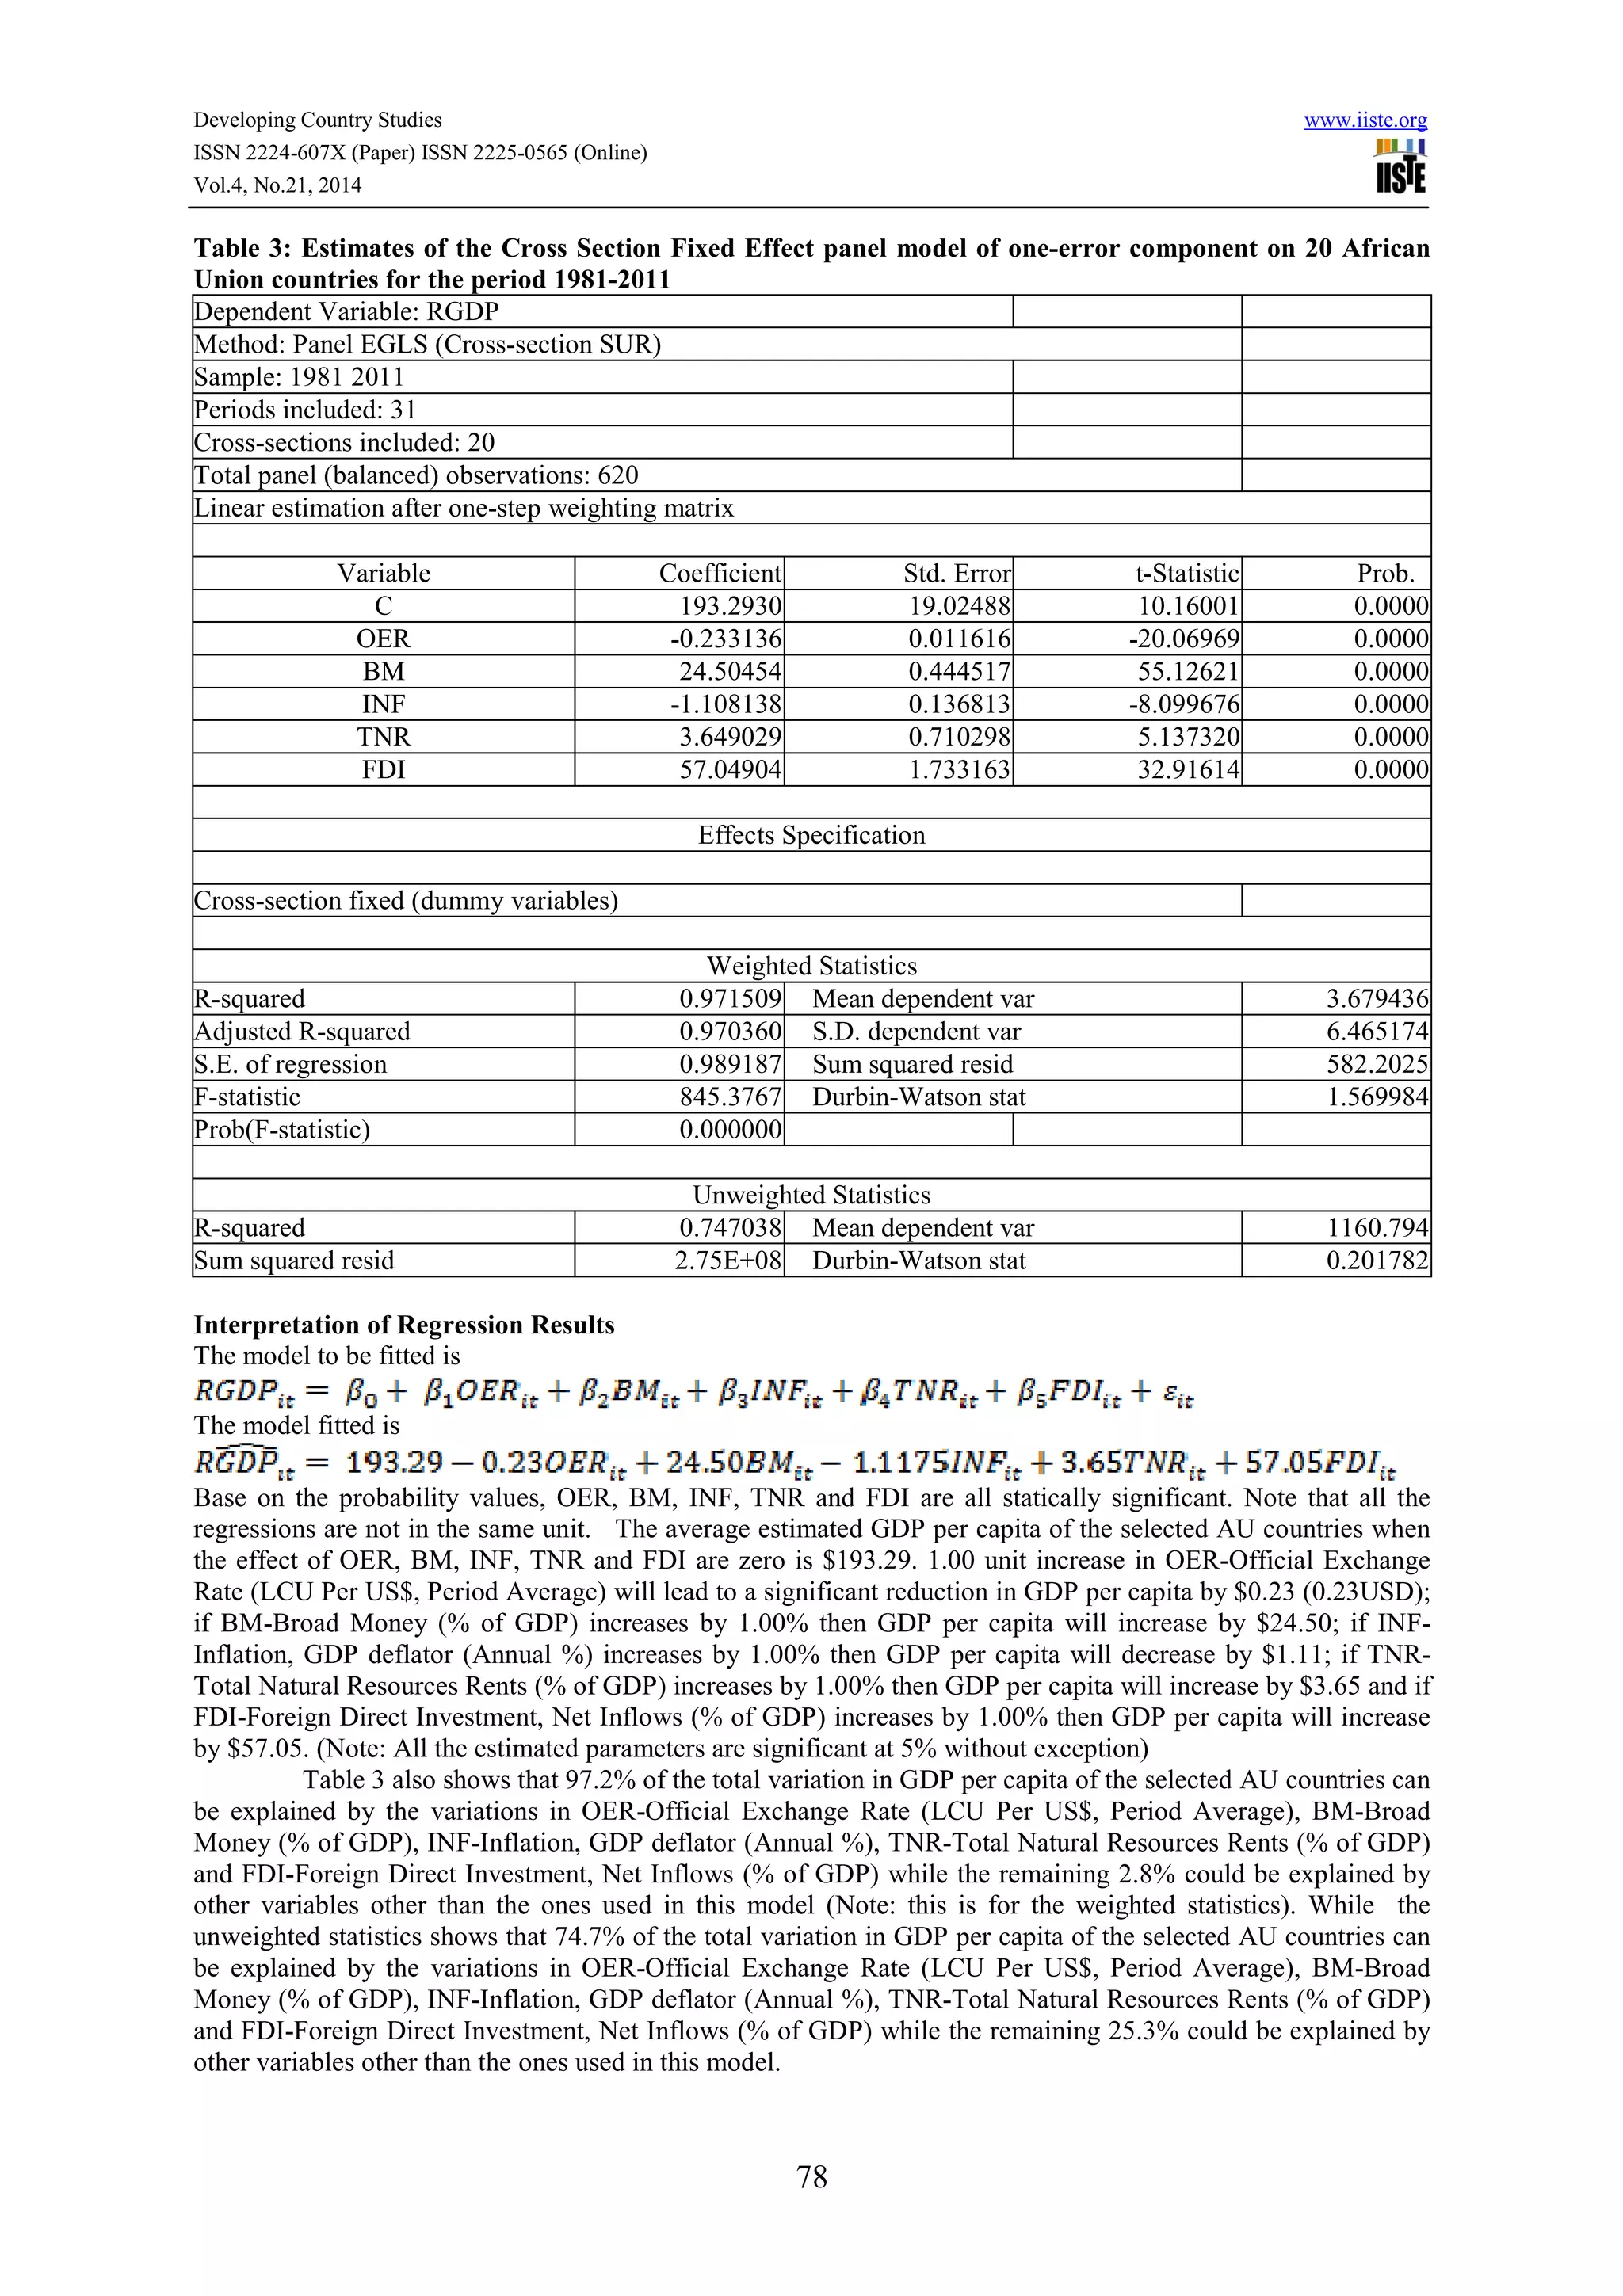
This document discusses the application of panel data analysis to examine the effect of 5 world development indicators (WDI) on GDP per capita for 20 African Union countries from 1981 to 2011. It presents the panel data model, describes the methodology used as fixed effects regression, and provides sample output of the panel data format and regression results. The key world development indicators examined are official exchange rate, broad money, inflation rate, total natural resources rents, and foreign direct investment.
Hybrid model for forecasting space-time data with calendar variation effectsTELKOMNIKA JOURNAL
The aim of this research is to propose a new hybrid model, i.e. Generalized Space-Time
Autoregressive with Exogenous Variable and Neural Network (GSTARX-NN) model for forecasting
space-time data with calendar variation effect. GSTARX model represented as a linear component with
exogenous variable particularly an effect of calendar variation, such as Eid Fitr. Whereas, NN was a model
for handling a nonlinear component. There were two studies conducted in this research, i.e. simulation
studies and applications on monthly inflow and outflow currency data in Bank Indonesia at East Java
region. The simulation study showed that the hybrid GSTARX-NN model could capture well the data
patterns, i.e. trend, seasonal, calendar variation, and both linear and nonlinear noise series. Moreover,
based on RMSE at testing dataset, the results of application study on inflow and outflow data showed that
the hybrid GSTARX-NN models tend to give more accurate forecast than VARX and GSTARX models.
These results in line with the third M3 forecasting competition conclusion that stated hybrid or combining
models, in average, yielded better forecast than individual models.
The document provides an introduction to panel data analysis. It defines time series data, cross-sectional data, and panel data, which combines the two. Panel data has advantages over single time series or cross-sectional data like more observations, capturing heterogeneity and dynamics. Panel data can be balanced or unbalanced, and micro or macro. The document demonstrates structuring panel data in Excel for empirical analysis in Eviews, including an activity to arrange time series data into a panel data format.
A Review on Non Linear Dimensionality Reduction Techniques for Face Recognitionrahulmonikasharma
Principal component Analysis (PCA) has gained much attention among researchers to address the pboblem of high dimensional data sets.during last decade a non-linear variantof PCA has been used to reduce the dimensions on a non linear hyperplane.This paper reviews the various Non linear techniques ,applied on real and artificial data .It is observed that Non-Linear PCA outperform in the counterpart in most cases .However exceptions are noted.
Design and implementation of three dimensional objects in database management...eSAT Journals
Abstract The idea of this research is to incorporate three-dimensional information into relational database management system and hence
implementation in geographical information system and computer aided design. This is because; database management system
has inadequate resource to preserve three-dimensional information. On the other hand, there are a lot of potential applications
that would be greatly benefited utilizing three-dimensional data. As there is no currently available three-dimensional data type
therefore this research leads to identify the three-dimensional objects and develop the data type accordingly.
Keywords: Database Management System (DBMS); Three-Dimensional (3D); Geographical Information System
(GIS); Geo-DBMS; Computer Aided Design (CAD)
A new-quantile-based-fuzzy-time-series-forecasting-modelCemal Ardil
The document presents a new quantile based fuzzy time series forecasting model. It begins by reviewing existing fuzzy time series forecasting methods and their applications. It then proposes a new method that bases forecasts on predicting future trends in the data using third order fuzzy relationships. The method converts statistical quantiles into fuzzy quantiles using membership functions. It uses a fuzzy metric and trend forecast to calculate future values. The method is applied to TAIFEX index forecasting. Results show the proposed method performs comparably better than other fuzzy time series methods in terms of complexity and forecasting accuracy.
This document describes a methodology for creating dynamic crowding maps using mobile phone data to estimate population exposure during floods. It involves the following steps:
1) Applying Histogram of Oriented Gradients (HOG) to reduce high-dimensional mobile phone user data and cluster similar days.
2) Functionally clustering daily density profiles (DDP) of mobile phone users over time to group days with similar patterns.
3) Estimating total population exposed ("city users") by spatially matching mobile phone and census data to correct for market share.
4) Visualizing representative daily profiles for clusters using functional box plots of DDP trends over time.
The method is applied to a case study area
This document provides an overview of common quantitative data summarization techniques taught in a statistics course, including histograms, polygons, stem-and-leaf plots, and ogives. Histograms and polygons are used to graphically summarize frequency distributions through bar charts and line graphs. Stem-and-leaf plots organize raw data to show the shape of a distribution. Ogives graph cumulative relative frequencies to illustrate the proportion of data values below certain points. Examples are provided and steps are outlined for constructing each type of graphical summary.
ACCOST is a method for differential analysis of Hi-C data between two conditions with replicates. It models Hi-C interaction counts with a negative binomial distribution that accounts for distance effects between loci through an offset term. ACCOST normalizes counts with ICE and estimates model parameters to obtain a p-value for each bin pair comparing the two conditions. It was validated on several datasets and shown to identify more differential contacts than other methods like diffHic and FIND, particularly at short genomic distances.
Reproducibility and differential analysis with selfishtuxette
Selfish is a Python tool for identifying differentially interacting chromatin regions from Hi-C contact maps of two conditions with no replicates. It begins by distance-correcting the interaction frequencies. It then computes Gaussian filters over neighboring bins to capture spatial dependencies. It compares the evolution of these filters between conditions and assigns p-values assuming Gaussian differences. Selfish is faster than existing methods and shows enrichment for epigenetic markers near differential regions. However, its statistical justification could be improved as it does not model overdispersion like other methods.
Reconstruction of Time Series using Optimal Ordering of ICA Componentsrahulmonikasharma
This document summarizes research investigating the application of independent component analysis (ICA) and optimal ordering of independent components to reconstruct time series generated by mixed independent sources. A modified fast neural learning ICA algorithm is used to obtain independent components from observed time series. Different error measures and algorithms for determining the optimal ordering of independent components for reconstruction are compared, including exhaustive search, using the L-infinity norm of components, and excluding the least contributing component first. Experimental results on artificial and currency exchange rate time series support using the Euclidean error measure and minimizing the error profile area to obtain the optimal ordering. Reconstructions with only the first few dominant independent components are often acceptable.
The document discusses best practices for creating graphical data presentations. It provides 3 key principles:
1. The purpose of graphical data presentation is to communicate information clearly and accurately. Charts should show data variation and avoid distractions.
2. Expert sources like Edward Tufte and William Cleveland emphasize clarity, integrity, and maximizing the data-ink ratio. Labels should be comprehensive and graphics must represent quantitative values proportionally.
3. Tufte's principles of graphical excellence include showing the data, erasing non-data ink, and revising to maximize clarity. Graphs should prioritize revealing patterns and stories in the data over entertainment.
This document discusses graphing techniques for categorical and compositional data in Stata. It begins with explaining a "stacking trick" for binary responses that involves generating a new variable which vertically stacks points in bars to address overplotting when there are many ties. The document then covers bar charts and related displays for cross-tabulations of categorical data, as well as plots for cumulative distributions of ordinal data. Finally, it explains triangular plots for visualizing three-way compositions where categories sum to 100%.
The document discusses the application of S-shaped logistic growth curves for technological forecasting. It provides definitions for key terms related to logistic growth curves, including parameters like the asymptotic limit (κ), growth rate (α), and midpoint time (β). An example is given fitting an S-curve to past data on TRIZ publications to estimate parameters and potentially extrapolate future trends. The document advocates that S-curves can provide accurate forecasts if fitted quantitatively to sufficient past data rather than drawn arbitrarily. It also discusses using knowledge of limiting resources and causal factors when data is limited.
The document provides instructions for conducting a study to test and verify a research model examining the relationships between total quality management (TQM), technology/R&D management (TIM), quality performance (QUAL), product development innovation (PDIN), and process innovation capability (PCIN) in firms located in Vietnam. Specifically, the researcher is asked to: [1] Describe the data and assess construct reliability; [2] Use ANOVA to test for mean differences between respondent positions; [3] Examine correlations between constructs; [4] Conduct exploratory factor analysis on independent variables; and [5] Use regression analysis to model the relationships between TQM, TIM, and the dependent variables. Results are to be summarized in
This research paper is a statistical comparative study of a few average case asymptotically optimal sorting algorithms namely, Quick sort, Heap sort and K- sort. The three sorting algorithms all with the same average case complexity have been compared by obtaining the corresponding statistical bounds while subjecting these procedures over the randomly generated data from some standard discrete and continuous
probability distributions such as Binomial distribution, Uniform discrete and continuous distribution and Poisson distribution. The statistical analysis is well supplemented by the parameterized complexity analysis.
This document provides an overview of key mathematical concepts relevant to machine learning, including linear algebra (vectors, matrices, tensors), linear models and hyperplanes, dot and outer products, probability and statistics (distributions, samples vs populations), and resampling methods. It also discusses solving systems of linear equations and the statistical analysis of training data distributions.
Modeling cross-sectional correlations between thousands of stocks, across countries and industries, can be challenging. In this paper, we demonstrate the advantages of using Hierarchical Principal Component Analysis (HPCA) over the classic PCA. We also introduce a statistical clustering algorithm for identifying of homogeneous clusters of stocks, or “synthetic sectors”. We apply these methods to study cross-sectional correlations in the US, Europe, China, and Emerging Markets.
This document provides an introduction to descriptive statistics. It discusses organizing and presenting both qualitative and quantitative data. For qualitative data, it describes frequency distribution tables, relative frequencies, percentages, and graphs like bar charts and pie charts. For quantitative data, it covers stem-and-leaf displays, frequency distributions, class widths and midpoints, relative frequencies and percentages. It also discusses histograms for presenting grouped quantitative data. Examples are provided to illustrate these concepts and techniques.
This document summarizes a presentation on statistical clustering, hierarchical PCA, and their applications to portfolio management. It introduces PCA and how the first principal component/eigenportfolio can represent the market portfolio. It then describes hierarchical PCA, which partitions assets into clusters and allows for different correlations between and within clusters. The document provides examples analyzing global stock markets with hierarchical PCA. It also describes an algorithm for statistically generating clusters rather than using predefined classifications. Finally, it discusses applications of statistical clustering and hierarchical PCA models to portfolio optimization and mean-variance analysis.
The document describes a recursive algorithm for multi-step prediction with mixture models that have dynamic switching between components. It begins by introducing notations and reviewing individual models, including normal regression components and static/dynamic switching models. It then presents the mixture prediction algorithm, first for a static switching model by constructing a predictive distribution from weighted component predictions. For a dynamic switching model, it similarly takes point estimates from the previous time and substitutes them into components to make weighted averaged predictions over multiple steps. The algorithm is summarized as initializing component statistics and parameter estimates, then substituting previous estimates into components to obtain weighted mixture predictions for new data points.
Forecasting of electric consumption in a semiconductor plant using time serie...Alexander Decker
This document summarizes a study that used time series methods to forecast electricity consumption in a semiconductor plant. The study analyzed 36 months of historical electricity consumption data from 2010-2012 to select the best forecasting model. Single exponential smoothing was found to have the lowest Mean Absolute Percentage Error (MAPE) of 5.60% and was determined to be the best forecasting method. The selected model will be used to forecast future electricity consumption for the plant.
Options on Quantum Money: Quantum Path- Integral With Serial ShocksAM Publications,India
The author previously developed a numerical multivariate path-integral algorithm, PATHINT, which has been applied to several classical physics systems, including statistical mechanics of neocortical interactions, options in financial markets, and other nonlinear systems including chaotic systems. A new quantum version, qPATHINT, has the ability to take into account nonlinear and time-dependent modifications of an evolving system. qPATHINT is shown to be useful to study some aspects of serial changes to systems. Applications to options on quantum money and blockchains in financial markets are discussed.
This document discusses various methods for interpolating geofield parameters to model the surface of geofields. It analyzes methods like algebraic polynomials, filters, splines, kriging and neural networks. It then focuses on using neural networks to identify parameters for a mathematical model of a geofield by training the network parameters using experimental statistical data. As a result, it finds parameters for a regression equation that satisfy the training data. The application of neural networks is shown to have advantages over traditional statistical methods for modeling geofields, especially when data is limited in the early stages.
This document discusses panel data and methods for analyzing it. Panel data contains observations on multiple entities like individuals, states, or school districts that are observed at different points in time. This allows controlling for factors that are constant over time but vary across entities. Fixed effects regression is introduced as a method that eliminates the effect of any time-invariant characteristics. The document provides examples of how to specify fixed effects models using binary regressors or demeaning the data, and notes these produce identical estimates.
The document discusses various topics related to pollution and renewable energy. It describes different types of pollution like air, water and soil pollution. It also discusses recycling symbols and bins for different materials. The document then covers alternative energy sources like wind turbines, hydroelectric power, and solar energy. It notes advantages of solar like lack of emissions and noise. The document ends with the results of a questionnaire related to recycling habits, use of renewable energy, and behaviors that impact the environment.
Directive models are explicit teaching techniques where the teacher directly instructs students on a specific skill from the front of the classroom. Constructivism is a student-driven approach where learners actively participate in their education. Directive instruction is best for teaching small chunks of information, like spelling rules or math concepts, while constructivism is better for more open-ended learning but can leave students unclear on goals. The document discusses different approaches to instruction and when each is most effective.
1) A survey was conducted of students at the University of Karachi to understand their views on environmental pollution.
2) The results found that most respondents know about pollution and its effects but are unwilling to take actions to protect the environment.
3) Additionally, the survey found that while pollution is a problem, overpopulation is the main issue driving resource depletion and pollution.
This document summarizes a study on identifying the most significant factors causing environmental pollution in Kurdistan.
The study conducted a survey of 30 experts who rated 15 potential factors on their importance. The factors with the highest average ratings were identified as the most significant in causing pollution. These included lack of waste quantification and monitoring, lack of worker skills and technical expertise, and absence of government inspections and enforcement actions.
The study recommends improving regulations and enforcement, promoting recycling, reducing pesticide and fertilizer use, conducting more research on pollution impacts, and developing taxes to incentivize private industry to improve environmental management.
Environmental Pollution, protective measures of pollutionpardeeprattan
This document discusses environmental pollution and protective measures. It defines environmental pollution and describes different types of pollution including air, water, and land pollution. It then discusses various sources of these pollutions such as automobiles, thermal power stations, industrial and agricultural waste. The document outlines effects of pollution like respiratory diseases. Finally, it proposes protective measures for different types of pollution through technologies, public participation, and enforcement of environmental laws.
Water pollution occurs when pollutants from human activities contaminate bodies of water. There are three main types of water pollution: physical, chemical, and biological. Physical pollution involves solid waste like plastics and garbage. Chemical pollution comes from fertilizers, oils, and sewage runoff from industrial plants and farms. Biological pollution involves disease-causing microorganisms. Other major causes of water pollution include oil spills, nutrient pollution from wastewater and fertilizers, disruption of food chains, and leaks from underground storage tanks. Water pollution destroys ecosystems, kills aquatic life, and poses health risks to humans who use contaminated water sources.
This document defines and discusses various types of environmental pollution. It begins by defining environmental pollution and the key terms of pollutant and pollution. It then describes the main types of pollution as water, air, land, and noise pollution. For each type of pollution, it provides details on causes, sources, and effects. It emphasizes that most water and air pollution is caused by human activities. The document concludes by discussing solutions to pollution and providing examples of evidence of global warming.
The document discusses several environmental issues including the Fukushima nuclear disaster in Japan, cancer villages in China caused by industrial pollution, and various forms of pollution that are problems in India like air, water, and land pollution. It also discusses Japan's approach to waste management which relies on advances in recycling and consumer participation. Preventing environmental problems involves individual actions like reducing waste and using public transport as well as stopping deforestation and pollution of water sources.
The document defines environmental pollution and describes its three main types: air, water, and soil pollution. It provides details on the causes and effects of each type of pollution. Air pollution is caused by emissions from vehicles, factories, and burning of fossil fuels, and can lead to acid rain, haze, health issues, and depletion of the ozone layer. Water pollution results from industrial waste, oil spills, and waste disposal in rivers and oceans, harming wildlife and spreading disease. Soil pollution is caused by industrial chemicals, mining, pesticides, and landfills, contaminating groundwater and reducing soil fertility.
Similar to Application of panel data to the effect of five (5) world development indicators (wdi) on gdp per capita of twenty (20) african union (au) countries (1981 2011)
Investigations of certain estimators for modeling panel data under violations...Alexander Decker
This document investigates the efficiency of four methods for estimating panel data models (pooling, first differencing, between, and feasible generalized least squares) when the assumptions of homoscedasticity, no autocorrelation, and no collinearity are jointly violated. Monte Carlo simulations were conducted under varying conditions of heteroscedasticity, autocorrelation, collinearity, sample size, and time periods. The results showed that in small samples, the feasible generalized least squares estimator is most efficient when heteroscedasticity is severe, regardless of autocorrelation and collinearity levels. However, when heteroscedasticity is low to moderate with moderate autocorrelation, first differencing and feasible generalized least squares
The document discusses panel data analysis and techniques for fixed and random effects models. Panel data, also known as longitudinal or cross-sectional time-series data, observes the behavior of entities like countries, companies, or individuals over time. Fixed effects models control for time-invariant characteristics of entities to assess the net impact of predictors on outcomes. Random effects models allow for correlation between predictors and entity error terms. The document demonstrates how to set up panel data in Stata and estimate fixed effects models using the least squares dummy variable approach.
The document discusses panel data and techniques for analyzing it, specifically fixed effects and random effects models. It defines panel data as data that observes the behavior of entities over time, providing examples like countries, companies, or individuals. Fixed effects models control for time-invariant characteristics of entities by including entity-specific intercepts or dummy variables for each entity. This allows analyzing the impact of variables that change over time by removing the influence of fixed characteristics. The document provides equations to demonstrate fixed effects models and discusses using the least squares dummy variable approach.
This document presents a new forecasting model that combines fuzzy time series and automatic clustering techniques to forecast gasoline prices in Vietnam. The model first uses an automatic clustering algorithm to divide historical gasoline price data into clusters with varying interval lengths. It then fuzzifies the data based on the new intervals to determine fuzzy logical relationships and forecasted values. The model is applied to a dataset of gasoline prices in Vietnam. Results show the proposed model achieves higher forecasting accuracy than a first-order fuzzy time series model.
Panel data combines cross-sectional and time-series data by observing the same cross-sectional units (e.g. firms, countries) over time. This allows for more data variation and better study of dynamic changes. The document discusses fixed and random effects models for panel data, the Hausman test for choosing between them, and evaluating models for autocorrelation and heteroskedasticity.
Application of Semiparametric Non-Linear Model on Panel Data with Very Small ...IOSRJM
-This research work investigated the behaviour of a new semiparametric non-linear (SPNL) model on
a set of panel data with very small time point (T = 1). The SPNL model incorporates the relationship between
individual independent variable and unobserved heterogeneity variable. Five different estimation techniques
namely; Least Square (LS), Generalized Method of Moments (GMM), Continuously Updating (CU), Empirical
Likelihood (EL) and Exponential Tilting (ET) Estimators were employed for the estimation; for the purpose of
modelling the metrical response variable non-linearly on a set of independent variables. The performances of
these estimators on the SPNL model were examined for different parameters in the model using the Least
Square Error (LSE), Mean Absolute Error (MAE) and Median Absolute Error (MedAE) criteria at the lowest
time point (T = 1). The results showed that the ET estimator which provided the least errors of estimation is
relatively more efficient for the proposed model than any of the other estimators considered. It is therefore
recommended that the ET estimator should be employed to estimate the SPNL model for panel data with very
small time point.
Time series data are observations collected over time on one or more variables. Time series data can be used to analyze problems involving changes over time, such as stock prices, GDP, and exchange rates. Time series data must be stationary, meaning that its statistical properties like mean and variance do not change over time, to avoid spurious regressions. Non-stationary time series can be transformed to become stationary through differencing, removing trends, or taking logs. Common time series models like ARIMA rely on stationary data.
Financial Time Series Analysis Based On Normalized Mutual Information FunctionsIJCI JOURNAL
A method of predictability analysis of future values of financial time series is described. The method is based on normalized mutual information functions. In the analysis, the use of these functions allowed to refuse any restrictions on the distributions of the parameters and on the correlations between parameters. A comparative analysis of the predictability of financial time series of Tel Aviv 25 stock exchange has been carried out.
This document presents a new multivariate fuzzy time series forecasting method to predict car road accidents. The method uses four secondary factors (number killed, mortally wounded, died 30 days after accident, severely wounded, and lightly casualties) along with the main factor of total annual car accidents in Belgium from 1974 to 2004. The new method establishes fuzzy logical relationships between the factors to generate forecasts. Experimental results show the proposed method performs better than existing fuzzy time series forecasting approaches at predicting car accidents. Actuaries can use this kind of multivariate fuzzy time series analysis to help define insurance premiums and underwriting.
This document discusses panel data econometrics. It begins by defining panel data as data that combines cross-sectional observations of multiple individuals (or other units) over time. This allows modeling both between-unit and within-unit variation. The document outlines the advantages of panel data, including providing more data points, controlling for omitted variables, and enabling the study of dynamic relationships and microeconomic foundations of aggregate relationships. It then describes different types of panel data structures and models, including static vs. dynamic panels and stationary vs. non-stationary panels. The key benefits of panel data are more efficient parameter estimates due to increased data points and the ability to better study adjustment dynamics and causal effects over time.
This document provides an introduction to panel data analysis and regression models for panel data. It defines panel data as longitudinal data collected on the same units (like individuals, firms, countries) over multiple time periods. Panel data allow researchers to study changes over time and estimate causal effects. The document outlines common panel data structures, reasons for using panel data analysis, and basic estimation techniques like fixed effects and random effects models to account for unobserved heterogeneity across units. It also discusses assumptions and limitations of different panel data models.
Two-Stage Eagle Strategy with Differential EvolutionXin-She Yang
The document describes a two-stage optimization strategy called the Eagle Strategy (ES) that combines global and local search algorithms to improve search efficiency. It evaluates applying ES to differential evolution (DE), a popular evolutionary algorithm. ES first uses randomization like Levy flights for global exploration, then switches to DE for intensive local search around promising solutions. The authors validate ES-DE on test functions, finding it requires only 9.7-24.9% of the function evaluations of pure DE. They also apply it to real-world pressure vessel and gearbox design problems, achieving solutions with 14.9-17.7% fewer function evaluations than pure DE.
This document discusses modeling the skewness and kurtosis of box office revenue data using the Box-Cox power exponential (BCPE) distribution within the generalized additive models for location, scale and shape (GAMLSS) framework. It finds that the BCPE distribution provides a better fit than the traditionally used Pareto–Levy–Mandelbrot distribution. The flexible four-parameter BCPE distribution allows modeling the location, scale, skewness, and kurtosis parameters of box office revenues as smooth functions of explanatory variables like opening revenues and number of screens. This overcomes limitations of previous models and provides a better understanding of box office revenues across different time periods.
Simulating Multivariate Random Normal Data using Statistical Computing Platfo...ijtsrd
This document describes how to simulate multivariate normal random data using the statistical computing platform R. It discusses two main decomposition methods for generating such data - Eigen decomposition and Cholesky decomposition. These methods decompose the variance-covariance matrix in different ways to simulate random normal values that match the desired mean and variance-covariance structure. The document provides code examples in R to implement both methods and compares the results. It finds that both methods accurately reproduce the target multivariate normal distribution.
This document describes a Kriging component for spatial interpolation of climatological variables in the OMS modeling framework. Kriging is a geostatistical technique that interpolates values based on measured data and the spatial autocorrelation between data points. The component implements ordinary and detrended Kriging algorithms using 10 semivariogram models. It can interpolate both raster and point data and outputs the interpolated climatological variable values. Links are provided for downloading the component code, data, and OMS project files needed to run the interpolation.
This document describes a stock price model based on the voter model from statistical physics. The model represents stock investors on a lattice who can be in a buying, selling, or neutral position based on interactions with neighboring investors. The stock price is then derived from the positions of investors. Computer simulations of the 1D model are presented, showing the fluctuations of generated stock prices and returns. The document also discusses properties found in real stock market data, such as power law distributions and volatility clustering, that the model aims to replicate.
This powerpoint presentation was done as part of the course STAT 591 titled Mater's Seminar during Third semester of MSc. Agricultural Statistics at Agricultural College, Bapatla under ANGRAU, Andhra Pradesh.
A Study on Performance Analysis of Different Prediction Techniques in Predict...IJRES Journal
Time series data is a series of statistical data that is related to a specific instant or a specific time period. Here, the measurements are recorded on a regular basis such as monthly, quarterly and yearly. Most of the researchers have used one of the prediction techniques in prediction of time series data. But, they have not tested all prediction techniques on same data set. They have not even compared the performance of different prediction techniques on the same data set. In this research work, some well known prediction techniques have been applied in the same time series data set. The average error and residual analysis have been done for each and every applied technique. One technique has been selected based on the minimum average error and residual analysis among the all applied techniques. The residual analysis comprises of absolute residual, maximum residual, median of absolute residual, mean of absolute residual and standard deviation. To finalize the algorithm, same procedure has been applied on different time series data sets. Finally, one technique has been selected which has been given minimum error and minimum value of residual analysis in most cases.
Granger Causality Test: A Useful Descriptive Tool for Time Series DataIJMER
Interdependency of one or more variables on the other has been in the existence over long
time when it was discovered that one variable has to move or regress toward another following the
work done by Galton (1886); Pearson & Lee (1903); Kendall & Stuart, (1961); Johnston and
DiNardo, (1997); Gujarati, (2004) etc. It was in the light of this dependency over time the researcher
uses Granger Causality as an effective tool in time series Predictive causality using Nigeria GDP and
Money Supply to know the type of causality in existence in the two time series variables under
consideration and which one can statistically predicts the other.
The research work aimed at testing for nature of causality between GDP and money supply for
Federal Republic of Nigeria for the period of thirty years using the data sourced from Central Bank
of Nigeria Statistical Bulletin. After observing the various conditions of Granger causality test such
as ensuring stationarity in the variables under consideration; adding enough number of lags in the
prescribed model before estimation as Granger causality test is sensitive to the number of lags
introduced in the model; and as well as assuming the disturbance terms in the various models are
uncorrelated, the result of the analysis indicates a bilateral relationship between Nigeria GDP and
Money Supply. It implies Nigeria GDP Granger causes money Supply and vice versa. Based on the
result of this study, both Nigeria GDP and money Supply can be successfully model using Vector
Autoregressive Model since changes in one variable has a significant effect on the other variable.
Similar to Application of panel data to the effect of five (5) world development indicators (wdi) on gdp per capita of twenty (20) african union (au) countries (1981 2011) (20)
Abnormalities of hormones and inflammatory cytokines in women affected with p...Alexander Decker
Women with polycystic ovary syndrome (PCOS) have elevated levels of hormones like luteinizing hormone and testosterone, as well as higher levels of insulin and insulin resistance compared to healthy women. They also have increased levels of inflammatory markers like C-reactive protein, interleukin-6, and leptin. This study found these abnormalities in the hormones and inflammatory cytokines of women with PCOS ages 23-40, indicating that hormone imbalances associated with insulin resistance and elevated inflammatory markers may worsen infertility in women with PCOS.
A usability evaluation framework for b2 c e commerce websitesAlexander Decker
This document presents a framework for evaluating the usability of B2C e-commerce websites. It involves user testing methods like usability testing and interviews to identify usability problems in areas like navigation, design, purchasing processes, and customer service. The framework specifies goals for the evaluation, determines which website aspects to evaluate, and identifies target users. It then describes collecting data through user testing and analyzing the results to identify usability problems and suggest improvements.
A universal model for managing the marketing executives in nigerian banksAlexander Decker
This document discusses a study that aimed to synthesize motivation theories into a universal model for managing marketing executives in Nigerian banks. The study was guided by Maslow and McGregor's theories. A sample of 303 marketing executives was used. The results showed that managers will be most effective at motivating marketing executives if they consider individual needs and create challenging but attainable goals. The emerged model suggests managers should provide job satisfaction by tailoring assignments to abilities and monitoring performance with feedback. This addresses confusion faced by Nigerian bank managers in determining effective motivation strategies.
A unique common fixed point theorems in generalized dAlexander Decker
This document presents definitions and properties related to generalized D*-metric spaces and establishes some common fixed point theorems for contractive type mappings in these spaces. It begins by introducing D*-metric spaces and generalized D*-metric spaces, defines concepts like convergence and Cauchy sequences. It presents lemmas showing the uniqueness of limits in these spaces and the equivalence of different definitions of convergence. The goal of the paper is then stated as obtaining a unique common fixed point theorem for generalized D*-metric spaces.
A trends of salmonella and antibiotic resistanceAlexander Decker
This document provides a review of trends in Salmonella and antibiotic resistance. It begins with an introduction to Salmonella as a facultative anaerobe that causes nontyphoidal salmonellosis. The emergence of antimicrobial-resistant Salmonella is then discussed. The document proceeds to cover the historical perspective and classification of Salmonella, definitions of antimicrobials and antibiotic resistance, and mechanisms of antibiotic resistance in Salmonella including modification or destruction of antimicrobial agents, efflux pumps, modification of antibiotic targets, and decreased membrane permeability. Specific resistance mechanisms are discussed for several classes of antimicrobials.
A transformational generative approach towards understanding al-istifhamAlexander Decker
This document discusses a transformational-generative approach to understanding Al-Istifham, which refers to interrogative sentences in Arabic. It begins with an introduction to the origin and development of Arabic grammar. The paper then explains the theoretical framework of transformational-generative grammar that is used. Basic linguistic concepts and terms related to Arabic grammar are defined. The document analyzes how interrogative sentences in Arabic can be derived and transformed via tools from transformational-generative grammar, categorizing Al-Istifham into linguistic and literary questions.
A time series analysis of the determinants of savings in namibiaAlexander Decker
This document summarizes a study on the determinants of savings in Namibia from 1991 to 2012. It reviews previous literature on savings determinants in developing countries. The study uses time series analysis including unit root tests, cointegration, and error correction models to analyze the relationship between savings and variables like income, inflation, population growth, deposit rates, and financial deepening in Namibia. The results found inflation and income have a positive impact on savings, while population growth negatively impacts savings. Deposit rates and financial deepening were found to have no significant impact. The study reinforces previous work and emphasizes the importance of improving income levels to achieve higher savings rates in Namibia.
A therapy for physical and mental fitness of school childrenAlexander Decker
This document summarizes a study on the importance of exercise in maintaining physical and mental fitness for school children. It discusses how physical and mental fitness are developed through participation in regular physical exercises and cannot be achieved solely through classroom learning. The document outlines different types and components of fitness and argues that developing fitness should be a key objective of education systems. It recommends that schools ensure pupils engage in graded physical activities and exercises to support their overall development.
A theory of efficiency for managing the marketing executives in nigerian banksAlexander Decker
This document summarizes a study examining efficiency in managing marketing executives in Nigerian banks. The study was examined through the lenses of Kaizen theory (continuous improvement) and efficiency theory. A survey of 303 marketing executives from Nigerian banks found that management plays a key role in identifying and implementing efficiency improvements. The document recommends adopting a "3H grand strategy" to improve the heads, hearts, and hands of management and marketing executives by enhancing their knowledge, attitudes, and tools.
This document discusses evaluating the link budget for effective 900MHz GSM communication. It describes the basic parameters needed for a high-level link budget calculation, including transmitter power, antenna gains, path loss, and propagation models. Common propagation models for 900MHz that are described include Okumura model for urban areas and Hata model for urban, suburban, and open areas. Rain attenuation is also incorporated using the updated ITU model to improve communication during rainfall.
A synthetic review of contraceptive supplies in punjabAlexander Decker
This document discusses contraceptive use in Punjab, Pakistan. It begins by providing background on the benefits of family planning and contraceptive use for maternal and child health. It then analyzes contraceptive commodity data from Punjab, finding that use is still low despite efforts to improve access. The document concludes by emphasizing the need for strategies to bridge gaps and meet the unmet need for effective and affordable contraceptive methods and supplies in Punjab in order to improve health outcomes.
A synthesis of taylor’s and fayol’s management approaches for managing market...Alexander Decker
1) The document discusses synthesizing Taylor's scientific management approach and Fayol's process management approach to identify an effective way to manage marketing executives in Nigerian banks.
2) It reviews Taylor's emphasis on efficiency and breaking tasks into small parts, and Fayol's focus on developing general management principles.
3) The study administered a survey to 303 marketing executives in Nigerian banks to test if combining elements of Taylor and Fayol's approaches would help manage their performance through clear roles, accountability, and motivation. Statistical analysis supported combining the two approaches.
A survey paper on sequence pattern mining with incrementalAlexander Decker
This document summarizes four algorithms for sequential pattern mining: GSP, ISM, FreeSpan, and PrefixSpan. GSP is an Apriori-based algorithm that incorporates time constraints. ISM extends SPADE to incrementally update patterns after database changes. FreeSpan uses frequent items to recursively project databases and grow subsequences. PrefixSpan also uses projection but claims to not require candidate generation. It recursively projects databases based on short prefix patterns. The document concludes by stating the goal was to find an efficient scheme for extracting sequential patterns from transactional datasets.
A survey on live virtual machine migrations and its techniquesAlexander Decker
This document summarizes several techniques for live virtual machine migration in cloud computing. It discusses works that have proposed affinity-aware migration models to improve resource utilization, energy efficient migration approaches using storage migration and live VM migration, and a dynamic consolidation technique using migration control to avoid unnecessary migrations. The document also summarizes works that have designed methods to minimize migration downtime and network traffic, proposed a resource reservation framework for efficient migration of multiple VMs, and addressed real-time issues in live migration. Finally, it provides a table summarizing the techniques, tools used, and potential future work or gaps identified for each discussed work.
A survey on data mining and analysis in hadoop and mongo dbAlexander Decker
This document discusses data mining of big data using Hadoop and MongoDB. It provides an overview of Hadoop and MongoDB and their uses in big data analysis. Specifically, it proposes using Hadoop for distributed processing and MongoDB for data storage and input. The document reviews several related works that discuss big data analysis using these tools, as well as their capabilities for scalable data storage and mining. It aims to improve computational time and fault tolerance for big data analysis by mining data stored in Hadoop using MongoDB and MapReduce.
1. The document discusses several challenges for integrating media with cloud computing including media content convergence, scalability and expandability, finding appropriate applications, and reliability.
2. Media content convergence challenges include dealing with the heterogeneity of media types, services, networks, devices, and quality of service requirements as well as integrating technologies used by media providers and consumers.
3. Scalability and expandability challenges involve adapting to the increasing volume of media content and being able to support new media formats and outlets over time.
This document surveys trust architectures that leverage provenance in wireless sensor networks. It begins with background on provenance, which refers to the documented history or derivation of data. Provenance can be used to assess trust by providing metadata about how data was processed. The document then discusses challenges for using provenance to establish trust in wireless sensor networks, which have constraints on energy and computation. Finally, it provides background on trust, which is the subjective probability that a node will behave dependably. Trust architectures need to be lightweight to account for the constraints of wireless sensor networks.
This document discusses private equity investments in Kenya. It provides background on private equity and discusses trends in various regions. The objectives of the study discussed are to establish the extent of private equity adoption in Kenya, identify common forms of private equity utilized, and determine typical exit strategies. Private equity can involve venture capital, leveraged buyouts, or mezzanine financing. Exits allow recycling of capital into new opportunities. The document provides context on private equity globally and in developing markets like Africa to frame the goals of the study.
This document discusses a study that analyzes the financial health of the Indian logistics industry from 2005-2012 using Altman's Z-score model. The study finds that the average Z-score for selected logistics firms was in the healthy to very healthy range during the study period. The average Z-score increased from 2006 to 2010 when the Indian economy was hit by the global recession, indicating the overall performance of the Indian logistics industry was good. The document reviews previous literature on measuring financial performance and distress using ratios and Z-scores, and outlines the objectives and methodology used in the current study.
Application of panel data to the effect of five (5) world development indicators (wdi) on gdp per capita of twenty (20) african union (au) countries (1981 2011)
1. Developing Country Studies www.iiste.org
ISSN 2224-607X (Paper) ISSN 2225-0565 (Online)
Vol.4, No.21, 2014
72
Application of Panel Data to the Effect of Five (5) World
Development Indicators (WDI) on GDP Per Capita of Twenty (20)
African Union (AU) Countries (1981-2011)
M. I Ekum* D. A. Farinde
Department of Mathematics & Statistics, Lagos-State Polytechnics, Ikorodu, Lagos, Nigeria
matekum@yahoo.com, danielfarinde@yahoo.co.uk
Abstract
In this paper, we employ Fixed Effect of Panel Data Model to formulate a Panal Data Linear Regression model
of Gross Domestic Product Per Capita of 20 African Union (AU) Countries using 5 World Development
Indicator (WDI) as explanatory variables. Data were collected from 1981 to 2011. The 5 WDI are OER-Official
Exchange Rate (LCU Per US$, Period Average), BM-Broad Money (% of GDP), INF-Inflation, GDP deflator
(Annual %), TNR-Total Natural Resources Rents (% of GDP) and FDI-Foreign Direct Investment, Net Inflows
(% of GDP).
Keywords: Econometrics, Cross section, Time series, Panel data, Fixed effect, Random effect.
1.0 INTRODUCTION
Econometrics is a rapidly developing branch of economics which, broadly speaking, aims to give empirical
content to economic relations. The term ‘econometrics’ appears to have been first used by Pawel Ciompa as early
as 1910; although it is Ragnar Frisch, one of the founders of the Econometric Society, who should be given the
credit for coining the term, and for establishing it as a subject in the sense in which it is known today (see Frisch,
1936, p. 95). Econometrics can be defined generally as ‘the application of mathematics and statistical methods
to the analysis of economic data’, or more precisely in the words of Samuelson, Koopmans and Stone (1954), as
the quantitative analysis of actual economic phenomena based on the concurrent development of theory and
observation, related by appropriate methods of inference
Chow (1983) in a more recent textbook succinctly defines econometrics ‘as the art and science of
using statistical methods for the measurement of economic relations’.
Panel data are data where the same observation is followed over time (like in time series) and where
there are many observations (like in cross-sectional data). In this sense, panel data combine the features of both
time-series and cross-sectional data and methods.
2.0 PANEL DATA MODEL
Different types of data are generally available for empirical analysis, namely, time series, cross section, and
panel. A data set containing observations on a single phenomenon observed over multiple time periods is called
time series (e.g GDP per capita for several years). In time series data, both the values and the ordering of the data
points have meaning. In cross-section data, values of one or more variables are collected for several sample units,
or entities, at the same point in time (e.g., GDP per capita for 20 African Union (AU) countries for a given year).
Panel data sets refer to sets that consist of both time series and cross section data. This has the effect of
expanding the number of observations available, for instance if we have 31 years of data across 20 countries, we
have 620 observations. So although there would not be enough to estimate the model as a time series or a cross
section, there would be enough to estimate it as a panel.
Looking at the model below
In matrix form
In time series data, t = 1, 2, …,T and n = 1; while in cross-sectional data, i = 1, 2, …, n and T = 1. However, in
panel data, t = 1, 2… T and i = 1, 2 … n.
2.1 TYPES OF PANEL DATA
Generally speaking, there exist two types of panel datasets. Macro panels are characterized by having a
relatively large T and a relatively small n. A typical example is a panel of countries where the variables are
macro data like the one we are working on i.e GDP per capita. Micro panels, instead, usually cover a large set of
units “n” for a relatively short number of periods T.
Another important classification is between balanced and unbalanced panels. A balanced dataset is one in
2. Developing Country Studies www.iiste.org
ISSN 2224-607X (Paper) ISSN 2225-0565 (Online)
Vol.4, No.21, 2014
73
which all the n observations are followed for the same number of periods T. In an unbalanced dataset each
observation might be available for a different number of periods so that the time dimension is potentially
different for different observations.
2.2 USES OF PANEL DATA
Panel data possess some advantages over cross-sectional or time series data.
Panel data can address issues that cannot be addressed by cross-sectional or time-series data alone. Baltagi (2002)
highlighted the following advantages of panel data over cross sectional or time-series data:
(i) Panel data control for heterogeneity, they give more informative data, more variability, less collinearity
among the variables, more degrees of freedom and more efficiency
(ii) They study better, the dynamics of adjustment.
(iii) They are able to identify and measure effects that are simply not detectable in pure cross-sectional or
pure time series data.
(iv) Panel data models allow us to construct and test more complicated behavioural models than purely
cross-sectional or time-series data.
2.3 ESTIMATION OF PANEL DATA MODELS
As earlier discussed, panel data has two dimensions viz: the individual dimension and time dimension. A panel
data model differs from a cross-section or time series in that it has double subscript on its variables. That is, it’s
of the form:
i could denote individuals, households, firms, countries etc. for the purpose of this paper, i denotes countries
while t denotes time, hence denotes the value of the dependent variable y for country i at time t. is a
scalar, is k × 1 matrix (a column vector) and is the ith observation on the k explanatory variables.
Although (2.3) postulates common intercept ( ) for all i and t and common vector of slope coefficients for all i
and t, variants of the model exist.
The variants include:
(2.4) postulates constant slope coefficients and intercept that varies over countries.
(2.5) postulates constant slope coefficients and intercept that varies over countries and time.
(2.6) postulates intercept and slopes that vary over countries.
(2.7) postulates intercept and slopes that vary over time and countries.
However, (2.3) suffices for most applications involving static (non dynamic) panel data models and shall hence
form the basis of our further discussions on panel data.
3.0 METHODOLOGY
Basically, the static panel data models can be estimated using:
1. Ordinary Least Square (OLS)
2. Fixed Effects (FE) and
3. Random Effects (RE)
4. Seemily Unrelated (SUR)
3. Developing Country Studies www.iiste.org
ISSN 2224-607X (Paper) ISSN 2225-0565 (Online)
Vol.4, No.21, 2014
74
Each of these methods has its underlying assumptions which must necessary be satisfied to obtain unbiased and
efficient estimates. We consider only the Fixed Effects model.
3.1 ONE-WAY ERROR COMPONENT REGRESSION MODEL
Recall (2.3)
Where denotes the effect of all omitted variables.
If is decomposed as
We have
(3.2) is called the one-way error component model where denotes the unobservable country specific (time
invariant) effect and (which varies with individual and time), the remainder disturbance in regression.
3.2 THE FIXED EFFECTS MODEL
As earlier emphasized, one of the approaches used to capture specific effects in a panel data model is the fixed
effects (FE) regression. The FE approach is based on the assumption that the effects are fixed parameters that
can be estimated.
In this case, the omitted country specific term are assumed to be fixed parameters to be estimated and
normal, independent and identically distributed i.e . The are assumed to be independent of
for all i and t. The fixed effects model is appropriate if inference is to be drawn on the countries that
constitute the sample only and not for generalization for the entire population.
In vector form (3.2) can be written as:
where
is a vector of ones of dimension nT.
Note that (3.1) can be written as
Where
Where is identity matrix of dimension n, is a vector of ones of dimension T and denotes kronecker
product;
is a matrix of ones and zeros, that is, a matrix of individual dummies that are included in the regression to
estimate which are assumed fixed.
At this juncture, we should note the following:
{P is a projection matrix on . P averages the observations across time for each country.}
{Q is a matrix which obtains deviations from individual mean.}
**** P and Q are symmetric idempotent matrices (P’ = P and P2
= P)
P and Q are orthogonal i.e PQ = 0
P + Q = InT
4. Developing Country Studies www.iiste.org
ISSN 2224-607X (Paper) ISSN 2225-0565 (Online)
Vol.4, No.21, 2014
75
Model Estimation
If we substitute (3.4) into (3.3), we shall have:
Where Z is nT × (K+1) and , the matrix of country dummies is nT × n, if n is large, (3.5) will include too
many dummies and the matrix to be inverted will be dimension (N+K)!. Apart from the herculean task of having
to invert such a large matrix, the matrix will also fall into dummy variable trap.
Rather than attempt OLS on (3.5), we can obtain Least Squares Dummy Variables (LSDV) Estimators of α and β
by pre multiplying (3.5) by Q and performing OLS on the transformed model:
Since
As follows:
Mean of
Since
Then
Variance of β
On substituting (3.7) into (3.8), we have
Since
We have
Then
5. Developing Country Studies www.iiste.org
ISSN 2224-607X (Paper) ISSN 2225-0565 (Online)
Vol.4, No.21, 2014
76
Note: The OLS is sometimes called the Least Square Dummy Variable (LSDV).
4.0 RESULT OF ANALYSIS
The proposed Econometric model is given by
For i = 1, 2, …, n and t = 1, 2, … , T where n = 20; T = 31
Note: The independent variables are carefully selected so that they are correlated with the dependent variable but
are not correlated with other independents variables. Hence, the independent variables are not correlated with
one another (no multicollinearity).
In this section, we present the result of the model using the following specifications below.
Model Specification
Estimation of equation
Methods: Least Squares (LS)
Sample: 1981-2011
Panel Options
Effects specification: Cross Section is fixed, Period is none
Weights: GLS weight: Cross-section SUR
Coefficient covariance method: Ordinary.
Table 1: Panel Data Format
CCode Cnid t I YEAR RGDP OER BM INF TNR FDI
NGA 1 1 1 1981 772.10 0.62 30.03 16.21 30.18 0.91
NGA 1 2 2 1982 624.98 0.67 32.13 2.61 29.19 0.87
NGA 1 3 3 1983 428.13 0.72 33.31 16.14 35.71 1.04
NGA 1 4 4 1984 336.74 0.77 33.40 16.95 47.46 0.67
NGA 1 5 5 1985 330.98 0.89 32.00 3.69 47.04 1.71
NGA 1 6 6 1986 229.52 1.75 32.31 -1.50 31.82 0.96
NGA 1 7 7 1987 259.41 4.02 26.54 50.08 33.39 2.60
NGA 1 8 8 1988 246.39 4.54 26.44 21.38 29.16 1.66
NGA 1 9 9 1989 250.63 7.36 19.29 44.38 40.54 7.90
NGA 1 10 10 1990 291.87 8.04 22.08 7.16 47.48 2.06
NGA 1 11 11 1991 273.17 9.91 24.10 20.17 42.22 2.61
NGA 1 12 12 1992 319.30 17.30 20.82 83.62 35.70 2.74
NGA 1 13 13 1993 203.49 22.07 20.52 52.64 48.51 6.30
NGA 1 14 14 1994 220.22 22.00 21.58 27.77 41.14 8.28
NGA 1 15 15 1995 255.50 21.90 16.12 55.97 38.01 3.84
NGA 1 16 16 1996 313.44 21.88 13.11 36.90 40.11 4.51
NGA 1 17 17 1997 314.30 21.89 14.62 1.36 39.38 4.25
NGA 1 18 18 1998 272.44 21.89 18.58 -5.55 25.98 3.27
NGA 1 19 19 1999 287.92 92.34 21.79 12.29 32.60 2.89
NGA 1 20 20 2000 371.77 101.70 22.16 38.17 46.91 2.48
NGA 1 21 1 2001 378.83 111.23 24.52 10.74 39.87 2.48
NGA 1 22 2 2002 455.33 120.58 21.83 31.47 27.98 3.17
NGA 1 23 3 2003 508.43 129.22 20.20 11.20 34.40 2.96
NGA 1 24 4 2004 644.03 132.89 18.26 20.73 37.36 2.13
NGA 1 25 5 2005 802.79 131.27 17.73 19.76 43.15 4.44
NGA 1 26 6 2006 1,014.58 128.65 19.04 19.56 38.12 3.34
NGA 1 27 7 2007 1,129.09 125.81 28.03 4.81 34.84 3.64
NGA 1 28 8 2008 1,374.67 118.55 36.35 10.98 37.00 3.96
NGA 1 29 9 2009 1,091.26 148.90 40.68 -4.41 25.46 5.07
NGA 1 30 10 2010 1,443.21 150.30 32.48 26.78 32.56 2.65
NGA 1 31 11 2011 1,501.72 154.74 33.58 2.34 42.00 3.62
CIV 2 1 12 1981 948.99 271.73 27.92 2.98 3.84 0.39
CIV 2 2 13 1982 815.28 328.61 26.56 8.30 4.64 0.63
CIV 2 3 14 1983 706.10 381.07 26.55 9.05 5.50 0.55
CIV 2 4 15 1984 678.06 436.96 27.63 17.91 5.05 0.32
CIV 2 5 16 1985 664.87 449.26 29.97 0.34 4.70 0.42
CIV 2 6 17 1986 840.50 346.31 30.42 -2.02 2.76 0.77
OUTPUT FROM EVIEWS 7
TABLE 2: DESCRIPTIVE STATISTICS OF VARIABLES USED.
6. Developing Country Studies www.iiste.org
ISSN 2224-607X (Paper) ISSN 2225-0565 (Online)
Vol.4, No.21, 2014
77
RGDP OER BM INF TNR FDI
Mean 1160.794 197.7944 37.83302 12.69653 7.640170 1.274752
Median 583.1229 8.803060 32.16974 7.774248 4.042073 0.373410
Maximum 8532.617 2522.746 151.5489 189.9751 48.50557 10.05164
Minimum 102.4829 0.000275 7.287787 -27.04865 0.145038 -2.069713
Std. Dev. 1325.736 357.1241 21.99282 21.04700 9.652967 1.892576
Skewness 2.254689 2.852006 1.194571 4.347025 2.344576 1.926401
Kurtosis 8.838048 13.04535 4.468418 27.94831 8.064135 7.063302
Jarque-Bera 1405.780 3447.326 203.1598 18031.79 1230.535 809.9913
Probability 0.000000 0.000000 0.000000 0.000000 0.000000 0.000000
Sum 719692.1 122632.5 23456.47 7871.850 4736.905 790.3462
Sum Sq. Dev. 1.09E+09 78945766 299400.4 274202.3 57678.28 2217.162
Observations 620 620 620 620 620 620
Source: Eviews 7 Output
It can be seen from Table 2 that the average RGDP per capita is $1,160.79, the average Official Exchange Rate
(in local currency) is 197.79, the average board money is 37.83, the average inflation rate (GDP deflator) is
12.70, the total natural resources % of GDP is 7.64 and the foreign direct investment % of GDP is 1.27.
It is also evident that the GDP per capita minimum ever attained is $102.48 and the maximum ever
attained is $8532.62. The standard deviation for the 620 dataset for RGDP is 1325.736 with skewness and
kurtosis of 2.25 and 8.84 respectively.
Empirical Results
This section presents the empirical results of our model with the objective to assess the impact of some world
development indicators (OER, BM, INF, TNR, FDI) on variables on gross domestic product per capita Africa
Union countries. Estimates are made using the ordinary least squares static panel of cross sectional fixed effect.
The choice of this model is justified by the fact that the dynamic panel data and random effect have not yielded
robust estimators. Table 3 shows the results of estimating the Fixed Effect panel model in one stage on 20
African Union countries for the period 1981-2011
7. Developing Country Studies www.iiste.org
ISSN 2224-607X (Paper) ISSN 2225-0565 (Online)
Vol.4, No.21, 2014
78
Table 3: Estimates of the Cross Section Fixed Effect panel model of one-error component on 20 African
Union countries for the period 1981-2011
Dependent Variable: RGDP
Method: Panel EGLS (Cross-section SUR)
Sample: 1981 2011
Periods included: 31
Cross-sections included: 20
Total panel (balanced) observations: 620
Linear estimation after one-step weighting matrix
Variable Coefficient Std. Error t-Statistic Prob.
C 193.2930 19.02488 10.16001 0.0000
OER -0.233136 0.011616 -20.06969 0.0000
BM 24.50454 0.444517 55.12621 0.0000
INF -1.108138 0.136813 -8.099676 0.0000
TNR 3.649029 0.710298 5.137320 0.0000
FDI 57.04904 1.733163 32.91614 0.0000
Effects Specification
Cross-section fixed (dummy variables)
Weighted Statistics
R-squared 0.971509 Mean dependent var 3.679436
Adjusted R-squared 0.970360 S.D. dependent var 6.465174
S.E. of regression 0.989187 Sum squared resid 582.2025
F-statistic 845.3767 Durbin-Watson stat 1.569984
Prob(F-statistic) 0.000000
Unweighted Statistics
R-squared 0.747038 Mean dependent var 1160.794
Sum squared resid 2.75E+08 Durbin-Watson stat 0.201782
Interpretation of Regression Results
The model to be fitted is
The model fitted is
Base on the probability values, OER, BM, INF, TNR and FDI are all statically significant. Note that all the
regressions are not in the same unit. The average estimated GDP per capita of the selected AU countries when
the effect of OER, BM, INF, TNR and FDI are zero is $193.29. 1.00 unit increase in OER-Official Exchange
Rate (LCU Per US$, Period Average) will lead to a significant reduction in GDP per capita by $0.23 (0.23USD);
if BM-Broad Money (% of GDP) increases by 1.00% then GDP per capita will increase by $24.50; if INF-
Inflation, GDP deflator (Annual %) increases by 1.00% then GDP per capita will decrease by $1.11; if TNR-
Total Natural Resources Rents (% of GDP) increases by 1.00% then GDP per capita will increase by $3.65 and if
FDI-Foreign Direct Investment, Net Inflows (% of GDP) increases by 1.00% then GDP per capita will increase
by $57.05. (Note: All the estimated parameters are significant at 5% without exception)
Table 3 also shows that 97.2% of the total variation in GDP per capita of the selected AU countries can
be explained by the variations in OER-Official Exchange Rate (LCU Per US$, Period Average), BM-Broad
Money (% of GDP), INF-Inflation, GDP deflator (Annual %), TNR-Total Natural Resources Rents (% of GDP)
and FDI-Foreign Direct Investment, Net Inflows (% of GDP) while the remaining 2.8% could be explained by
other variables other than the ones used in this model (Note: this is for the weighted statistics). While the
unweighted statistics shows that 74.7% of the total variation in GDP per capita of the selected AU countries can
be explained by the variations in OER-Official Exchange Rate (LCU Per US$, Period Average), BM-Broad
Money (% of GDP), INF-Inflation, GDP deflator (Annual %), TNR-Total Natural Resources Rents (% of GDP)
and FDI-Foreign Direct Investment, Net Inflows (% of GDP) while the remaining 25.3% could be explained by
other variables other than the ones used in this model.
8. Developing Country Studies www.iiste.org
ISSN 2224-607X (Paper) ISSN 2225-0565 (Online)
Vol.4, No.21, 2014
79
Reference
[1] Afees A. Salisu (2011), Introduction to Panel Data Analysis. Centre for Econometrics and Allied
Research, Department of Economics, University of Ibadan, Nigeria.
[2] Amemiya, T. and T.E. MaCurdy, 1986, Instrumental-variable estimation of an error components model,
Econometrica 54, 869-881.
[3] Anderson and Hsiao (1981). Estimation of dynamic models with error components. Journal of the
American Statistical Association 76:598|606
[4] Badi H. Baltagi “PANEL DATA METHODS- Prepared for the Handbook of Applied Economic
Statistics” Department of Economics, Texas A&M University, College Station, TX 77843-4228, Office:
(409) 845-7380, Fax: 409) 847-8757, E-mail: E304bb@tamvm1.tamu.edu.
[5] Balestra, P. and Nerlove, M. 1966. Pooling cross section and time series data in the estimation of a
dynamic model: the demand for natural gas. Econometrica 34, 585–612.
[6] Baltagi, B. H. (2008). Econometric Analysis of Panel Data. Fourth Edition. John Wiley & Sons Ltd.
[7] Baltagi, B. H. 2001. Econometric Analysis of Panel Data. 2d ed. New York: John Wiley & Sons.
[8] Baltagi, B.H. and Q. Li, 1991, A transformation that will circumvent the problem of autocorrelation in
an error component model, Journal of Econometrics 48, 385-393.
[9] Baltagi, B.H. and Q. Li, 1992, Prediction in the one-way error component model with serial correlation,
Journal of Forecasting 11, 561-567.
[10] Baltagi, B.H. and Q. Li, Testing AR(1) Against MA(1) Disturbances in an Error Components Model,
Journal of Econometrics, 68, 1995, 133-151.
[11] Baltagi, B.H., 1980, On seemingly unrelated regressions with error components, Econometrica 48,
1547-1551.
[12] Baltagi, B.H., 1995a, Editor's introduction: panel data, Journal of Econometrics 68, 1-4.
[13] Baltagi, B.H., 1995b, Econometric analysis of panel data (Chichester: Wiley).
[14] Batagi, B.H., G. Bresson, and A. Priotte, Joint LM Test for Homoscedasticity in a One-Way Error
Component Model, Journal of Econometrics, 134, 2006, 401-417.
[15] Breusch, T. and A. Pagan, “A Simple Test of Heteroscedasticity and Random Coefficient Variations,”
Econometrica, 47, 1979, 1287-1294.
[16] Breusch, T. and A. Pagan, “The LM Test and Its Applications to Model Specification in Econometrics,”
Review of Economic Studies, 47, 1980, 239-254.
[17] Breusch, T. and L.G. Godfrey, A Review of Recent Work on Testing for Autocorrelation in Dynamic
Simultaneous Models, in D.A. Currie, R. Nobay and D. Peel (eds.), Macroeconomic Analysis, Essays in
Macroeconomics and Economics (Croom Helm, London), 63-100.
[18] Davidson, R. and Macknnon, J. G. (1993). Estimation and Inference in Econometrics. New York:
Oxford University Press, pp. 320, 323.
[19] Drukker, D. M. (2003): Testing for serial correlation in linear panel-data models. Stata Journal 3:
168|177.
[20] Greene, W. H. (2003). Econometric Analysis 5th
ed. Upper Saddle River. Prentice Hall, pp. 285, 291,
293, 304.
[21] Gujarati, D. (2003). Basic Econometrics, eth ed. New York: McGraw Hill, pp. 638-640.
[22] Gustavo Sanchez (2012): Fitting Panel Data Linear Models in Stata, Senior Statistician, StataCorp LP,
Puebla, Mexico.
[23] Hsiao, C. (2003). Analysis of Panel Data. Cambridge University Press, Cambridge.
[24] International Monetary Fund, International Financial Statistics and data files and OECD GDP estimates.
Balance of Payments databases, World Bank, International Debt Statistics.
[25] Montes-Rojas, G. and W. Sosa-Escudero, Robust Tests for Heteroscedasticity in the One-Way Error
Components Model, Journal of Econometrics, 2011, forthcoming.
[26] Robert A. Yaffee (2003): A primer for Panel Data Analyss.
[27] Woolridge, J. (2002). Econometric Analysis of Cross-Section and Panel Data. MIT Press, pp. 130, 279,
420 – 449.
[28] World Bank national accounts data, and OECD National Accounts data files. Catalog Sources World
Development Indicators.
9. Business, Economics, Finance and Management Journals PAPER SUBMISSION EMAIL
European Journal of Business and Management EJBM@iiste.org
Research Journal of Finance and Accounting RJFA@iiste.org
Journal of Economics and Sustainable Development JESD@iiste.org
Information and Knowledge Management IKM@iiste.org
Journal of Developing Country Studies DCS@iiste.org
Industrial Engineering Letters IEL@iiste.org
Physical Sciences, Mathematics and Chemistry Journals PAPER SUBMISSION EMAIL
Journal of Natural Sciences Research JNSR@iiste.org
Journal of Chemistry and Materials Research CMR@iiste.org
Journal of Mathematical Theory and Modeling MTM@iiste.org
Advances in Physics Theories and Applications APTA@iiste.org
Chemical and Process Engineering Research CPER@iiste.org
Engineering, Technology and Systems Journals PAPER SUBMISSION EMAIL
Computer Engineering and Intelligent Systems CEIS@iiste.org
Innovative Systems Design and Engineering ISDE@iiste.org
Journal of Energy Technologies and Policy JETP@iiste.org
Information and Knowledge Management IKM@iiste.org
Journal of Control Theory and Informatics CTI@iiste.org
Journal of Information Engineering and Applications JIEA@iiste.org
Industrial Engineering Letters IEL@iiste.org
Journal of Network and Complex Systems NCS@iiste.org
Environment, Civil, Materials Sciences Journals PAPER SUBMISSION EMAIL
Journal of Environment and Earth Science JEES@iiste.org
Journal of Civil and Environmental Research CER@iiste.org
Journal of Natural Sciences Research JNSR@iiste.org
Life Science, Food and Medical Sciences PAPER SUBMISSION EMAIL
Advances in Life Science and Technology ALST@iiste.org
Journal of Natural Sciences Research JNSR@iiste.org
Journal of Biology, Agriculture and Healthcare JBAH@iiste.org
Journal of Food Science and Quality Management FSQM@iiste.org
Journal of Chemistry and Materials Research CMR@iiste.org
Education, and other Social Sciences PAPER SUBMISSION EMAIL
Journal of Education and Practice JEP@iiste.org
Journal of Law, Policy and Globalization JLPG@iiste.org
Journal of New Media and Mass Communication NMMC@iiste.org
Journal of Energy Technologies and Policy JETP@iiste.org
Historical Research Letter HRL@iiste.org
Public Policy and Administration Research PPAR@iiste.org
International Affairs and Global Strategy IAGS@iiste.org
Research on Humanities and Social Sciences RHSS@iiste.org
Journal of Developing Country Studies DCS@iiste.org
Journal of Arts and Design Studies ADS@iiste.org
10. The IISTE is a pioneer in the Open-Access hosting service and academic event management.
The aim of the firm is Accelerating Global Knowledge Sharing.
More information about the firm can be found on the homepage:
http://www.iiste.org
CALL FOR JOURNAL PAPERS
There are more than 30 peer-reviewed academic journals hosted under the hosting platform.
Prospective authors of journals can find the submission instruction on the following
page: http://www.iiste.org/journals/ All the journals articles are available online to the
readers all over the world without financial, legal, or technical barriers other than those
inseparable from gaining access to the internet itself. Paper version of the journals is also
available upon request of readers and authors.
MORE RESOURCES
Book publication information: http://www.iiste.org/book/
IISTE Knowledge Sharing Partners
EBSCO, Index Copernicus, Ulrich's Periodicals Directory, JournalTOCS, PKP Open
Archives Harvester, Bielefeld Academic Search Engine, Elektronische Zeitschriftenbibliothek
EZB, Open J-Gate, OCLC WorldCat, Universe Digtial Library , NewJour, Google Scholar