Download as PDF, PPTX
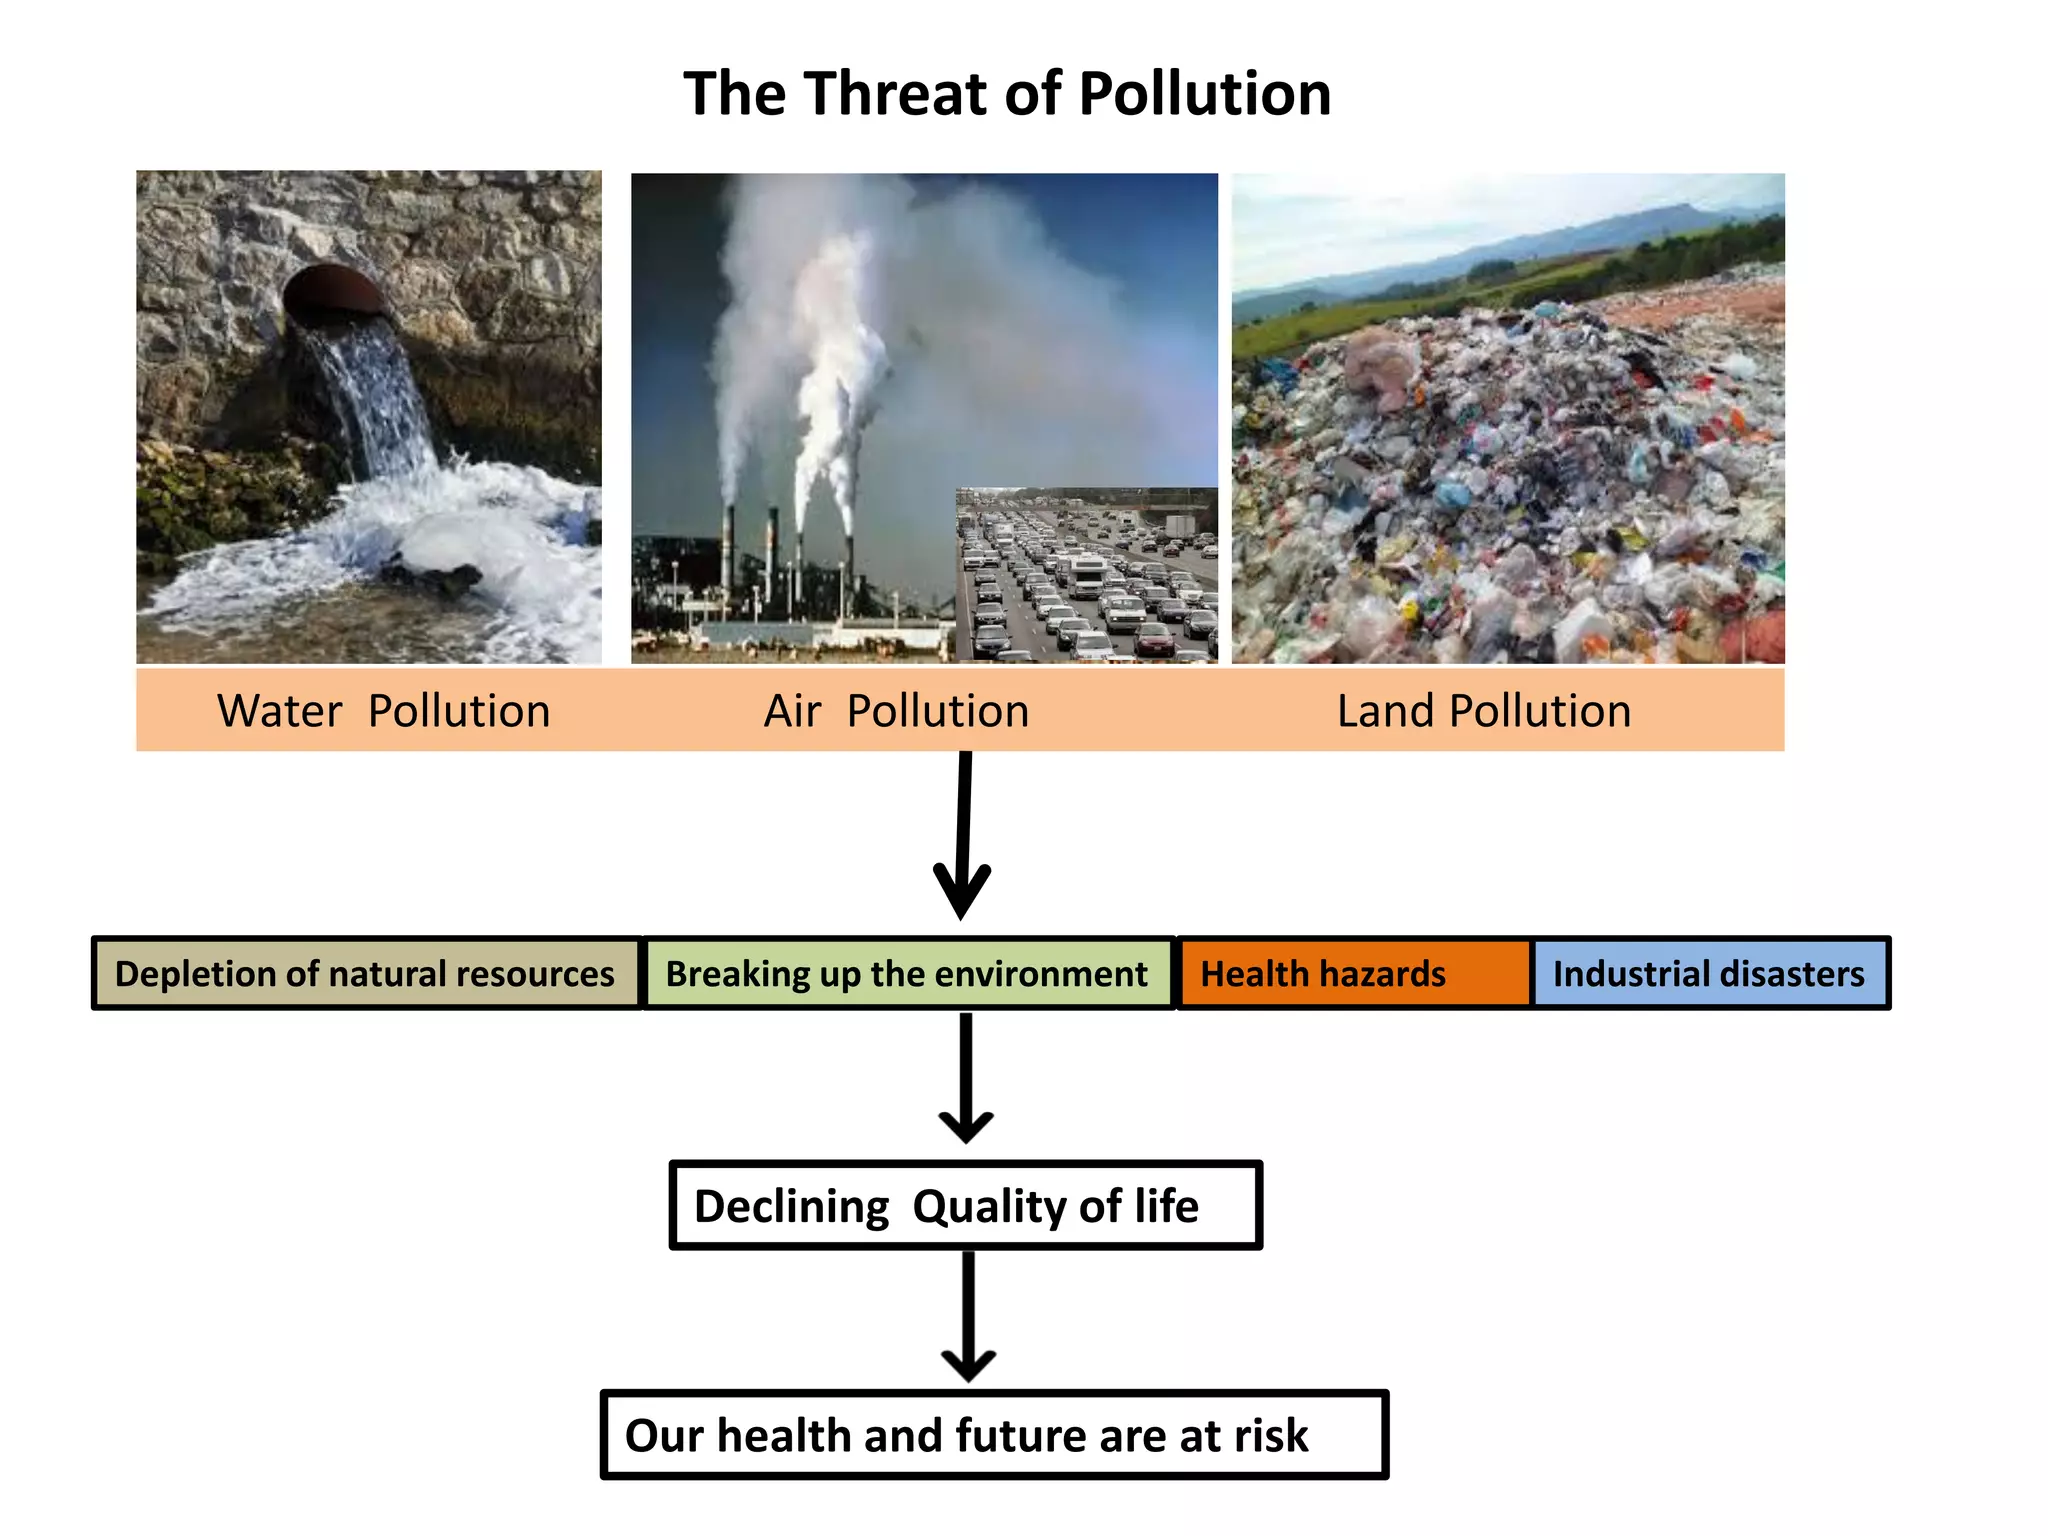
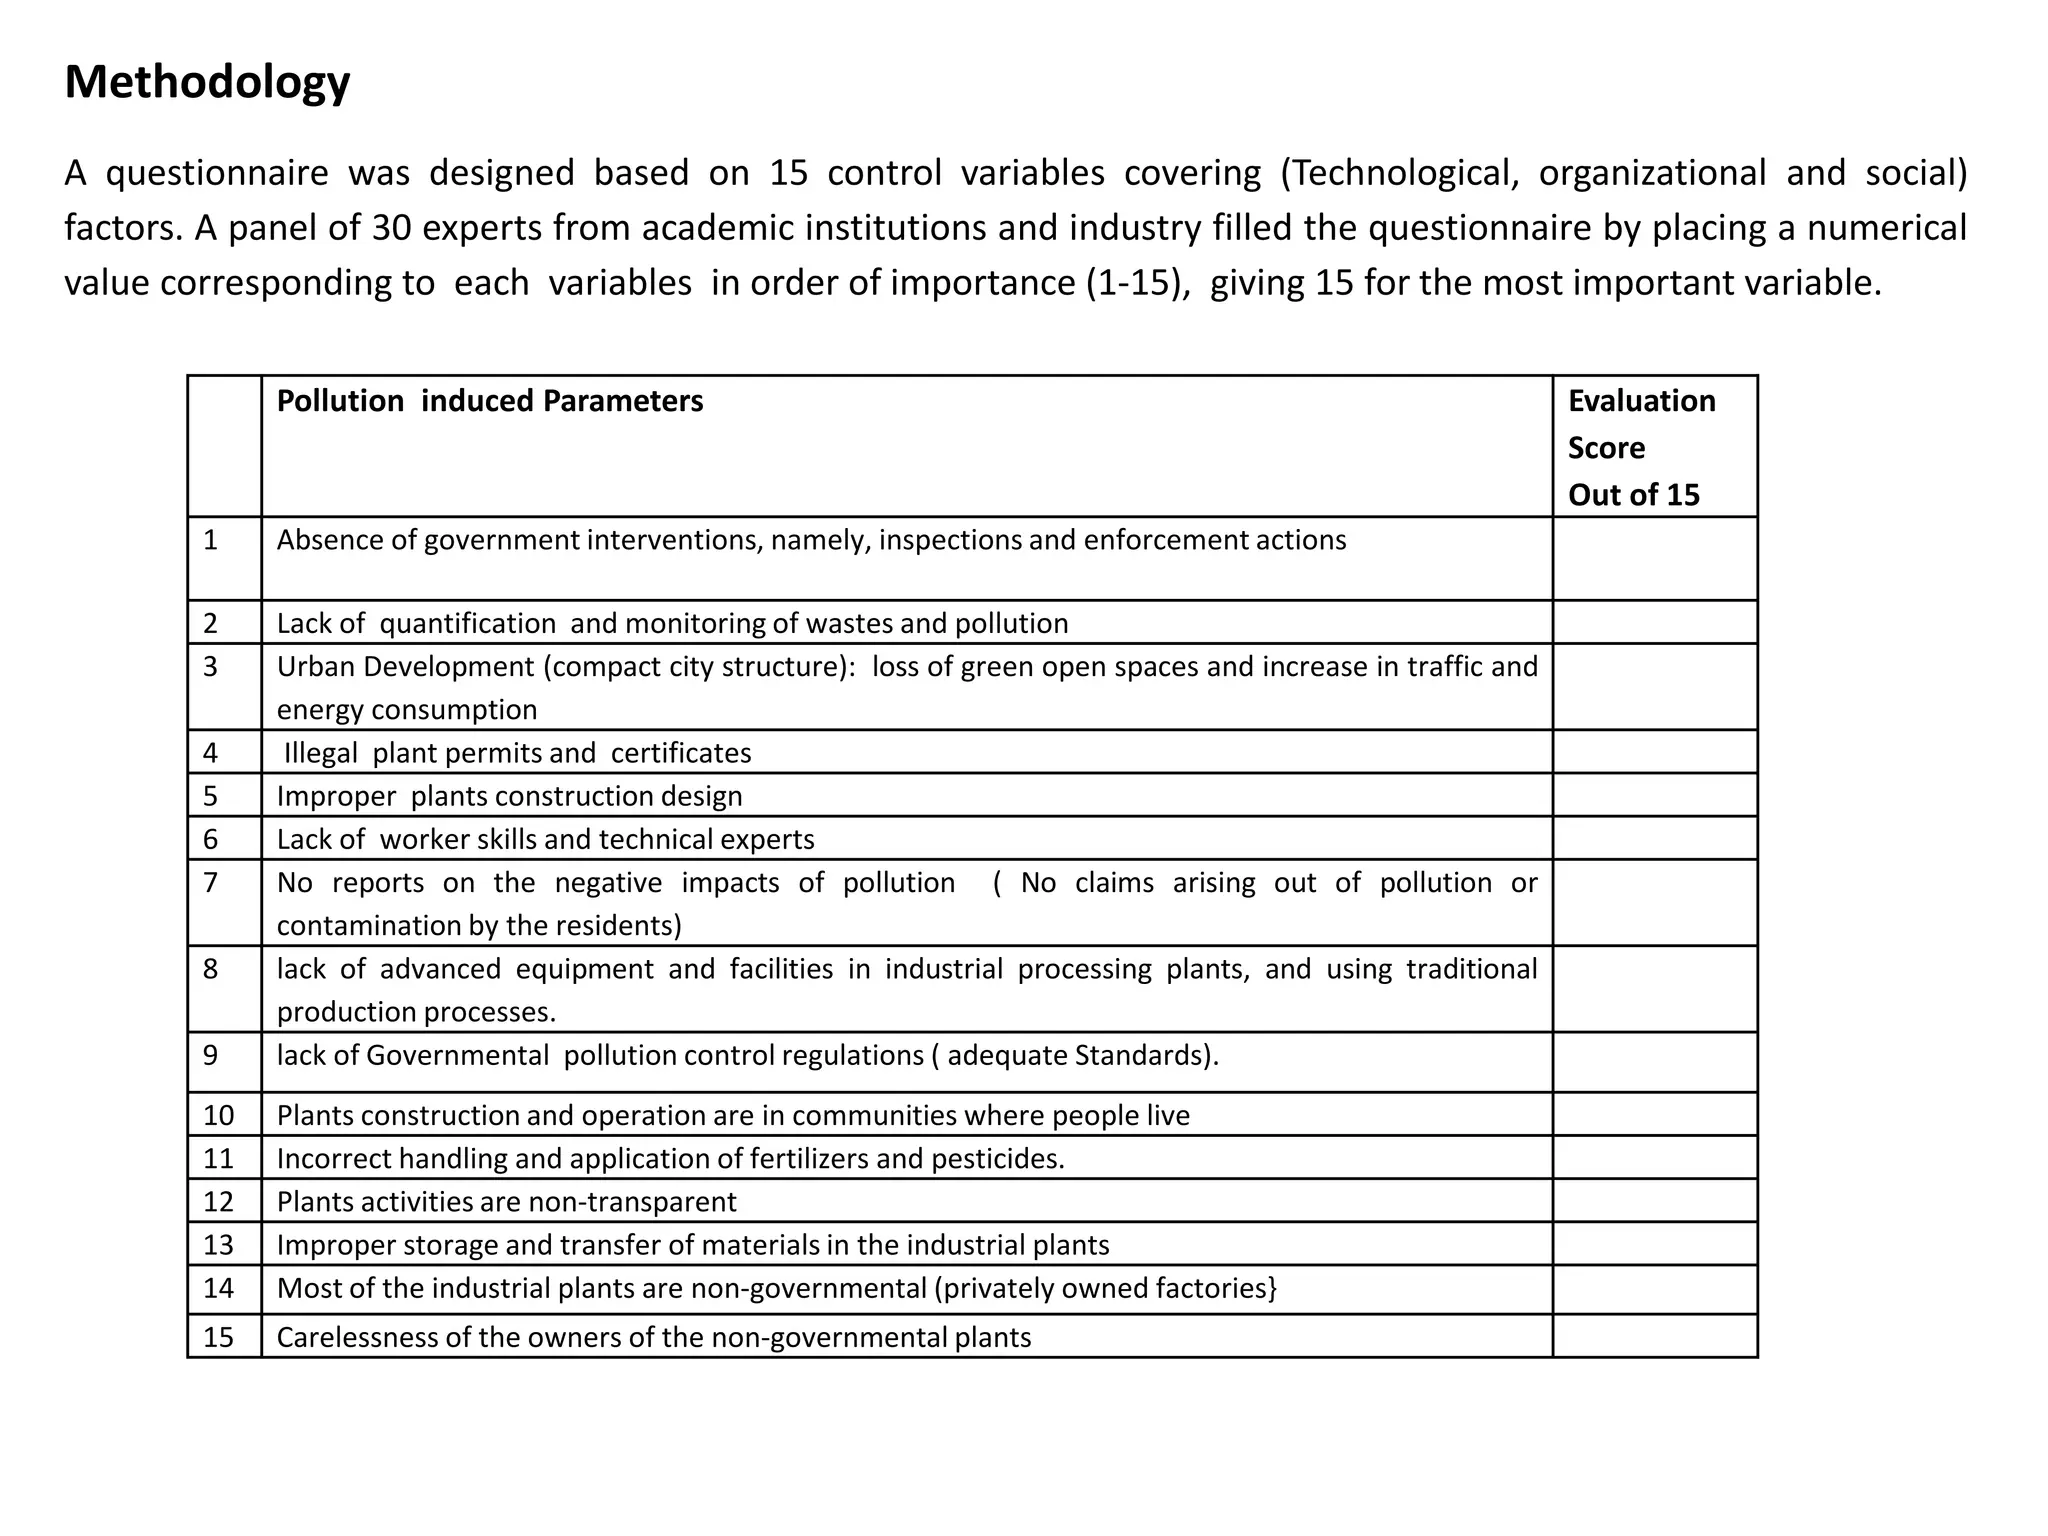
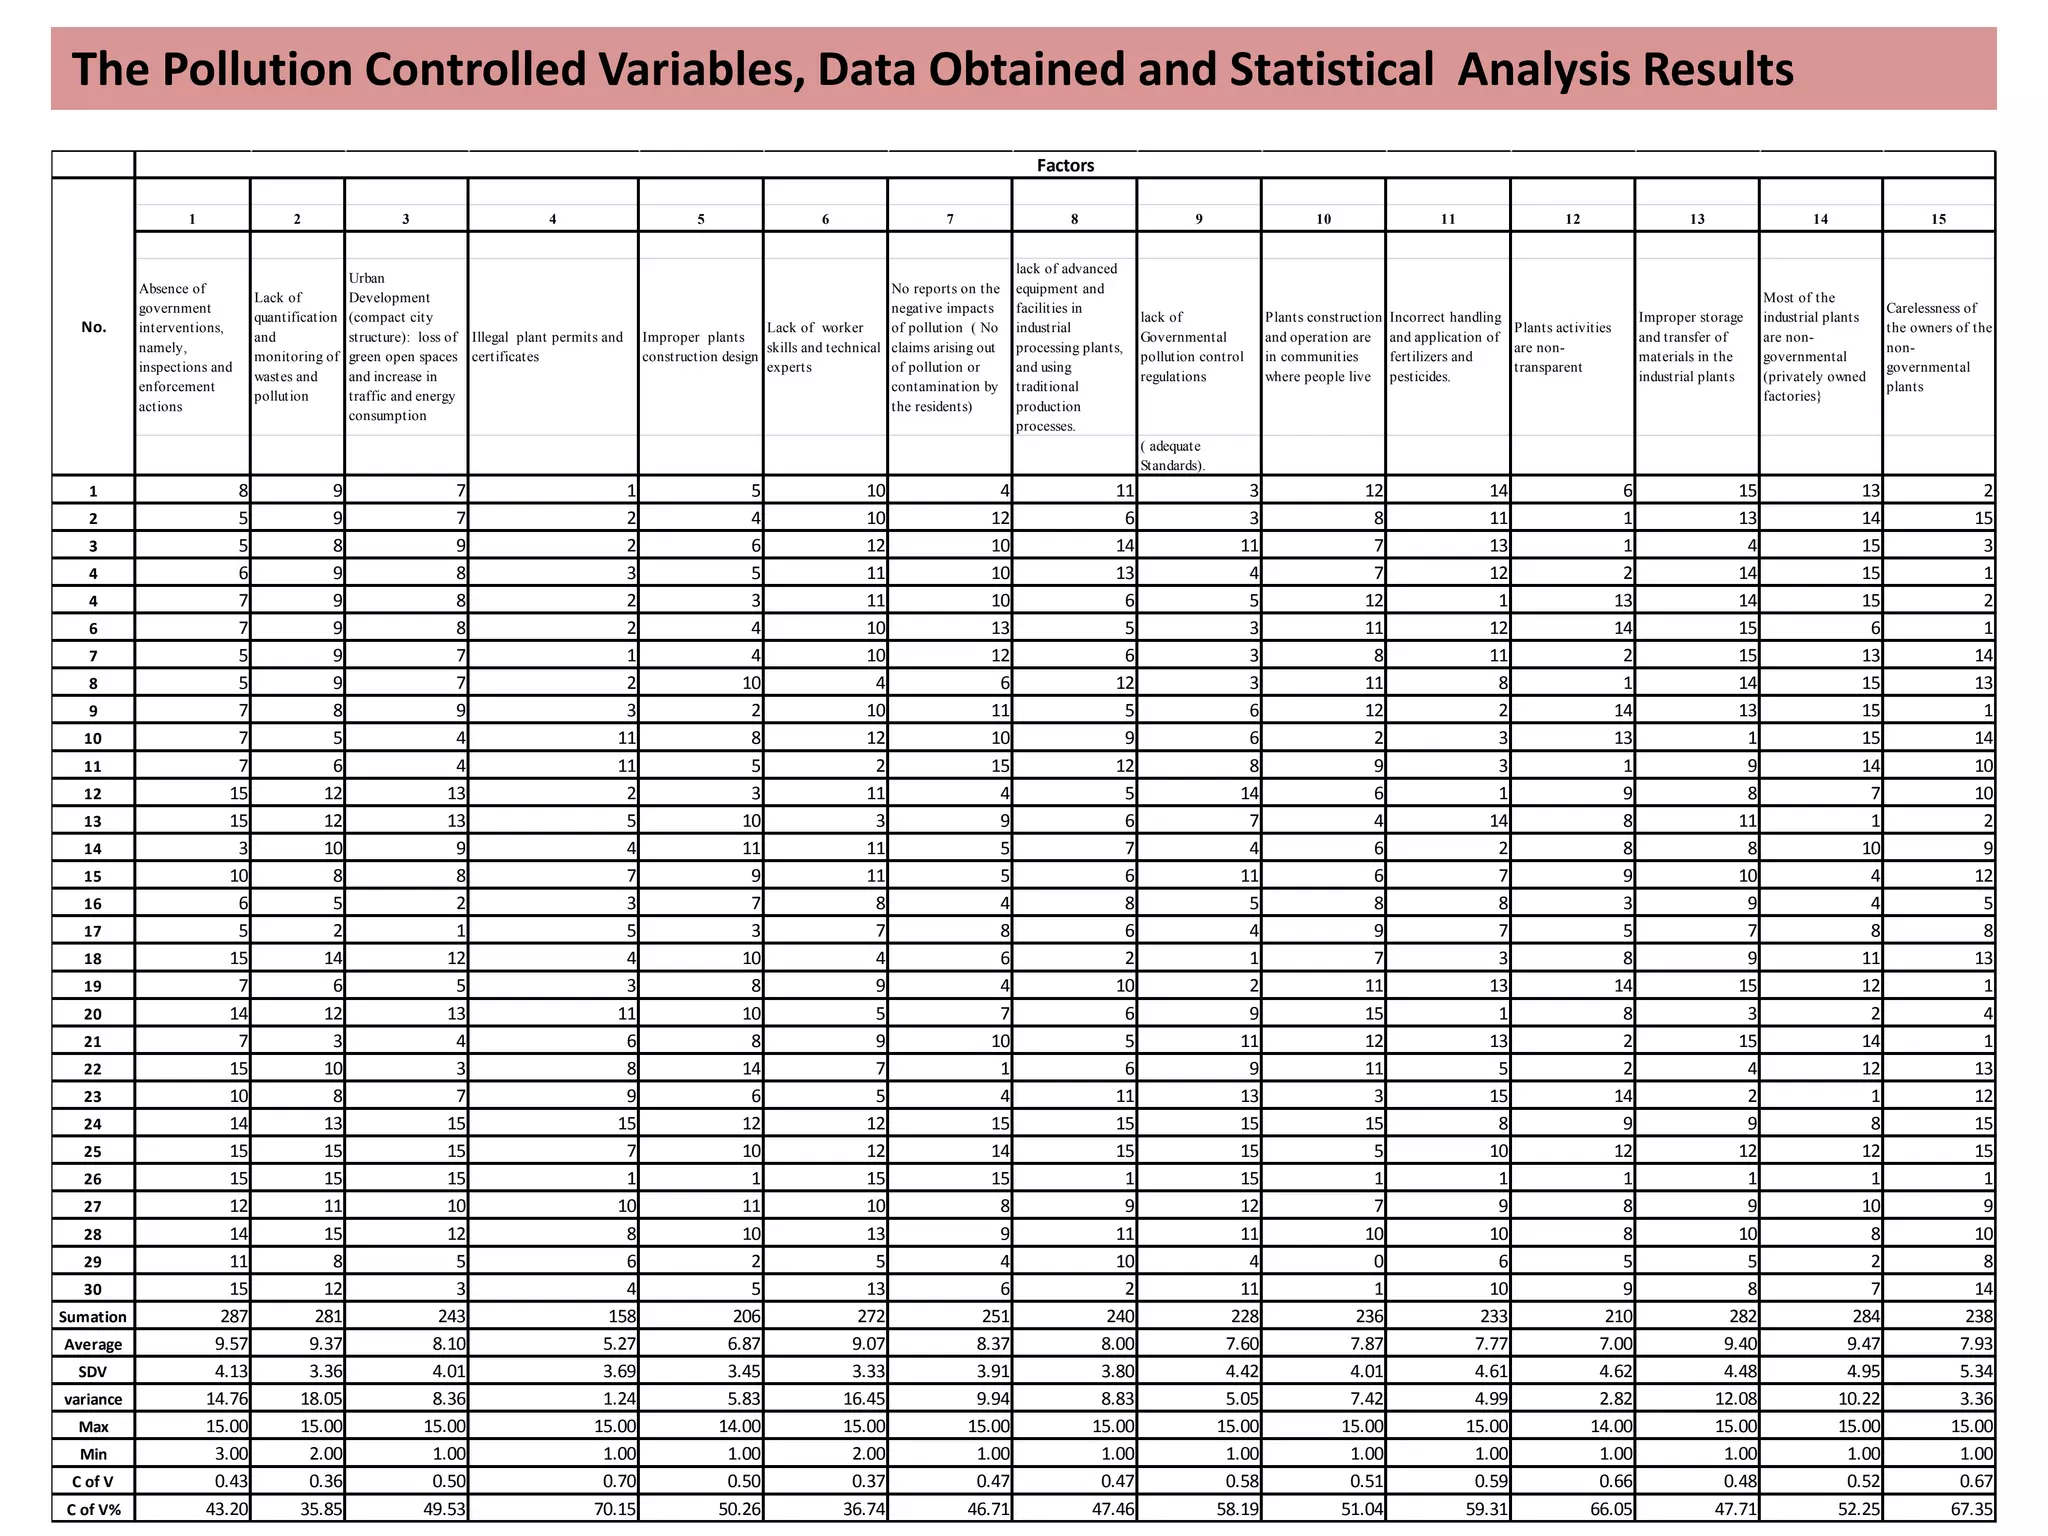
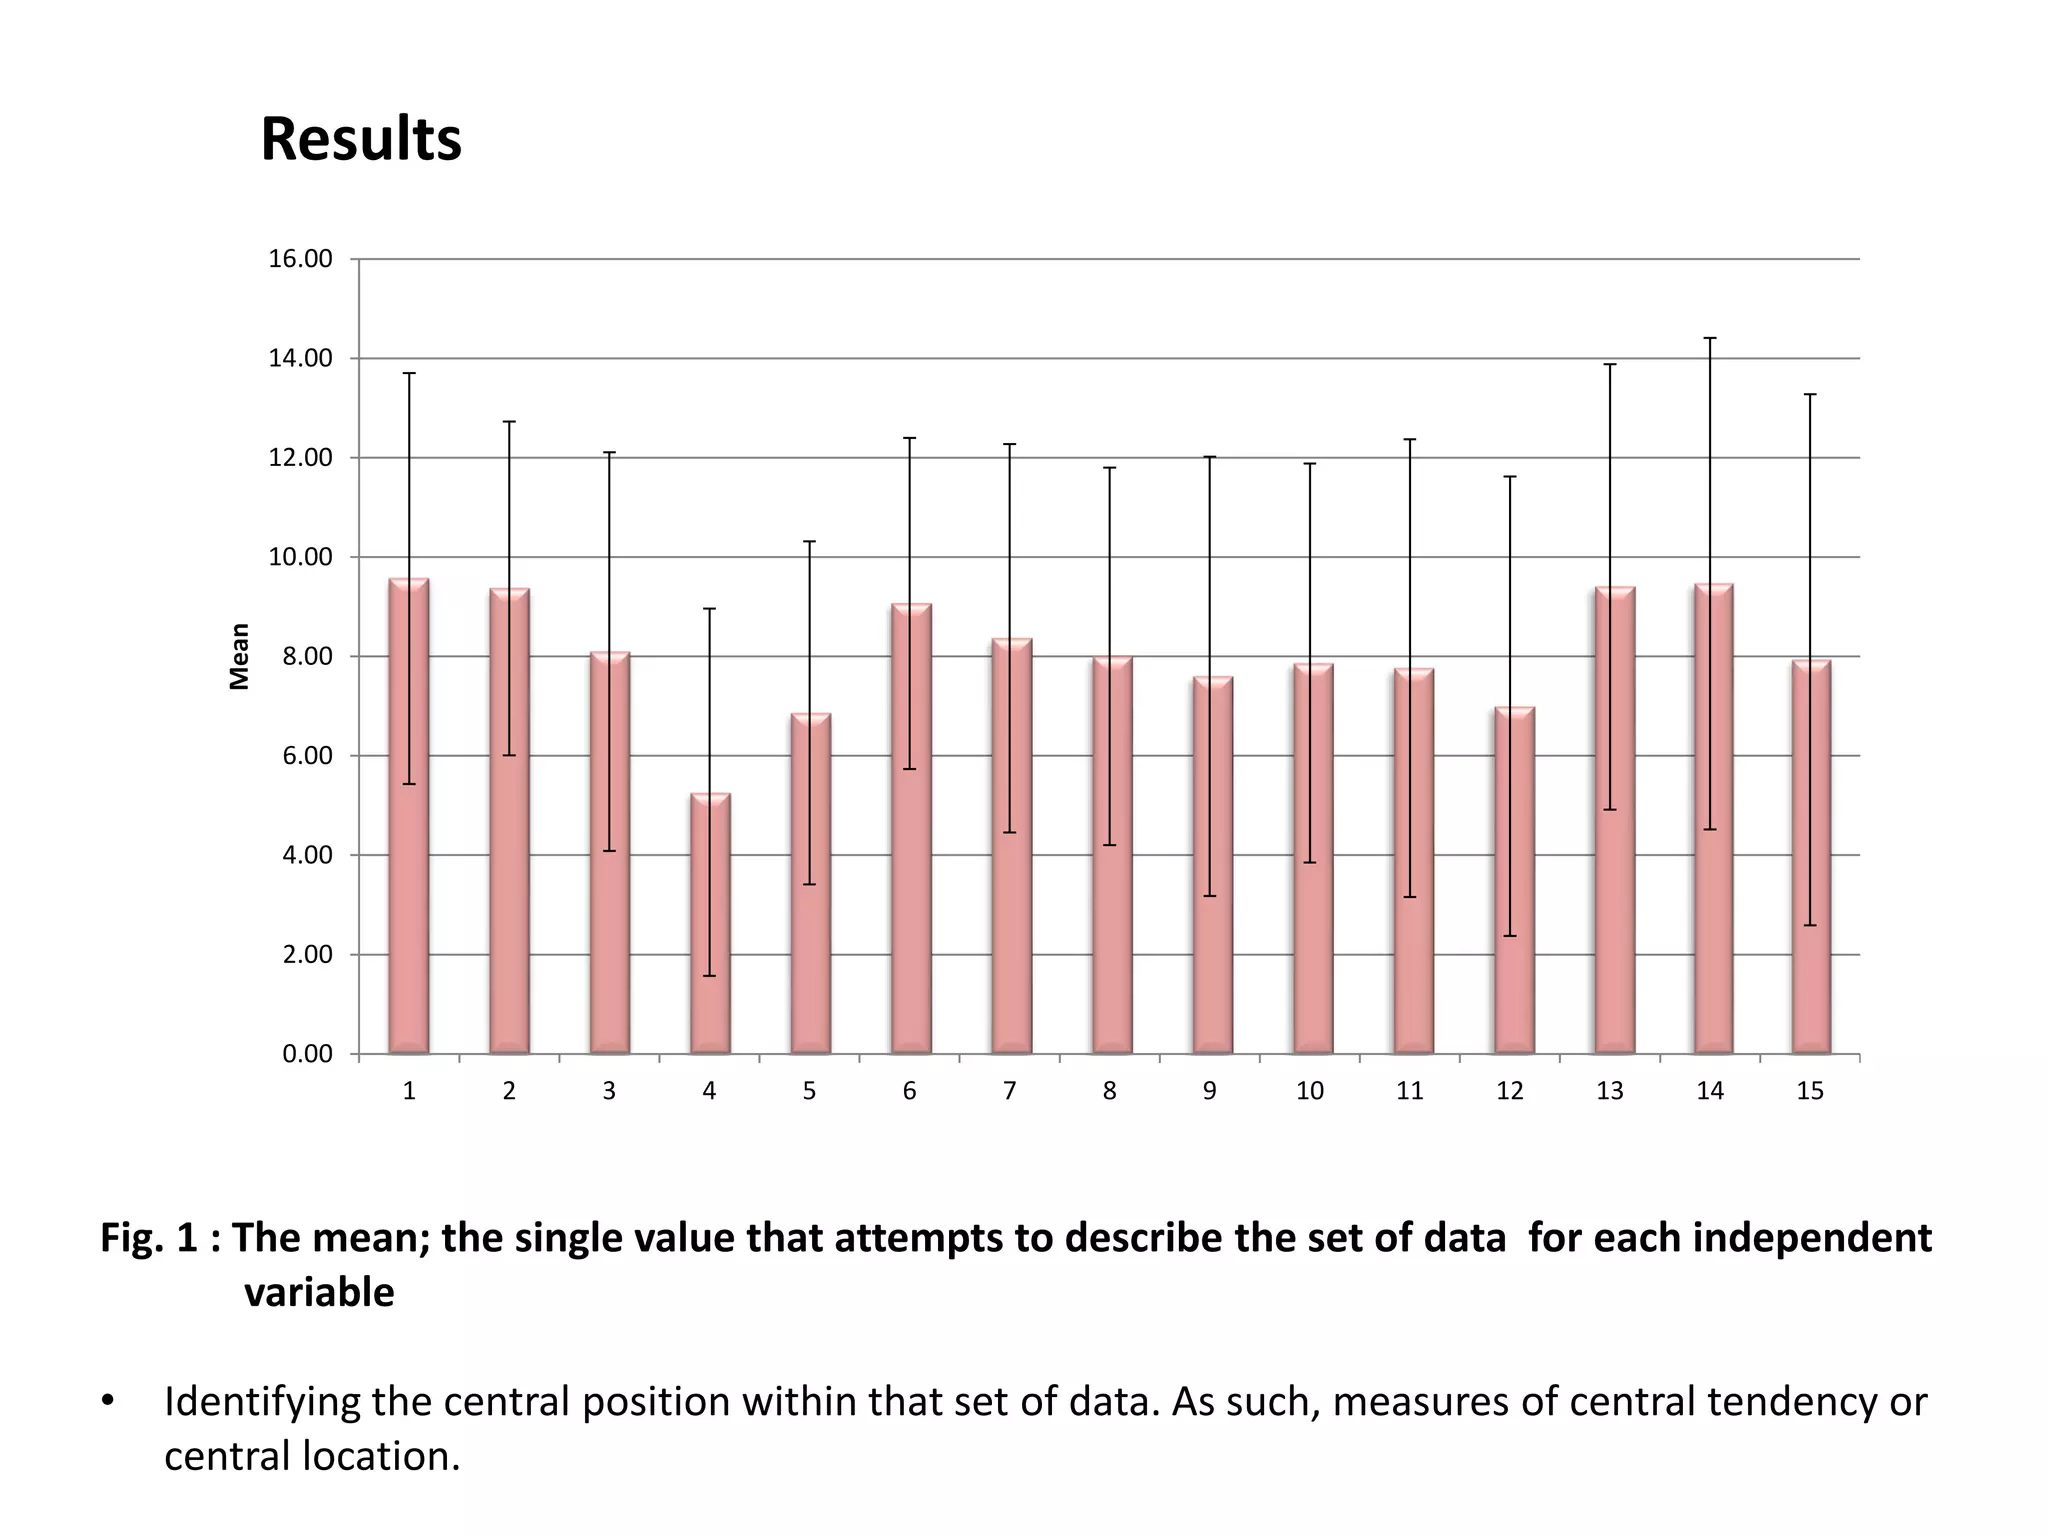
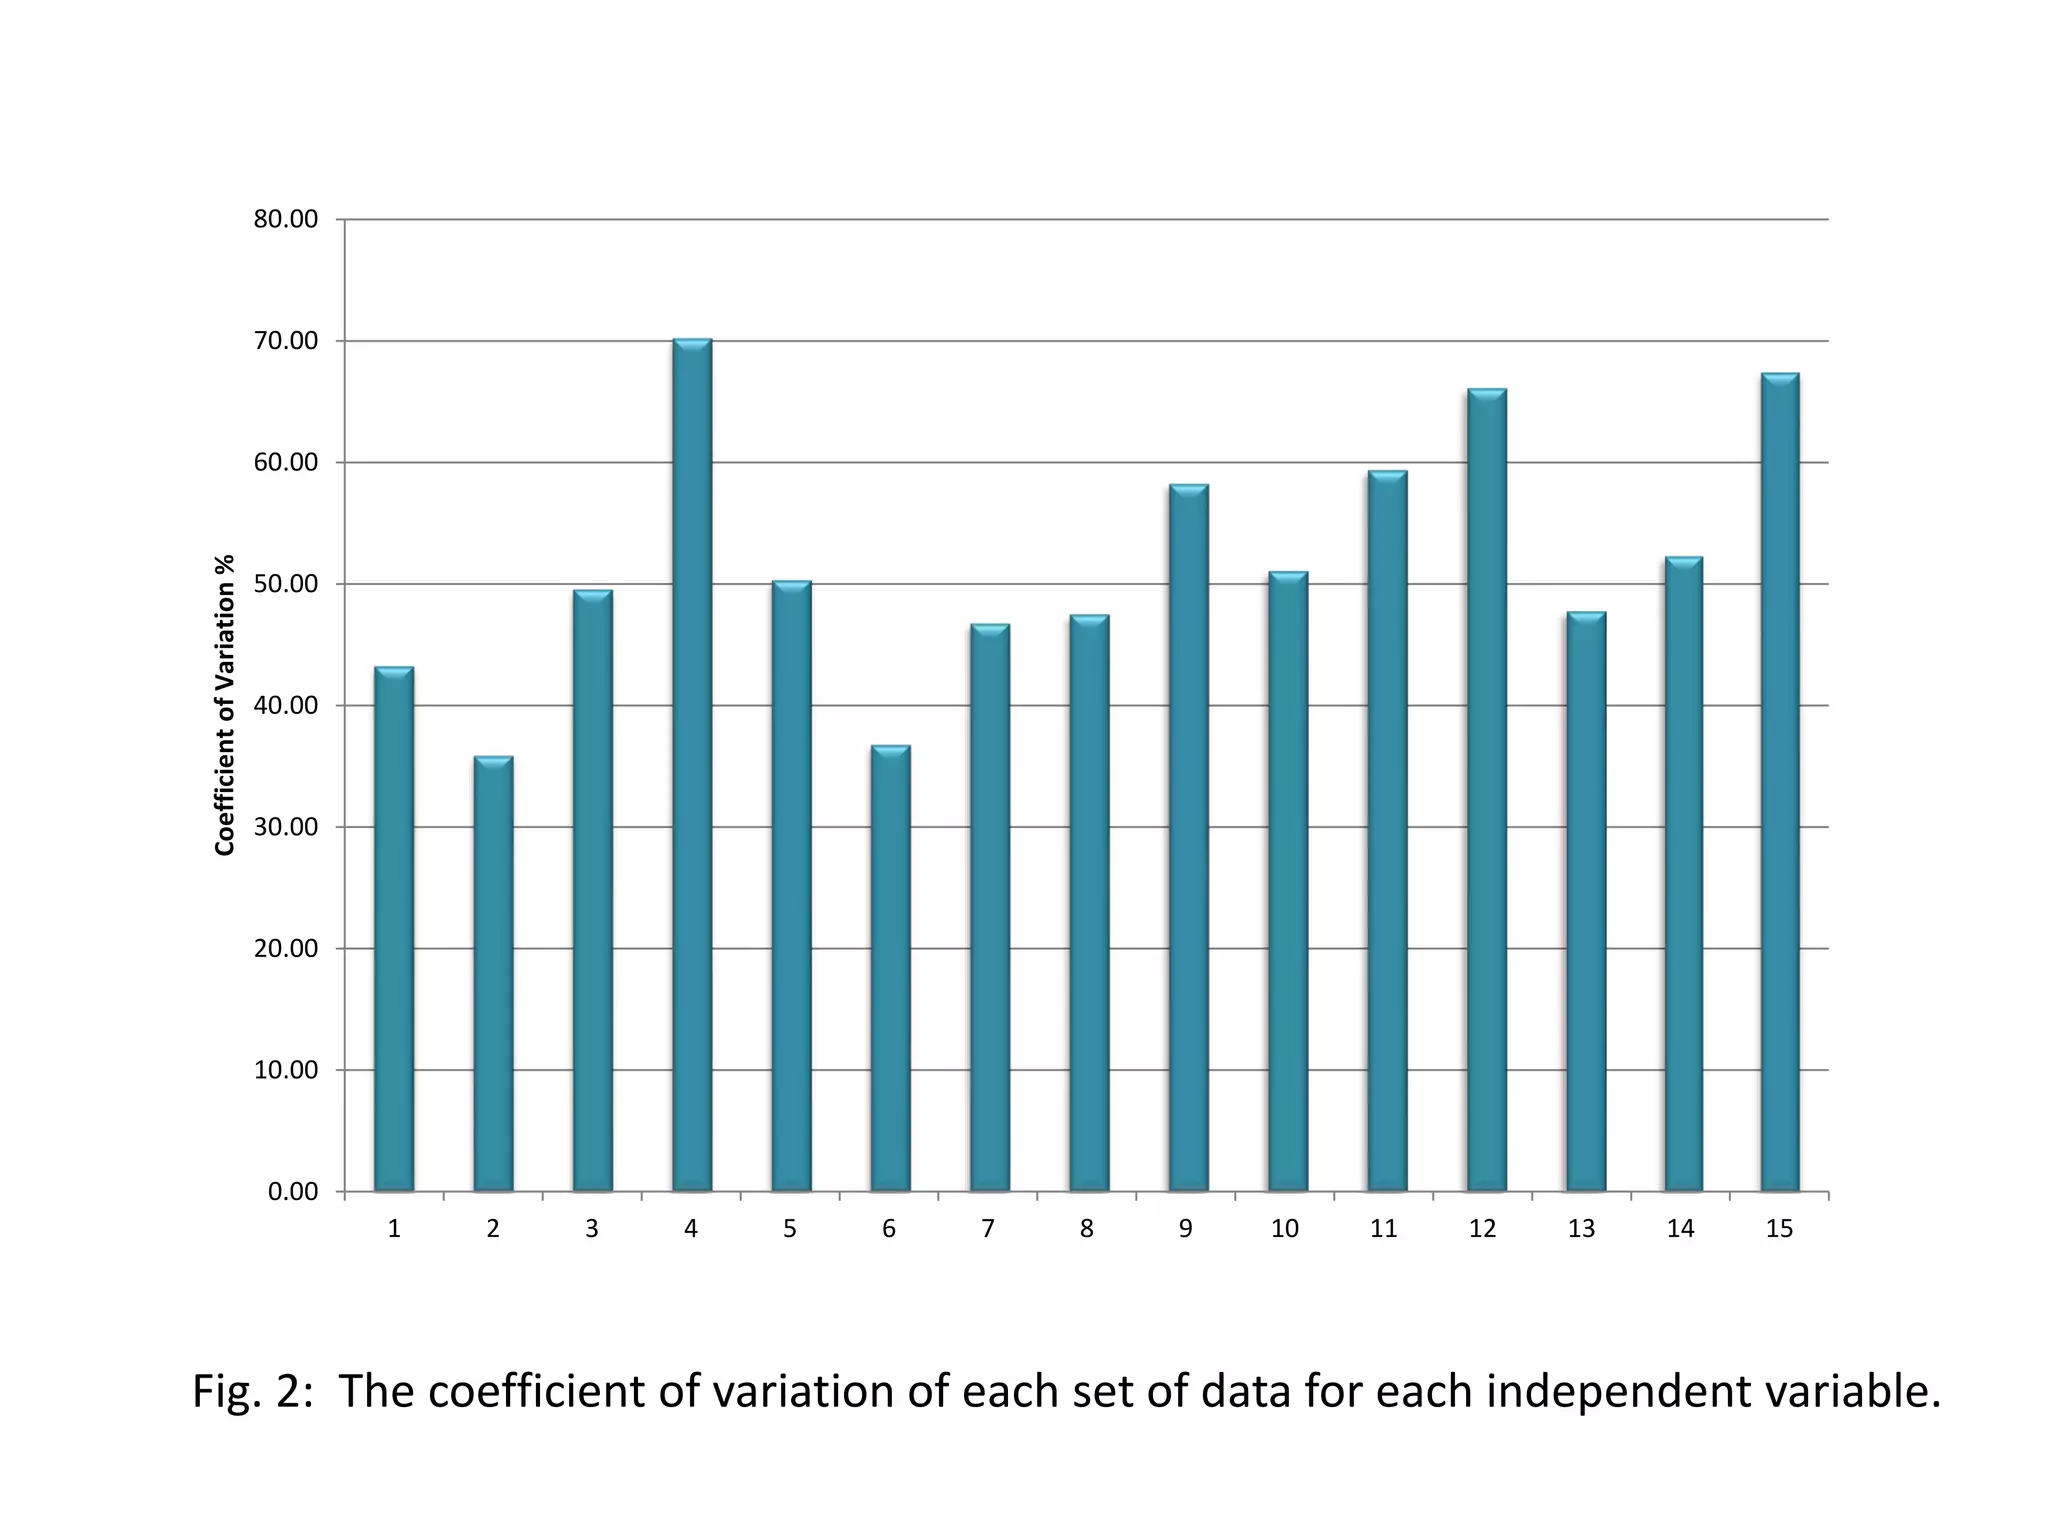
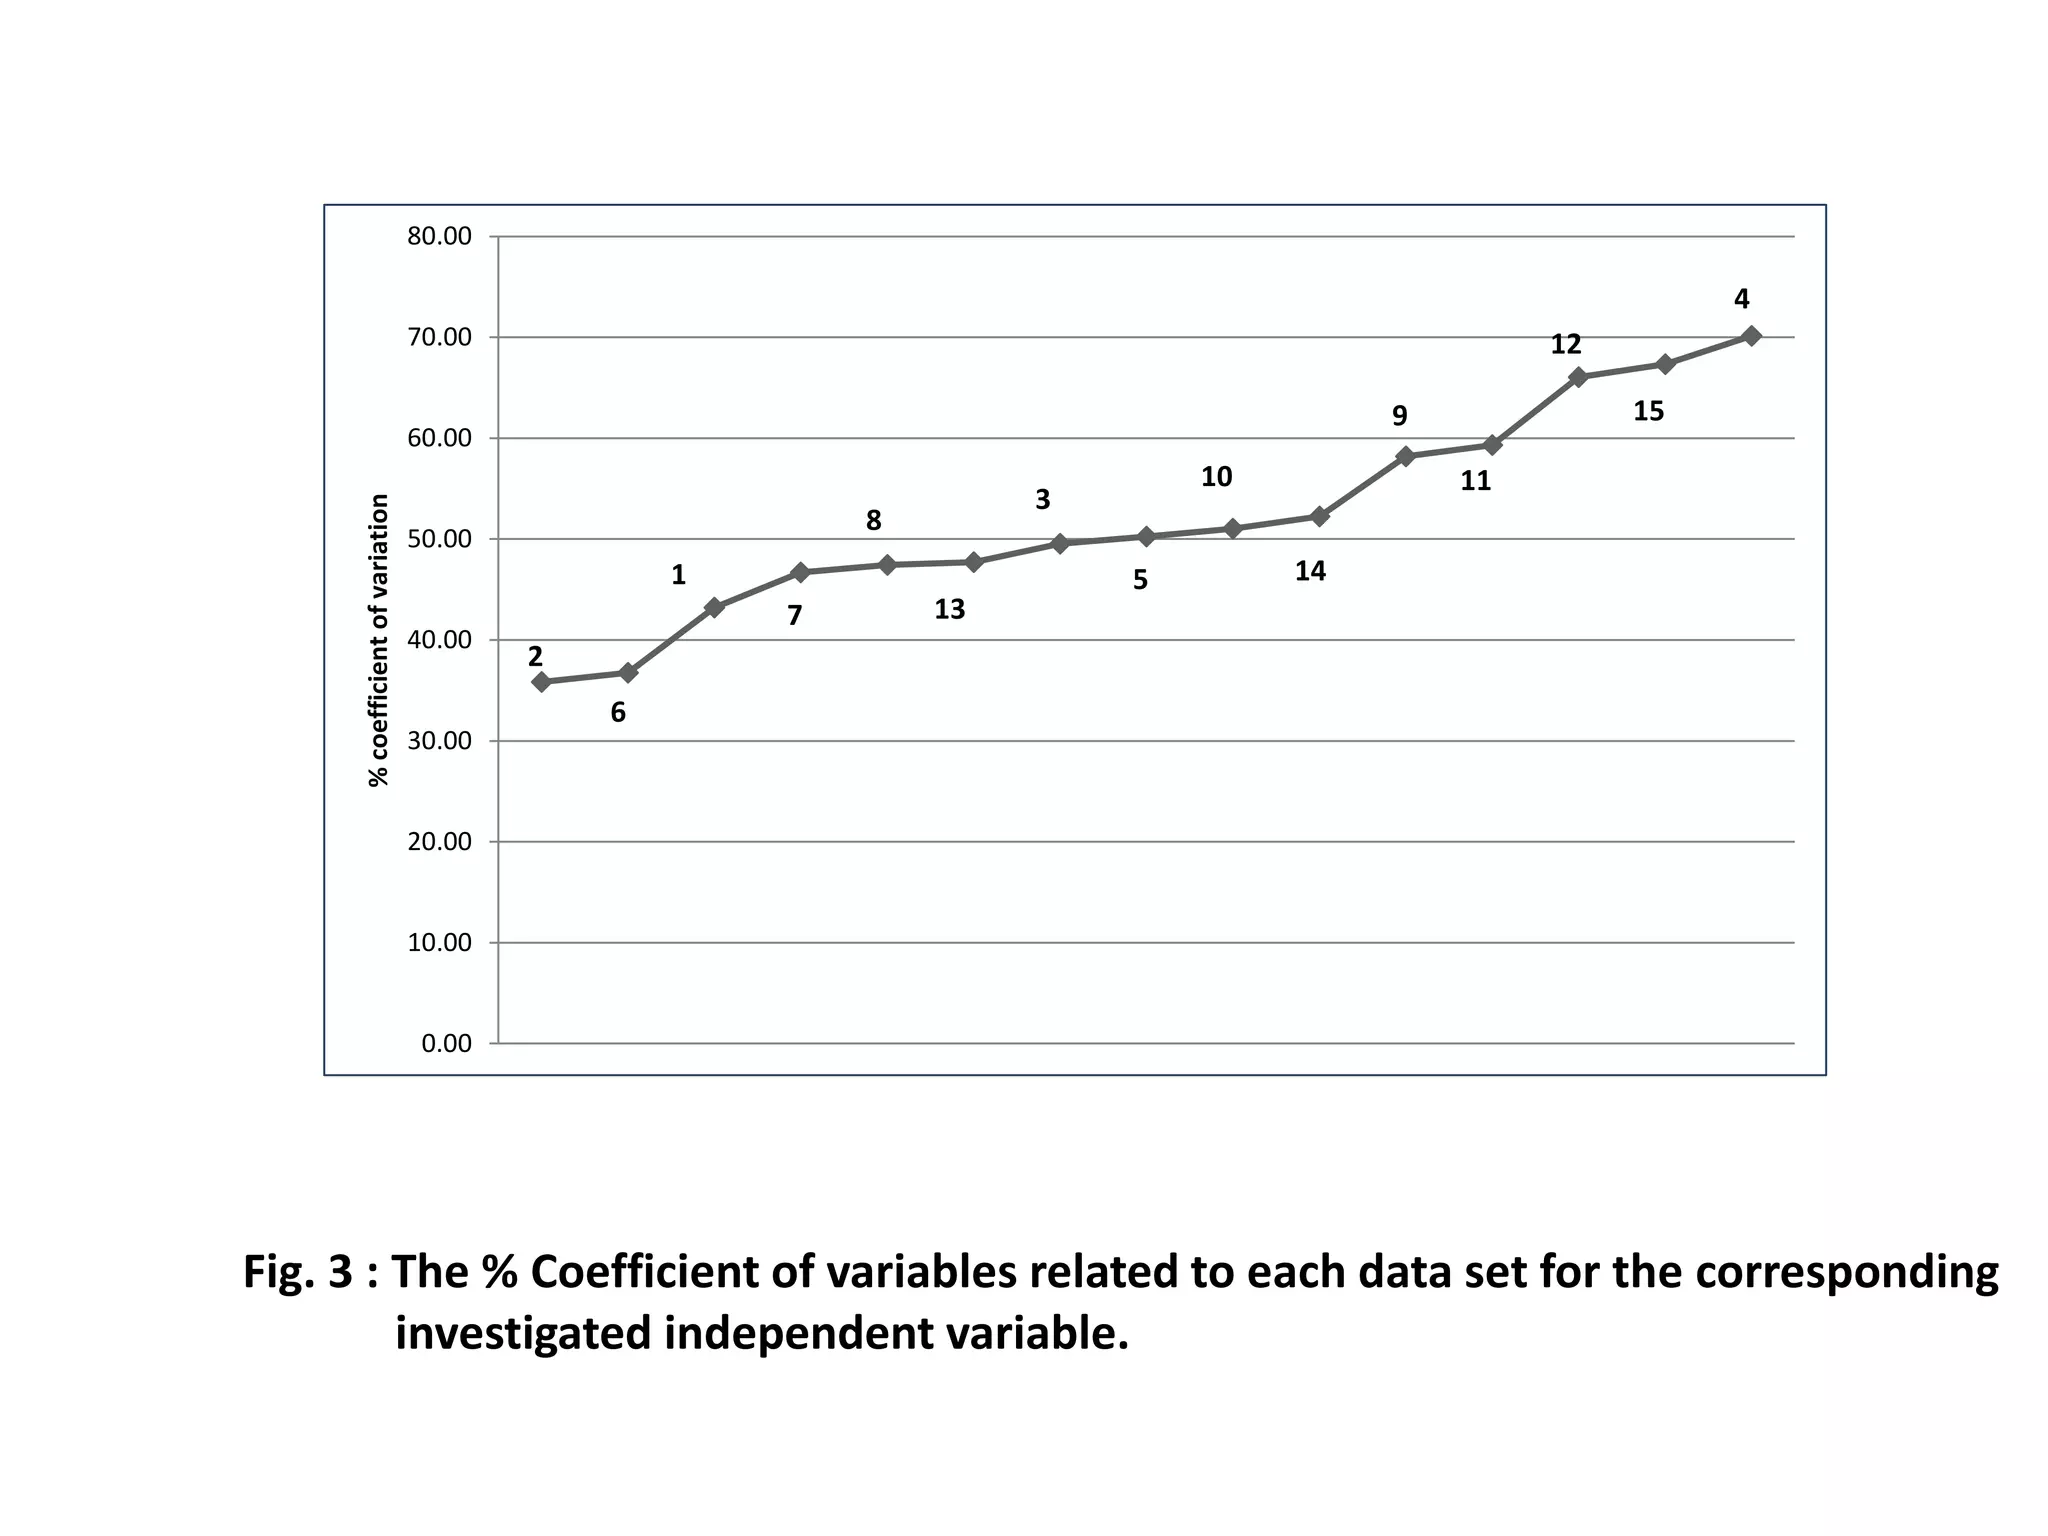
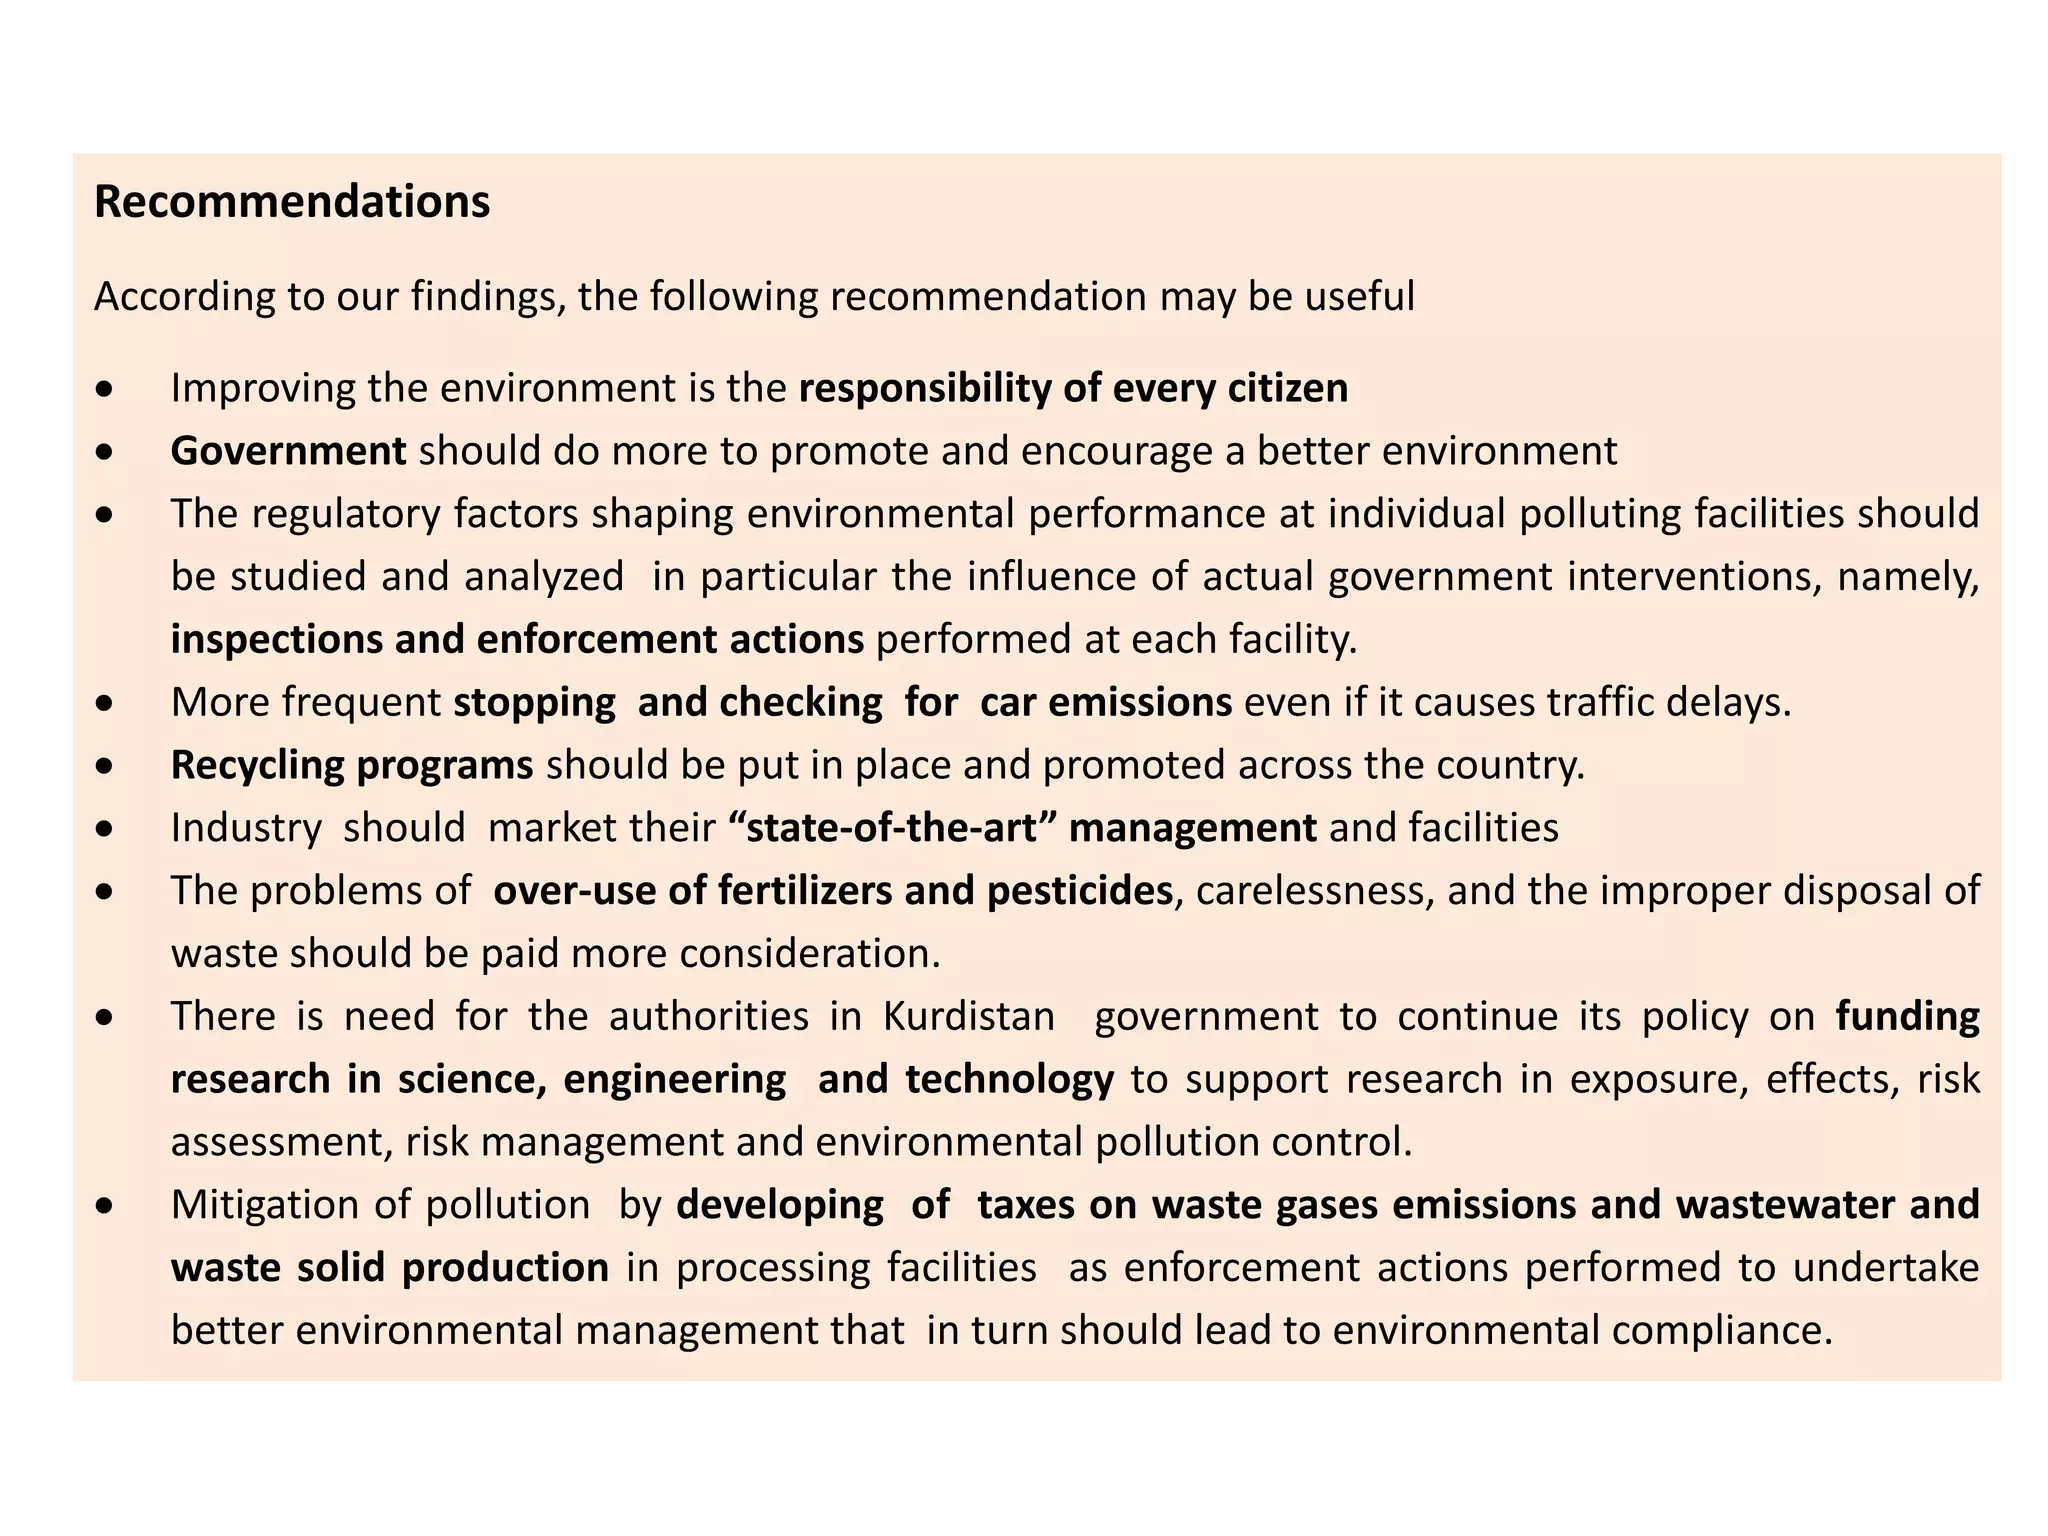
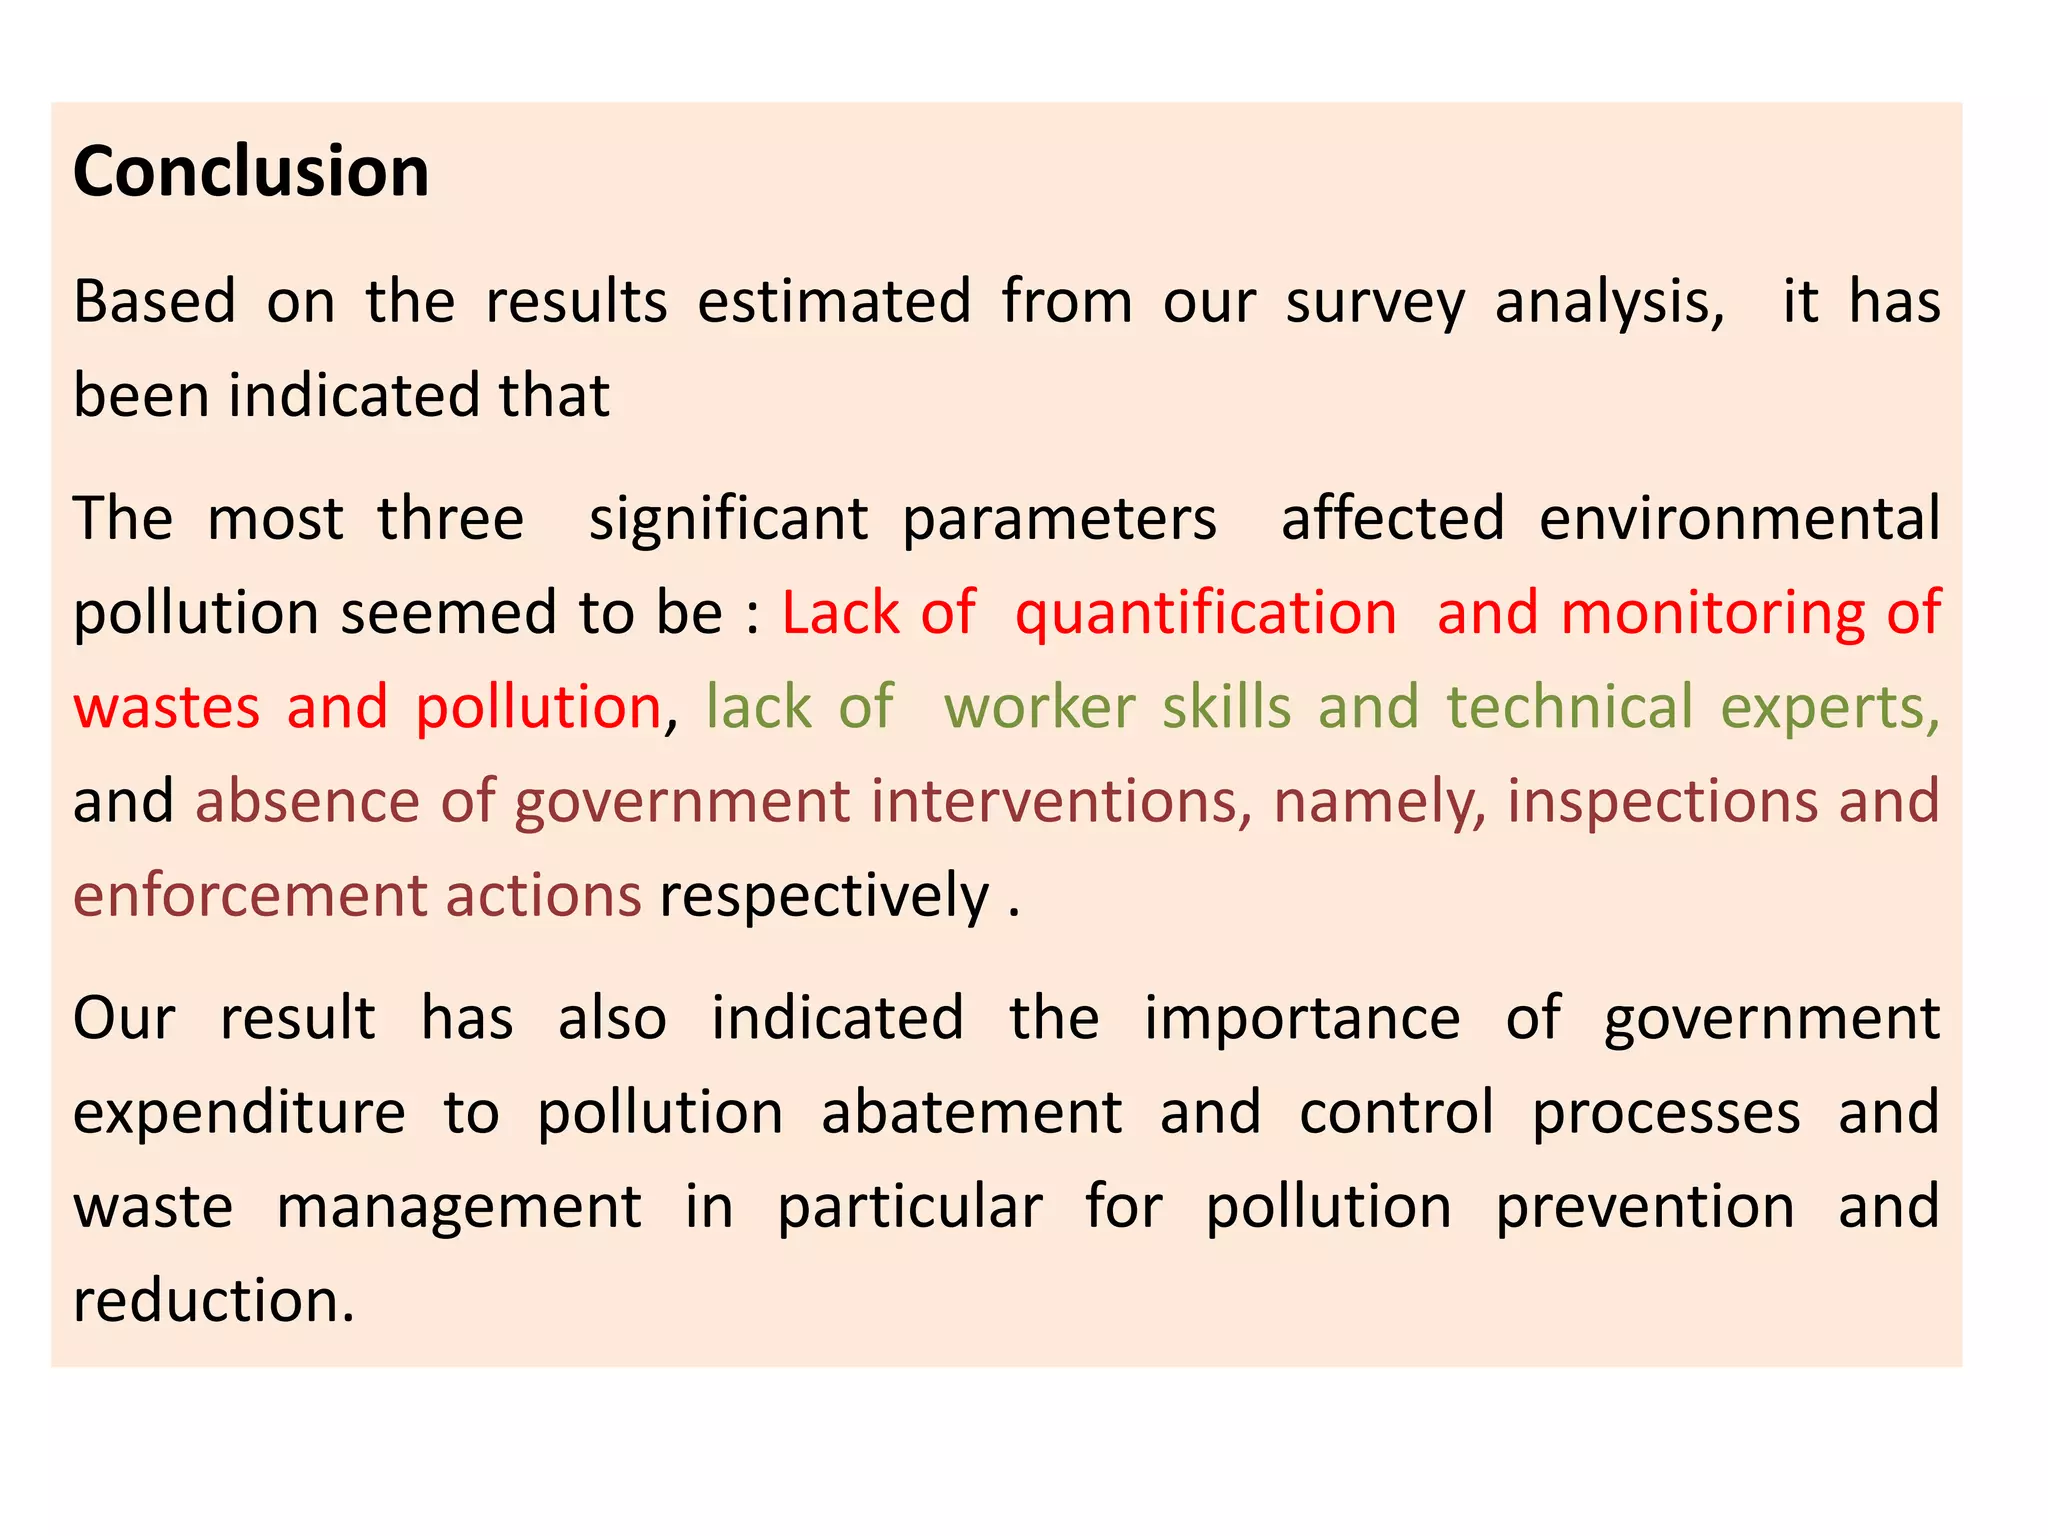


This document summarizes a study on identifying the most significant factors causing environmental pollution in Kurdistan. The study conducted a survey of 30 experts who rated 15 potential factors on their importance. The factors with the highest average ratings were identified as the most significant in causing pollution. These included lack of waste quantification and monitoring, lack of worker skills and technical expertise, and absence of government inspections and enforcement actions. The study recommends improving regulations and enforcement, promoting recycling, reducing pesticide and fertilizer use, conducting more research on pollution impacts, and developing taxes to incentivize private industry to improve environmental management.


