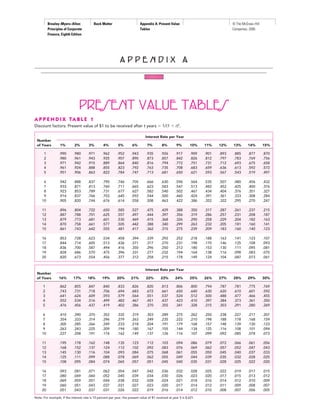
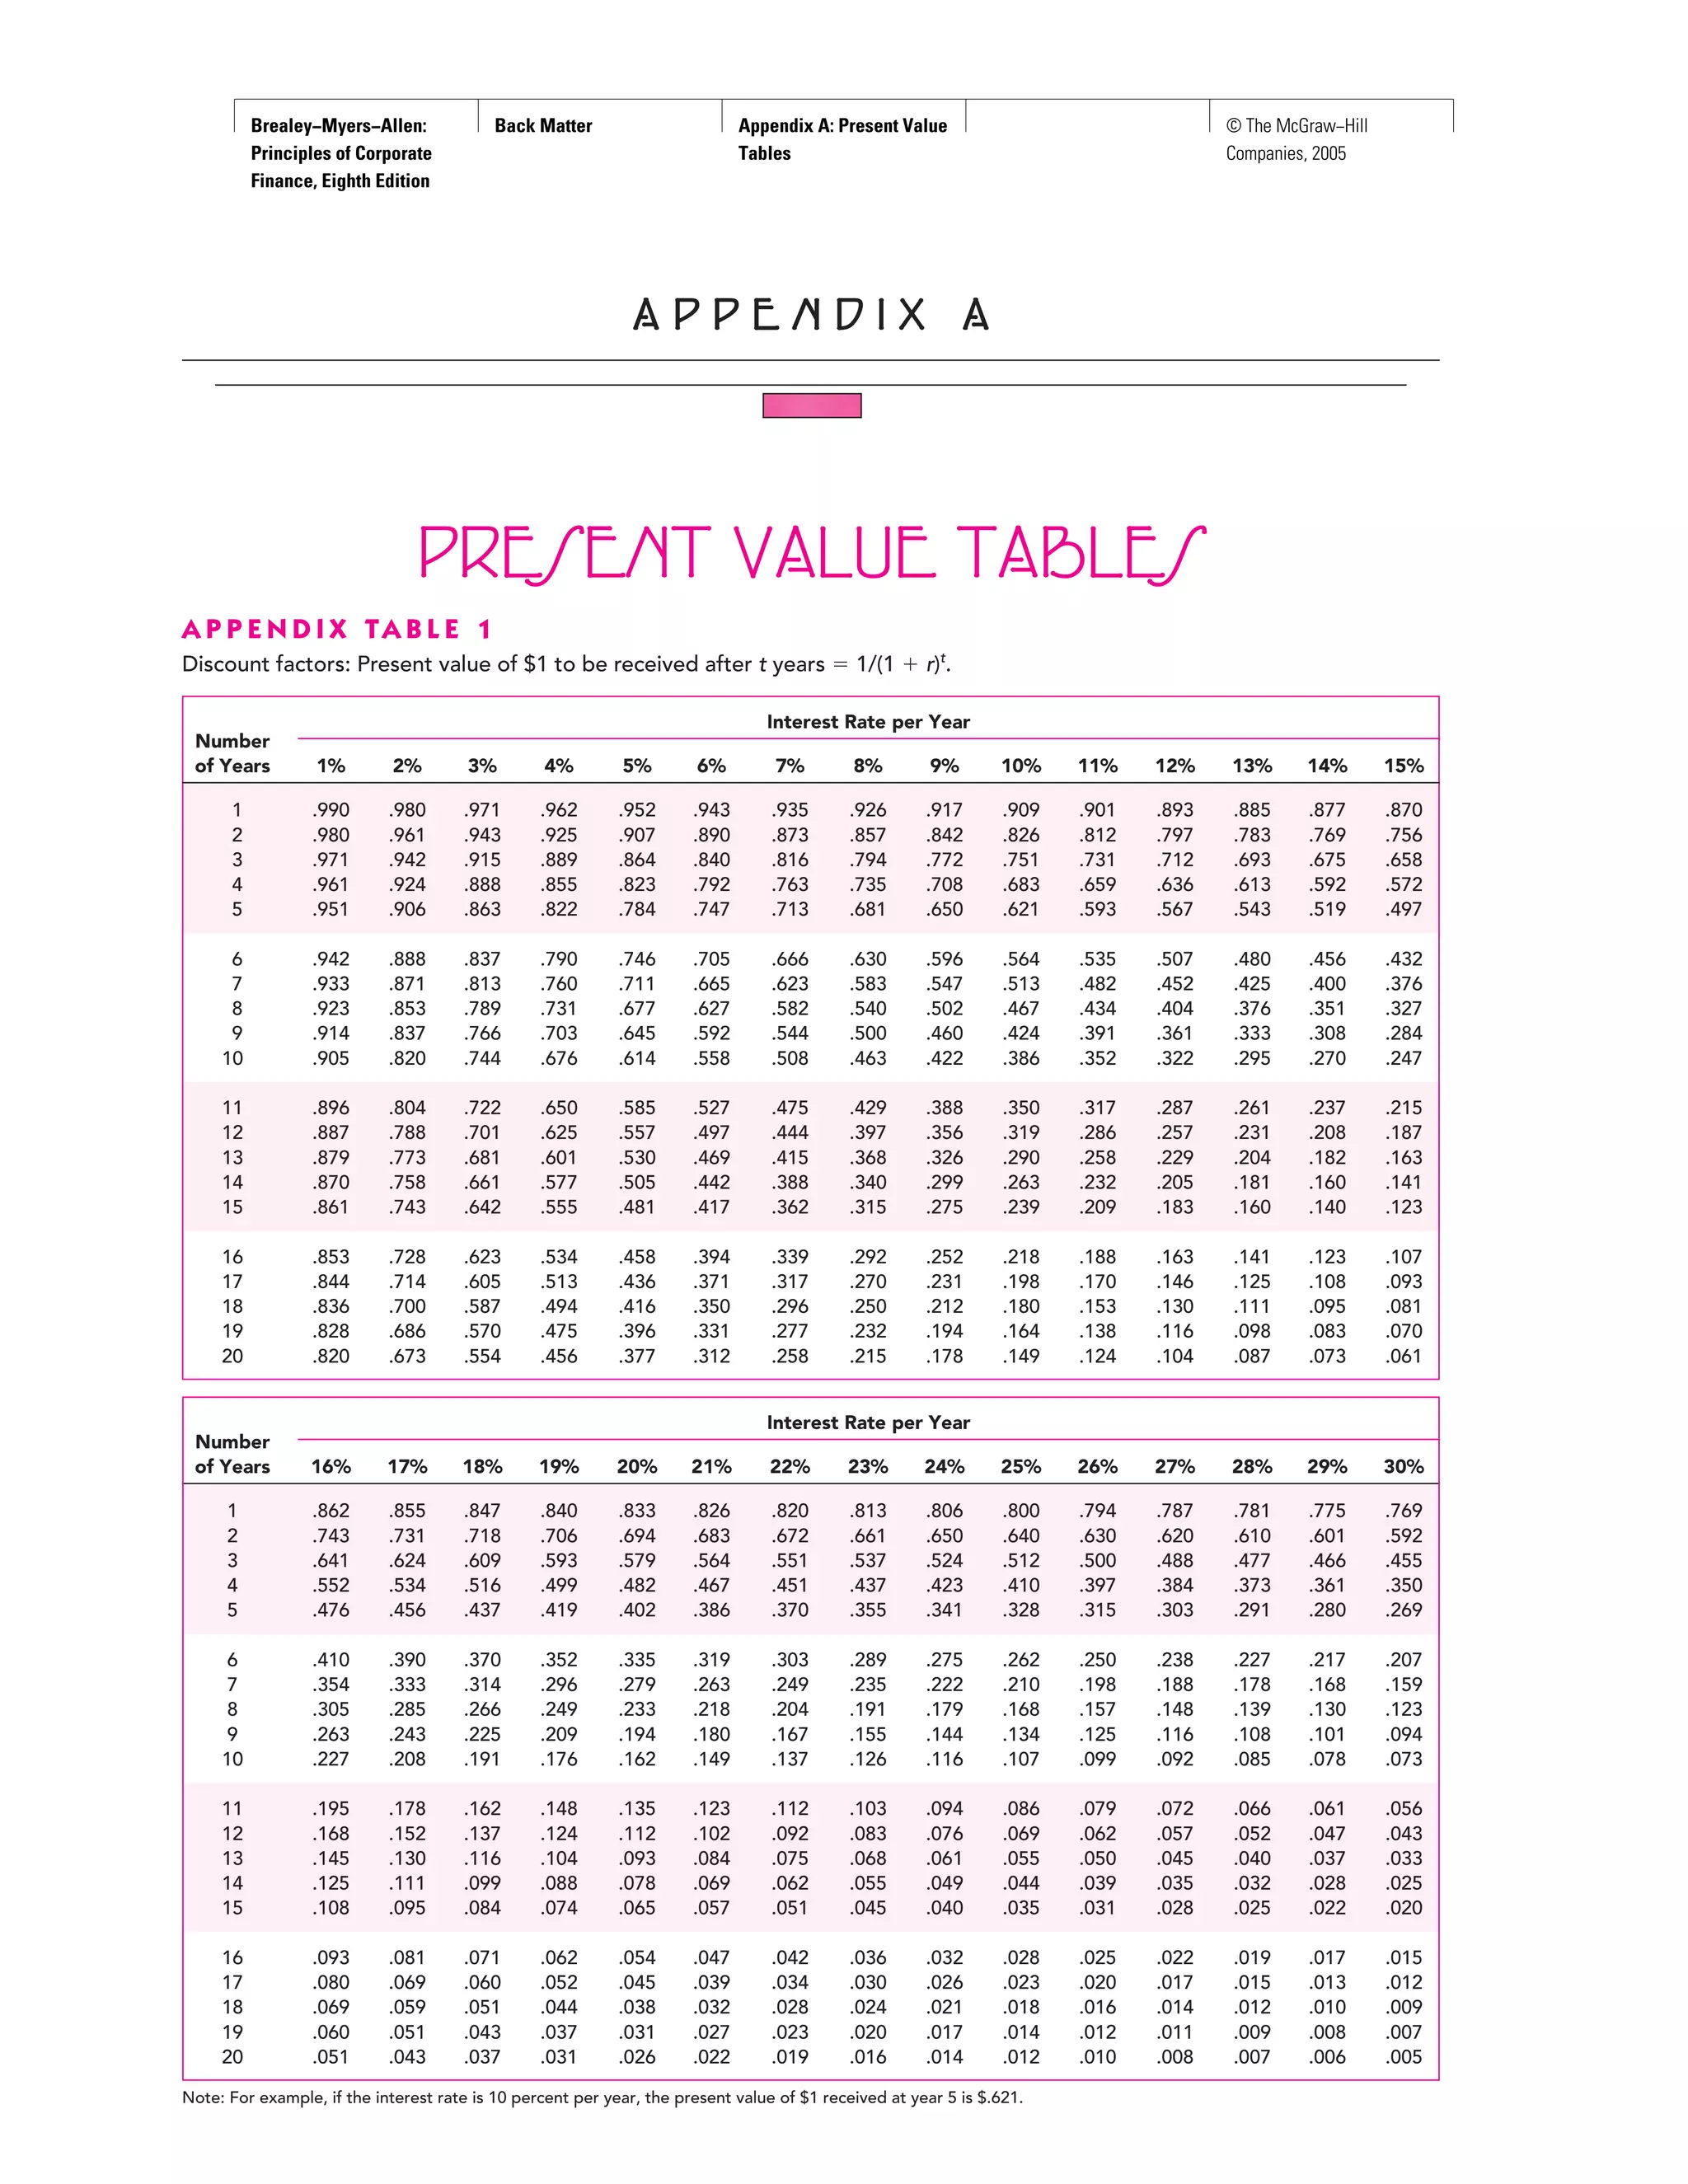
This document contains tables presenting discount factors and future values for interest rates ranging from 1% to 30% per year over time periods from 1 to 30 years. Table 1 shows the present value of $1 received in the future, declining with longer time periods and higher interest rates. Table 2 shows the future value of $1, increasing with longer time periods and higher interest rates. The tables can be used to calculate the present or future value of a cash flow given an interest rate and number of time periods.
![Brealey−Myers−Allen:
Principles of Corporate
Finance, Eighth Edition
Back Matter Appendix A: Present Value
Tables
© The McGraw−Hill
Companies, 2005
970 APPENDIX A Present Value Tables
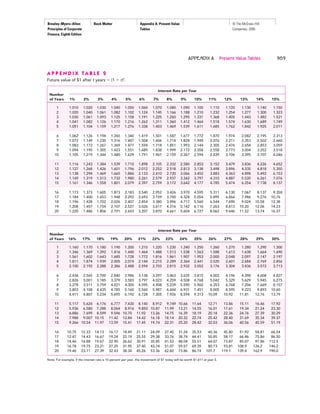
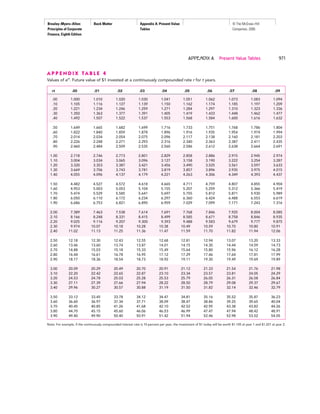
A P P E N D I X TA B L E 3
Annuity table: Present value of $1 per year for each of t years ϭ 1/r Ϫ 1/[r(1 ϩ r)t
].
Number
Interest Rate per Year
of Years 1% 2% 3% 4% 5% 6% 7% 8% 9% 10% 11% 12% 13% 14% 15%
1 .990 .980 .971 .962 .952 .943 .935 .926 .917 .909 .901 .893 .885 .877 .870
2 1.970 1.942 1.913 1.886 1.859 1.833 1.808 1.783 1.759 1.736 1.713 1.690 1.668 1.647 1.626
3 2.941 2.884 2.829 2.775 2.723 2.673 2.624 2.577 2.531 2.487 2.444 2.402 2.361 2.322 2.283
4 3.902 3.808 3.717 3.630 3.546 3.465 3.387 3.312 3.240 3.170 3.102 3.037 2.974 2.914 2.855
5 4.853 4.713 4.580 4.452 4.329 4.212 4.100 3.993 3.890 3.791 3.696 3.605 3.517 3.433 3.352
6 5.795 5.601 5.417 5.242 5.076 4.917 4.767 4.623 4.486 4.355 4.231 4.111 3.998 3.889 3.784
7 6.728 6.472 6.230 6.002 5.786 5.582 5.389 5.206 5.033 4.868 4.712 4.564 4.423 4.288 4.160
8 7.652 7.325 7.020 6.733 6.463 6.210 5.971 5.747 5.535 5.335 5.146 4.968 4.799 4.639 4.487
9 8.566 8.162 7.786 7.435 7.108 6.802 6.515 6.247 5.995 5.759 5.537 5.328 5.132 4.946 4.772
10 9.471 8.983 8.530 8.111 7.722 7.360 7.024 6.710 6.418 6.145 5.889 5.650 5.426 5.216 5.019
11 10.37 9.787 9.253 8.760 8.306 7.887 7.499 7.139 6.805 6.495 6.207 5.938 5.687 5.453 5.234
12 11.26 10.58 9.954 9.385 8.863 8.384 7.943 7.536 7.161 6.814 6.492 6.194 5.918 5.660 5.421
13 12.13 11.35 10.63 9.986 9.394 8.853 8.358 7.904 7.487 7.103 6.750 6.424 6.122 5.842 5.583
14 13.00 12.11 11.30 10.56 9.899 9.295 8.745 8.244 7.786 7.367 6.982 6.628 6.302 6.002 5.724
15 13.87 12.85 11.94 11.12 10.38 9.712 9.108 8.559 8.061 7.606 7.191 6.811 6.462 6.142 5.847
16 14.72 13.58 12.56 11.65 10.84 10.11 9.447 8.851 8.313 7.824 7.379 6.974 6.604 6.265 5.954
17 15.56 14.29 13.17 12.17 11.27 10.48 9.763 9.122 8.544 8.022 7.549 7.120 6.729 6.373 6.047
18 16.40 14.99 13.75 12.66 11.69 10.83 10.06 9.372 8.756 8.201 7.702 7.250 6.840 6.467 6.128
19 17.23 15.68 14.32 13.13 12.09 11.16 10.34 9.604 8.950 8.365 7.839 7.366 6.938 6.550 6.198
20 18.05 16.35 14.88 13.59 12.46 11.47 10.59 9.818 9.129 8.514 7.963 7.469 7.025 6.623 6.259
Number
Interest Rate per Year
of Years 16% 17% 18% 19% 20% 21% 22% 23% 24% 25% 26% 27% 28% 29% 30%
1 .862 .855 .847 .840 .833 .826 .820 .813 .806 .800 .794 .787 .781 .775 .769
2 1.605 1.585 1.566 1.547 1.528 1.509 1.492 1.474 1.457 1.440 1.424 1.407 1.392 1.376 1.361
3 2.246 2.210 2.174 2.140 2.106 2.074 2.042 2.011 1.981 1.952 1.923 1.896 1.868 1.842 1.816
4 2.798 2.743 2.690 2.639 2.589 2.540 2.494 2.448 2.404 2.362 2.320 2.280 2.241 2.203 2.166
5 3.274 3.199 3.127 3.058 2.991 2.926 2.864 2.803 2.745 2.689 2.635 2.583 2.532 2.483 2.436
6 3.685 3.589 3.498 3.410 3.326 3.245 3.167 3.092 3.020 2.951 2.885 2.821 2.759 2.700 2.643
7 4.039 3.922 3.812 3.706 3.605 3.508 3.416 3.327 3.242 3.161 3.083 3.009 2.937 2.868 2.802
8 4.344 4.207 4.078 3.954 3.837 3.726 3.619 3.518 3.421 3.329 3.241 3.156 3.076 2.999 2.925
9 4.607 4.451 4.303 4.163 4.031 3.905 3.786 3.673 3.566 3.463 3.366 3.273 3.184 3.100 3.019
10 4.833 4.659 4.494 4.339 4.192 4.054 3.923 3.799 3.682 3.571 3.465 3.364 3.269 3.178 3.092
11 5.029 4.836 4.656 4.486 4.327 4.177 4.035 3.902 3.776 3.656 3.543 3.437 3.335 3.239 3.147
12 5.197 4.988 4.793 4.611 4.439 4.278 4.127 3.985 3.851 3.725 3.606 3.493 3.387 3.286 3.190
13 5.342 5.118 4.910 4.715 4.533 4.362 4.203 4.053 3.912 3.780 3.656 3.538 3.427 3.322 3.223
14 5.468 5.229 5.008 4.802 4.611 4.432 4.265 4.108 3.962 3.824 3.695 3.573 3.459 3.351 3.249
15 5.575 5.324 5.092 4.876 4.675 4.489 4.315 4.153 4.001 3.859 3.726 3.601 3.483 3.373 3.268
16 5.668 5.405 5.162 4.938 4.730 4.536 4.357 4.189 4.033 3.887 3.751 3.623 3.503 3.390 3.283
17 5.749 5.475 5.222 4.990 4.775 4.576 4.391 4.219 4.059 3.910 3.771 3.640 3.518 3.403 3.295
18 5.818 5.534 5.273 5.033 4.812 4.608 4.419 4.243 4.080 3.928 3.786 3.654 3.529 3.413 3.304
19 5.877 5.584 5.316 5.070 4.843 4.635 4.442 4.263 4.097 3.942 3.799 3.664 3.539 3.421 3.311
20 5.929 5.628 5.353 5.101 4.870 4.657 4.460 4.279 4.110 3.954 3.808 3.673 3.546 3.427 3.316
Note: For example, if the interest rate is 10 percent per year, the investment of $1 received in each of the next 5 years is $3.791.](https://image.slidesharecdn.com/appendixa-presentvaluetables2-150210160714-conversion-gate01/85/Appendix-a-present-value-tables-2-3-320.jpg)
![Brealey−Myers−Allen:
Principles of Corporate
Finance, Eighth Edition
Back Matter Appendix A: Present Value
Tables
© The McGraw−Hill
Companies, 2005
APPENDIX A Present Value Tables 973
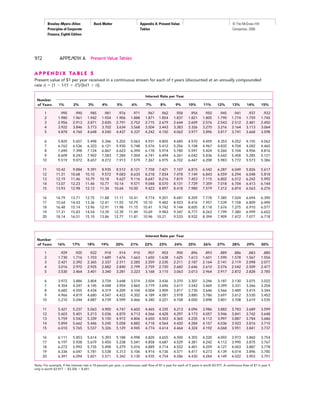
A P P E N D I X TA B L E 6
Cumulative probability [N(d)] that a normally distributed variable will be less than d standard deviations above the mean.
Note: For example, if d ϭ .22, N(d) ϭ .5871 (i.e., there is a .5871 probability that a normally distributed variable will be less than .22 standard deviations above the mean).
d 0 0.01 0.02 0.03 0.04 0.05 0.06 0.07 0.08 0.09
0 .5000 .5040 .5080 .5120 .5160 .5199 .5239 .5279 .5319 .5359
0.1 .5398 .5438 .5478 .5517 .5557 .5596 .5636 .5675 .5714 .5753
0.2 .5793 .5832 .5871 .5910 .5948 .5987 .6026 .6064 .6103 .6141
0.3 .6179 .6217 .6255 .6293 .6331 .6368 .6406 .6443 .6480 .6517
0.4 .6554 .6591 .6628 .6664 .6700 .6736 .6772 .6808 .6844 .6879
0.5 .6915 .6950 .6985 .7019 .7054 .7088 .7123 .7157 .7190 .7224
0.6 .7257 .7291 .7324 .7357 .7389 .7422 .7454 .7486 .7517 .7549
0.7 .7580 .7611 .7642 .7673 .7704 .7734 .7764 .7794 .7823 .7852
0.8 .7881 .7910 .7939 .7967 .7995 .8023 .8051 .8078 .8106 .8133
0.9 .8159 .8186 .8212 .8238 .8264 .8289 .8315 .8340 .8365 .8389
1 .8413 .8438 .8461 .8485 .8508 .8531 .8554 .8577 .8599 .8621
1.1 .8643 .8665 .8686 .8708 .8729 .8749 .8770 .8790 .8810 .8830
1.2 .8849 .8869 .8888 .8907 .8925 .8944 .8962 .8980 .8997 .9015
1.3 .9032 .9049 .9066 .9082 .9099 .9115 .9131 .9147 .9162 .9177
1.4 .9192 .9207 .9222 .9236 .9251 .9265 .9279 .9292 .9306 .9319
1.5 .9332 .9345 .9357 .9370 .9382 .9394 .9406 .9418 .9429 .9441
1.6 .9452 .9463 .9474 .9484 .9495 .9505 .9515 .9525 .9535 .9545
1.7 .9554 .9564 .9573 .9582 .9591 .9599 .9608 .9616 .9625 .9633
1.8 .9641 .9649 .9656 .9664 .9671 .9678 .9686 .9693 .9699 .9706
1.9 .9713 .9719 .9726 .9732 .9738 .9744 .9750 .9756 .9761 .9767
2 .9772 .9778 .9783 .9788 .9793 .9798 .9803 .9808 .9812 .9817
2.1 .9821 .9826 .9830 .9834 .9838 .9842 .9846 .9850 .9854 .9857
2.2 .9861 .9864 .9868 .9871 .9875 .9878 .9881 .9884 .9887 .9890
2.3 .9893 .9896 .9898 .9901 .9904 .9906 .9909 .9911 .9913 .9916
2.4 .9918 .9920 .9922 .9925 .9927 .9929 .9931 .9932 .9934 .9936
2.5 .9938 .9940 .9941 .9943 .9945 .9946 .9948 .9949 .9951 .9952](https://image.slidesharecdn.com/appendixa-presentvaluetables2-150210160714-conversion-gate01/85/Appendix-a-present-value-tables-2-6-320.jpg)