Download to read offline


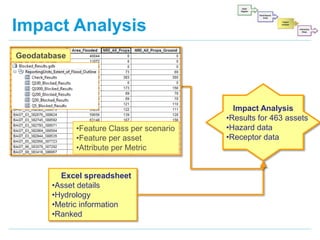


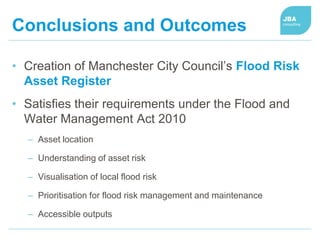

The document discusses the development of interactive maps for managing flood risk assets in Manchester, as mandated by the Flood and Water Management Act 2010. It outlines the creation of a flood risk asset register that includes detailed assessments of 463 assets, their conditions, and impacts on surrounding properties and infrastructure. GIS techniques have been employed to visualize flood risk, enabling the Manchester City Council to prioritize maintenance and management effectively.


