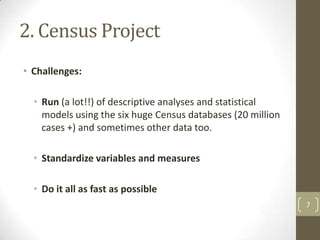
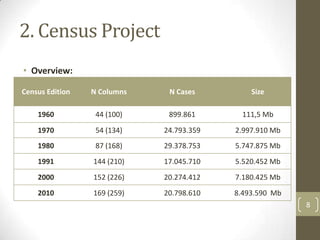
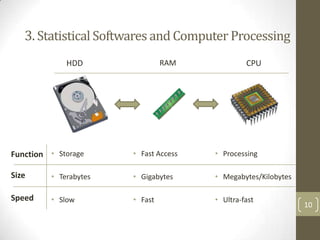
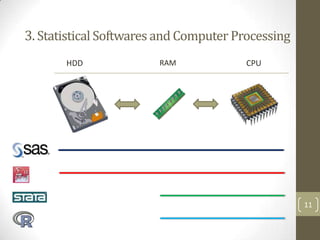
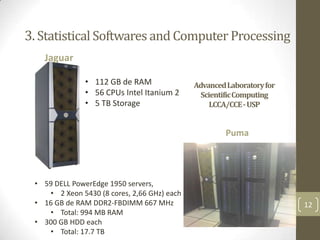
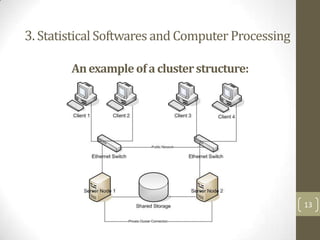
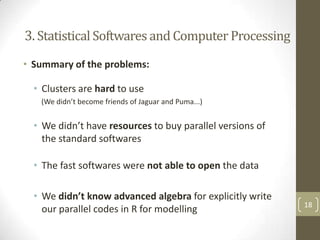
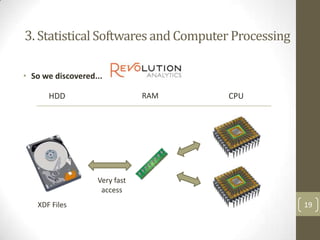
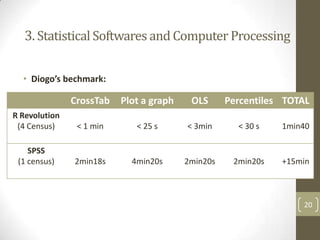
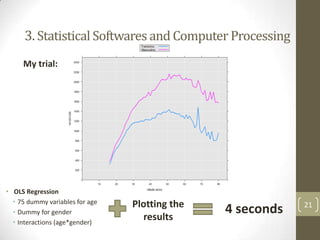
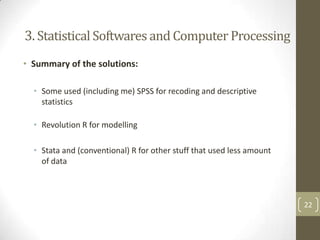
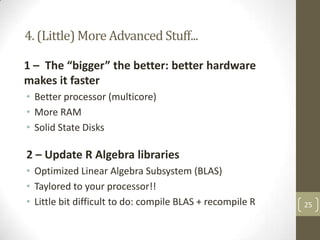
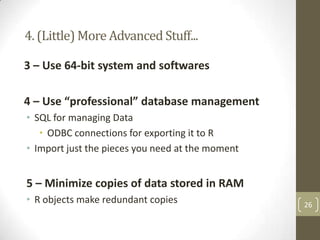
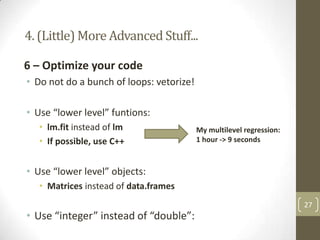
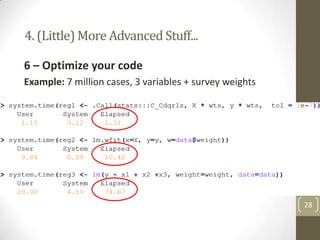
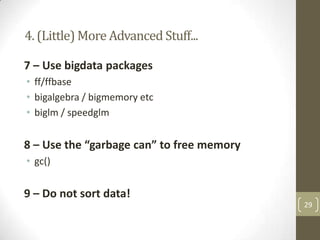
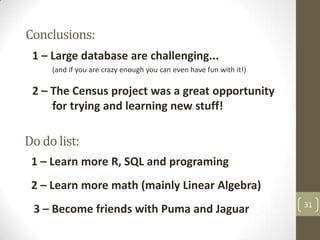
Analyzing the census:
Large databases and statistical software challenges
Rogério Jerônimo Barbosa
PhD Candidate, Sociology – USP
Researcher at the Center for Metropolitan Studies (CEM)
1
Presentation Structure
1. Objetives of this presentation
2. The Census Project
3. Statistical Softwares and Computer Processing

4. (Little) More Advanced Stuff...
5. Conclusions and a “to do list”

2
1. Objetives
• Share my personal experience with the Census
Databases.
• Give some hints on how to analyse big databases
• Show how R can be a good
environment/companion for “big data” analysis
3
2. The Census Project…
4
2. Census Project
• December 2011:
• Invited by Marta to become part of the project

• Jan/Apr 2012:
• Getting familiar with IBGE documentation and Census Databases
• We bought all PNADs and Census Data (Except for 1960 edition)

• May 2012:
• The team started working

• April 2013:
• End of (team) activities

5
2. Census Project
The team:

Rogério J Barbosa
PhD Candidate – Sociology/USP

Diogo Ferrari
PhD Candidate – Political Science/Michigan University

Ian Prates
PhD Candidate – Sociology/USP

Leonardo Barone
PhD Candidate – Public Administration/FGV-SP

Murillo Marschner Alves de Brito
PhD Candidate – Sociology/USP

Patrick Silva
Graduate Student (Master)– Political Science/USP

6
2. Census Project
• Challenges:
• Run (a lot!!) of descriptive analyses and statistical
models using the six huge Census databases (20 million
cases +) and sometimes other data too.
• Standardize variables and measures
• Do it all as fast as possible
7
2. Census Project
• Overview:
Census Edition

N Columns

N Cases

Size

1960

44 (100)

899.861

111,5 Mb

1970

54 (134)

24.793.359

2.997.910 Mb

1980

87 (168)

29.378.753

5.747.875 Mb

1991

144 (210)

17.045.710

5.520.452 Mb

2000

152 (226)

20.274.412

7.180.425 Mb

2010

169 (259)

20.798.610

8.493.590 Mb
8
3. Statistical Softwares and
Computer Processing...
9
3. Statistical Softwares and Computer Processing
HDD

RAM

Function • Storage

• Fast Access

• Processing

Size

• Terabytes

• Gigabytes

• Megabytes/Kilobytes

Speed

• Slow

• Fast

• Ultra-fast

CPU

10
3. Statistical Softwares and Computer Processing
HDD

RAM

CPU

11
3. Statistical Softwares and Computer Processing
Jaguar
• 112 GB de RAM
• 56 CPUs Intel Itanium 2
• 5 TB Storage

AdvancedLaboratoryfor
ScientificComputing
LCCA/CCE - USP

Puma

• 59 DELL PowerEdge 1950 servers,
• 2 Xeon 5430 (8 cores, 2,66 GHz) each
• 16 GB de RAM DDR2-FBDIMM 667 MHz
• Total: 994 MB RAM
• 300 GB HDD each
• Total: 17.7 TB

12
3. Statistical Softwares and Computer Processing
An example of a cluster structure:

13
3. Statistical Softwares and Computer Processing
• There is no such thing as a “Super Computer”

• Clusters do not have a “user friendly” interface: you
have to use command line (Linux Terminal)
•
•
•
•

You write command lines for statistical analysis and upload it
Then you write a “job” and submit it to the cluster queue
Wait for your turn...
Download a file with the results

• Clusters require parallel processing – otherwise, you are
not using their real power.
• Common Statistical softwares don’t do that!

14
3. Statistical Softwares and Computer Processing
• Parallel Computing
• “Who” to divide your processing tasks with?
• Between Computers (clusters)
• Between “cores” of the same computer (this is feasible using
personal computers!)

• How to do that?
• Implicitly: specialized statistical softwares (expensive)
• Explicitly: you write your parallel codes yourself! (hard)
15
3. Statistical Softwares and Computer Processing
• Parallel Computing: not everything is (easily) parallelizable

Minimizing the squared residuals...

Specialized softwares use (very complicated ) approximations...

16
3. Statistical Softwares and Computer Processing
• Parallel Computing: not everything is (easily) parallelizable

Iterative methods for getting maximum likelihood estimators...

(Fisher Scoring Algorithm:
the actual step depends on the results of the previous one)
17

Specialized softwares use (very complicated ) approximations...
3. Statistical Softwares and Computer Processing
• Summary of the problems:

• Clusters are hard to use
(We didn’t become friends of Jaguar and Puma...)

• We didn’t have resources to buy parallel versions of
the standard softwares
• The fast softwares were not able to open the data

• We didn’t know advanced algebra for explicitly write
our parallel codes in R for modelling

18
3. Statistical Softwares and Computer Processing
• So we discovered...
RAM

HDD

CPU

Very fast
access
XDF Files

19
3. Statistical Softwares and Computer Processing
• Diogo’s bechmark:

CrossTab

Plot a graph

OLS

Percentiles TOTAL

R Revolution
(4 Census)

< 1 min

< 25 s

< 3min

< 30 s

1min40

SPSS
(1 census)

2min18s

4min20s

2min20s

2min20s

+15min

20
3. Statistical Softwares and Computer Processing
My trial:

• OLS Regression
• 75 dummy variables for age
• Dummy for gender
• Interactions (age*gender)

Plotting the
results

4 seconds

21
3. Statistical Softwares and Computer Processing
• Summary of the solutions:
• Some used (including me) SPSS for recoding and descriptive
statistics
• Revolution R for modelling
• Stata and (conventional) R for other stuff that used less amount
of data

22
4. (Little) More Advanced Stuff…
23
(Little) More Advanced Stuff...

• My Purpose: use R* for every analysis
* Or similars, like Python, Julia etc...

• How to do that (once conventional R is
limited)?
24
4. (Little) More Advanced Stuff...
1 – The “bigger” the better: better hardware
makes it faster
• Better processor (multicore)
• More RAM
• Solid State Disks

2 – Update R Algebra libraries
• Optimized Linear Algebra Subsystem (BLAS)
• Taylored to your processor!!
• Little bit difficult to do: compile BLAS + recompile R

25
4. (Little) More Advanced Stuff...
3 – Use 64-bit system and softwares
4 – Use “professional” database management
• SQL for managing Data
• ODBC connections for exporting it to R
• Import just the pieces you need at the moment

5 – Minimize copies of data stored in RAM
• R objects make redundant copies

26
4. (Little) More Advanced Stuff...
6 – Optimize your code
• Do not do a bunch of loops: vetorize!
• Use “lower level” funtions:
• lm.fit instead of lm
• If possible, use C++

My multilevel regression:
1 hour -> 9 seconds

• Use “lower level” objects:
• Matrices instead of data.frames

• Use “integer” instead of “double”:

27
4. (Little) More Advanced Stuff...
6 – Optimize your code
Example: 7 million cases, 3 variables + survey weights

28
4. (Little) More Advanced Stuff...
7 – Use bigdata packages
• ff/ffbase
• bigalgebra / bigmemory etc
• biglm / speedglm

8 – Use the “garbage can” to free memory
• gc()

9 – Do not sort data!
29
5. Summing up and a
“to do list”
30
Conclusions:
1 – Large database are challenging...
(and if you are crazy enough you can even have fun with it!)

2 – The Census project was a great opportunity
for trying and learning new stuff!

Do do list:
1 – Learn more R, SQL and programing
2 – Learn more math (mainly Linear Algebra)
3 – Become friends with Puma and Jaguar

31
Thanks!
Visit:
CEM Website:
http://www.fflch.usp.br/centrodametropole/
Sociais & Métodos (Our Blog):
http://sociaisemetodos.wordpress.com/

32

Analyzing Census Data: Large databases and challenges to statistical softwares

  • 1.
    Analyzing the census: Largedatabases and statistical software challenges Rogério Jerônimo Barbosa PhD Candidate, Sociology – USP Researcher at the Center for Metropolitan Studies (CEM) 1
  • 2.
    Presentation Structure 1. Objetivesof this presentation 2. The Census Project 3. Statistical Softwares and Computer Processing 4. (Little) More Advanced Stuff... 5. Conclusions and a “to do list” 2
  • 3.
    1. Objetives • Sharemy personal experience with the Census Databases. • Give some hints on how to analyse big databases • Show how R can be a good environment/companion for “big data” analysis 3
  • 4.
    2. The CensusProject… 4
  • 5.
    2. Census Project •December 2011: • Invited by Marta to become part of the project • Jan/Apr 2012: • Getting familiar with IBGE documentation and Census Databases • We bought all PNADs and Census Data (Except for 1960 edition) • May 2012: • The team started working • April 2013: • End of (team) activities 5
  • 6.
    2. Census Project Theteam: Rogério J Barbosa PhD Candidate – Sociology/USP Diogo Ferrari PhD Candidate – Political Science/Michigan University Ian Prates PhD Candidate – Sociology/USP Leonardo Barone PhD Candidate – Public Administration/FGV-SP Murillo Marschner Alves de Brito PhD Candidate – Sociology/USP Patrick Silva Graduate Student (Master)– Political Science/USP 6
  • 7.
    2. Census Project •Challenges: • Run (a lot!!) of descriptive analyses and statistical models using the six huge Census databases (20 million cases +) and sometimes other data too. • Standardize variables and measures • Do it all as fast as possible 7
  • 8.
    2. Census Project •Overview: Census Edition N Columns N Cases Size 1960 44 (100) 899.861 111,5 Mb 1970 54 (134) 24.793.359 2.997.910 Mb 1980 87 (168) 29.378.753 5.747.875 Mb 1991 144 (210) 17.045.710 5.520.452 Mb 2000 152 (226) 20.274.412 7.180.425 Mb 2010 169 (259) 20.798.610 8.493.590 Mb 8
  • 9.
    3. Statistical Softwaresand Computer Processing... 9
  • 10.
    3. Statistical Softwaresand Computer Processing HDD RAM Function • Storage • Fast Access • Processing Size • Terabytes • Gigabytes • Megabytes/Kilobytes Speed • Slow • Fast • Ultra-fast CPU 10
  • 11.
    3. Statistical Softwaresand Computer Processing HDD RAM CPU 11
  • 12.
    3. Statistical Softwaresand Computer Processing Jaguar • 112 GB de RAM • 56 CPUs Intel Itanium 2 • 5 TB Storage AdvancedLaboratoryfor ScientificComputing LCCA/CCE - USP Puma • 59 DELL PowerEdge 1950 servers, • 2 Xeon 5430 (8 cores, 2,66 GHz) each • 16 GB de RAM DDR2-FBDIMM 667 MHz • Total: 994 MB RAM • 300 GB HDD each • Total: 17.7 TB 12
  • 13.
    3. Statistical Softwaresand Computer Processing An example of a cluster structure: 13
  • 14.
    3. Statistical Softwaresand Computer Processing • There is no such thing as a “Super Computer” • Clusters do not have a “user friendly” interface: you have to use command line (Linux Terminal) • • • • You write command lines for statistical analysis and upload it Then you write a “job” and submit it to the cluster queue Wait for your turn... Download a file with the results • Clusters require parallel processing – otherwise, you are not using their real power. • Common Statistical softwares don’t do that! 14
  • 15.
    3. Statistical Softwaresand Computer Processing • Parallel Computing • “Who” to divide your processing tasks with? • Between Computers (clusters) • Between “cores” of the same computer (this is feasible using personal computers!) • How to do that? • Implicitly: specialized statistical softwares (expensive) • Explicitly: you write your parallel codes yourself! (hard) 15
  • 16.
    3. Statistical Softwaresand Computer Processing • Parallel Computing: not everything is (easily) parallelizable Minimizing the squared residuals... Specialized softwares use (very complicated ) approximations... 16
  • 17.
    3. Statistical Softwaresand Computer Processing • Parallel Computing: not everything is (easily) parallelizable Iterative methods for getting maximum likelihood estimators... (Fisher Scoring Algorithm: the actual step depends on the results of the previous one) 17 Specialized softwares use (very complicated ) approximations...
  • 18.
    3. Statistical Softwaresand Computer Processing • Summary of the problems: • Clusters are hard to use (We didn’t become friends of Jaguar and Puma...) • We didn’t have resources to buy parallel versions of the standard softwares • The fast softwares were not able to open the data • We didn’t know advanced algebra for explicitly write our parallel codes in R for modelling 18
  • 19.
    3. Statistical Softwaresand Computer Processing • So we discovered... RAM HDD CPU Very fast access XDF Files 19
  • 20.
    3. Statistical Softwaresand Computer Processing • Diogo’s bechmark: CrossTab Plot a graph OLS Percentiles TOTAL R Revolution (4 Census) < 1 min < 25 s < 3min < 30 s 1min40 SPSS (1 census) 2min18s 4min20s 2min20s 2min20s +15min 20
  • 21.
    3. Statistical Softwaresand Computer Processing My trial: • OLS Regression • 75 dummy variables for age • Dummy for gender • Interactions (age*gender) Plotting the results 4 seconds 21
  • 22.
    3. Statistical Softwaresand Computer Processing • Summary of the solutions: • Some used (including me) SPSS for recoding and descriptive statistics • Revolution R for modelling • Stata and (conventional) R for other stuff that used less amount of data 22
  • 23.
    4. (Little) MoreAdvanced Stuff… 23
  • 24.
    (Little) More AdvancedStuff... • My Purpose: use R* for every analysis * Or similars, like Python, Julia etc... • How to do that (once conventional R is limited)? 24
  • 25.
    4. (Little) MoreAdvanced Stuff... 1 – The “bigger” the better: better hardware makes it faster • Better processor (multicore) • More RAM • Solid State Disks 2 – Update R Algebra libraries • Optimized Linear Algebra Subsystem (BLAS) • Taylored to your processor!! • Little bit difficult to do: compile BLAS + recompile R 25
  • 26.
    4. (Little) MoreAdvanced Stuff... 3 – Use 64-bit system and softwares 4 – Use “professional” database management • SQL for managing Data • ODBC connections for exporting it to R • Import just the pieces you need at the moment 5 – Minimize copies of data stored in RAM • R objects make redundant copies 26
  • 27.
    4. (Little) MoreAdvanced Stuff... 6 – Optimize your code • Do not do a bunch of loops: vetorize! • Use “lower level” funtions: • lm.fit instead of lm • If possible, use C++ My multilevel regression: 1 hour -> 9 seconds • Use “lower level” objects: • Matrices instead of data.frames • Use “integer” instead of “double”: 27
  • 28.
    4. (Little) MoreAdvanced Stuff... 6 – Optimize your code Example: 7 million cases, 3 variables + survey weights 28
  • 29.
    4. (Little) MoreAdvanced Stuff... 7 – Use bigdata packages • ff/ffbase • bigalgebra / bigmemory etc • biglm / speedglm 8 – Use the “garbage can” to free memory • gc() 9 – Do not sort data! 29
  • 30.
    5. Summing upand a “to do list” 30
  • 31.
    Conclusions: 1 – Largedatabase are challenging... (and if you are crazy enough you can even have fun with it!) 2 – The Census project was a great opportunity for trying and learning new stuff! Do do list: 1 – Learn more R, SQL and programing 2 – Learn more math (mainly Linear Algebra) 3 – Become friends with Puma and Jaguar 31
  • 32.
    Thanks! Visit: CEM Website: http://www.fflch.usp.br/centrodametropole/ Sociais &Métodos (Our Blog): http://sociaisemetodos.wordpress.com/ 32