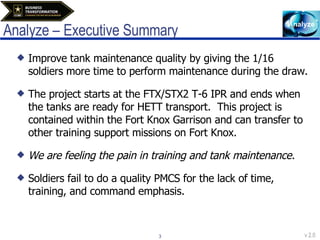
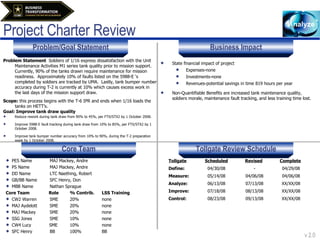
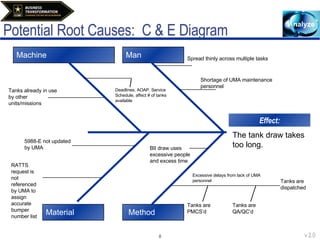
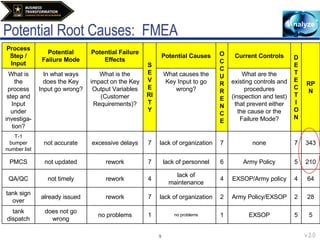
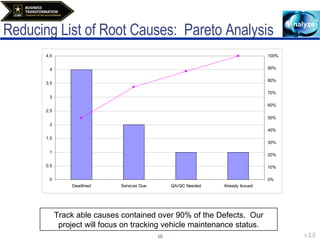
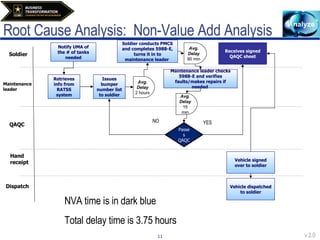
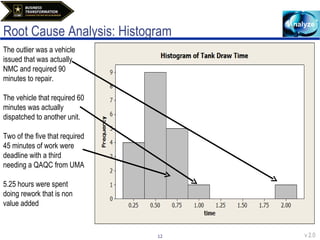
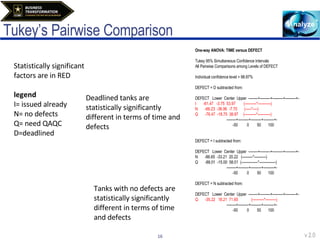
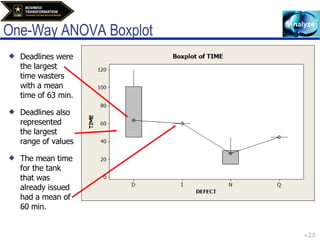
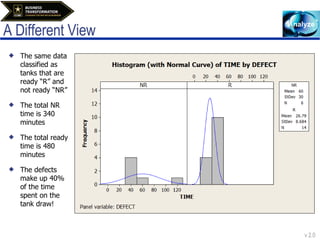
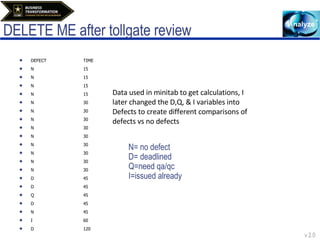
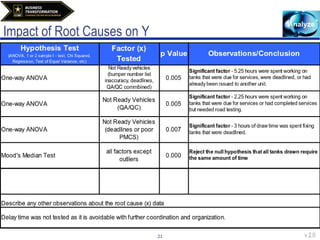
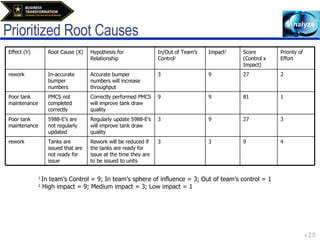
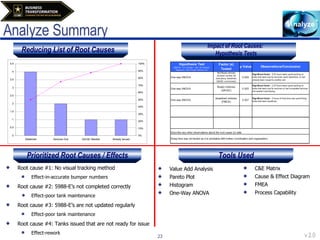
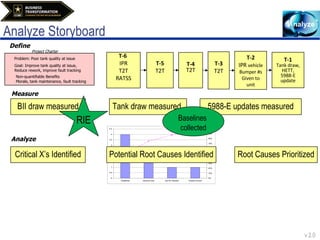
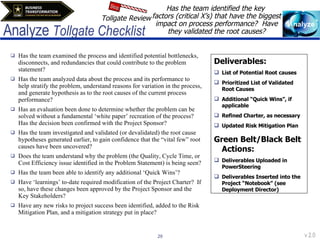
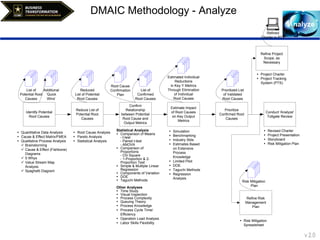
SlideShare a Scribd company logo
1 of 30
Lean Six Sigma Improving FTX/STX2 Tank Draw Quality SFC Henry, Don H. II Project Initiation Date: 31/03/08 Analyze Tollgate Date: 03/07/08
Agenda ,[object Object],[object Object],[object Object],[object Object],[object Object],[object Object],[object Object],[object Object],[object Object],[object Object],[object Object],[object Object]
Analyze – Executive Summary ,[object Object],[object Object],[object Object],[object Object]
Project Charter Review ,[object Object],[object Object],Problem/Goal Statement Tollgate Review Schedule Business Impact Core Team ,[object Object],[object Object],[object Object],[object Object],[object Object],[object Object],[object Object],[object Object],[object Object],[object Object],[object Object],[object Object],[object Object],[object Object],[object Object],[object Object],[object Object],Tollgate Scheduled Revised   Complete Define: 04/30/08 -  04/29/08 Measure: 05/14/08 04/06/08   04/06/08 Analyze: 06/13/08 07/13/08  XX/XX/08 Improve:   07/18/08 08/13/08  XX/XX/08 Control: 08/23/08 09/13/08  XX/XX/08 ,[object Object],[object Object],[object Object],Problem Statement  Soldiers of 1/16 express dissatisfaction with the Unit Maintenance Activities M1 series tank quality prior to mission support. Currently, 90% of the tanks drawn require maintenance for mission readiness.  Approximately 10% of faults listed on the 5988-E ‘s completed by soldiers are tracked by UMA.  Lastly, tank bumper number accuracy during T-2 is currently at 10% which causes excess work in the last days of the mission support draw.
Baseline Data ,[object Object],[object Object],[object Object],[object Object],The average Tank Draw Time is 34 minutes +/- 24 minutes.
Baseline Data Cont. ,[object Object],[object Object],[object Object],These numbers take into account vehicles presented to draw but never actually drawn or PMCSed. These numbers represent what was actually given, PMCS’ed, and drawn.
Critical X’s:  Cause  and Effect  Matrix Cause and Effect Matrix Key Process Output Variables Customer Importance 10 9 2 6 8                     Customer Rank 1 2 3 4 5                     1 2 3 4 5 6 7 8 9 10 11 12 13 14 15 Process Step KPIV accurate tank list 5988-E QA/QC DA Form 2062 Dispatch                     Rank Rating Total Process Steps &  Key Process Input Variables 1 T-1 RATSS 1 9 9 9 1                     2 7.533 171 2 PMCS Technical Manual 9 1 1 9 9                     1 10 227 3 QA/QC UMA inspector 9 1 1 3 3                     3 6.3 143 4 tank sign over DA 2062 9 1 1 1 3                     4 5.771 131 5 tank dispatch 5987-E 9 1 1 1 1                     5 5.066 115 ###                                     #####  
Potential Root Causes:  C & E Diagram Effect: The tank draw takes too long. Man Machine Material Method Spread thinly across multiple tasks Shortage of UMA maintenance personnel Deadlines, AOAP, Service Schedule, affect # of tanks available Tanks already in use by other units/missions BII draw uses excessive people and excess time RATTS request is not referenced by UMA to assign accurate bumper number list Tanks are PMCS’d Tanks are QA/QC’d Tanks are dispatched Excessive delays from lack of UMA personnel 5988-E not updated by UMA
Potential Root Causes:  FMEA Process Step / Input Potential Failure Mode Potential Failure Effects SEVERITY Potential Causes OCCURRENCE Current Controls DETECTION RPN   What is the process step and Input under investiga-tion? In what ways does the Key Input go wrong? What is the impact on the Key Output Variables (Customer Requirements)? What causes the Key Input to go wrong? What are the existing controls and procedures (inspection and test) that prevent either the cause or the Failure Mode? T-1 bumper number list not accurate excessive delays 7 lack of organization 7 none 7 343 PMCS not updated rework 7 lack of personnel 6 Army Policy 5 210 QA/QC not timely rework 4 lack of maintenance 4 EXSOP/Army policy 4 64 tank sign over already issued rework 7 lack of organization 2 Army Policy/EXSOP 2 28 tank dispatch does not go wrong no problems 1 no problems 1 EXSOP 5 5
Reducing List of Root Causes:  Pareto Analysis Track able causes contained over 90% of the Defects.  Our project will focus on tracking vehicle maintenance status.
Root Cause Analysis:  Non-Value Add Analysis QAQC Maintenance leader Dispatch Soldier Issues bumper number list to soldier Maintenance leader checks 5988-E and verifies faults/makes repairs if needed  Hand receipt Vehicle signed over to soldier Avg. Delay 2 hours Avg.Delay 15 min Avg. Delay 90 min Soldier conducts PMCS and completes 5988-E, turns it in to maintenance leader  Passes QAQC Receives signed QAQC sheet Vehicle dispatched to soldier YES NO NVA time is in dark blue Total delay time is 3.75 hours Retrieves info from RATSS system Notify UMA of the # of tanks needed
Root Cause Analysis: Histogram The outlier was a vehicle issued that was actually NMC and required 90 minutes to repair. The vehicle that required 60 minutes was actually dispatched to another unit. Two of the five that required 45 minutes of work were deadline with a third needing a QAQC from UMA 5.25 hours were spent doing rework that is non value added
One-Way ANOVA of Time and Defects ,[object Object],[object Object]
One-Way ANOVA of Time and Defects Data ,[object Object],[object Object],[object Object],[object Object],[object Object],[object Object],[object Object],[object Object],[object Object],[object Object],[object Object],[object Object],[object Object],[object Object],The R-squared value of 48.59% is statistically significant meaning the model predicts nearly half of the variation causing increased tank draw times as being caused by defects. Therefore we reject the null hypothesis.
Mood’s Median Test ,[object Object],[object Object],Mood Median Test: TIME versus DEFECT  Mood median test for TIME Chi-Square = 13.37  DF = 1  P = 0.000 Individual 95.0% CIs DEFECT  N<=  N>  Median  Q3-Q1  -----+---------+---------+---------+- D  0  4  45  56  *------------------------) I  0  1  60  Not Used N  13  1  30  15  (----* Q  0  1  45  Not Used  -----+---------+---------+---------+- 30  60  90  120 Overall median = 30 * NOTE * Levels with < 6 observations have confidence < 95.0%
Tukey’s Pairwise Comparison One-way ANOVA: TIME versus DEFECT  Tukey 95% Simultaneous Confidence Intervals All Pairwise Comparisons among Levels of DEFECT Individual confidence level = 98.87% DEFECT = D subtracted from: DEFECT  Lower  Center  Upper  --------+---------+---------+---------+- I  -61.47  -3.75  53.97  (----------*-----------) N  -66.23  -36.96  -7.70  (-----*----) Q  -76.47  -18.75  38.97  (----------*-----------) --------+---------+---------+---------+- -50  0  50  100 DEFECT = I subtracted from: DEFECT  Lower  Center  Upper  --------+---------+---------+---------+- N  -86.65  -33.21  20.22  (---------*----------) Q  -88.01  -15.00  58.01  (--------------*--------------) --------+---------+---------+---------+- -50  0  50  100 DEFECT = N subtracted from: DEFECT  Lower  Center  Upper  --------+---------+---------+---------+- Q  -35.22  18.21  71.65  (----------*---------) --------+---------+---------+---------+- -50  0  50  100 Statistically significant factors are in RED legend I= issued already N= no defects Q= need QAQC D=deadlined Deadlined tanks are statistically significantly different in terms of time and defects Tanks with no defects are statistically significantly different in terms of time and defects
Current Process Capability ,[object Object],[object Object],[object Object],[object Object]
One-Way ANOVA Boxplot ,[object Object],[object Object],[object Object]
A Different View ,[object Object],[object Object],[object Object],[object Object]
DELETE ME after tollgate review N= no defect  D= deadlined Q=need qa/qc I=issued already ,[object Object],[object Object],[object Object],[object Object],[object Object],[object Object],[object Object],[object Object],[object Object],[object Object],[object Object],[object Object],[object Object],[object Object],[object Object],[object Object],[object Object],[object Object],[object Object],[object Object],[object Object],Data used in minitab to get calculations, I later changed the D,Q, & I variables into Defects to create different comparisons of defects vs no defects
Impact of Root Causes on Y
Prioritized Root Causes 1  In team’s Control = 9; In team’s sphere of influence = 3; Out of team’s control = 1 2  High impact = 9; Medium impact = 3; Low impact = 1 Effect (Y) Root Cause (X) Hypothesis for Relationship In/Out of Team’s Control 1 Impact 2 Score (Control x Impact) Priority of Effort rework In-accurate bumper numbers Accurate bumper numbers will increase throughput 3 9 27 2 Poor tank maintenance PMCS not completed correctly Correctly performed PMCS will improve tank draw quality 9 9 81 1 Poor tank maintenance  5988-E’s are not regularly updated Regularly update 5988-E’s will improve tank draw quality 3 9 27 3 rework Tanks are issued that are not ready for issue Rework will be reduced if the tanks are ready for issue at the time they are to be issued to units 3 3 9 4
Analyze Summary Impact of Root Causes:  Hypothesis Tests Tools Used Reducing List of Root Causes Prioritized Root Causes / Effects ,[object Object],[object Object],[object Object],[object Object],[object Object],[object Object],[object Object],[object Object],[object Object],[object Object],[object Object],[object Object],[object Object],[object Object],[object Object],[object Object]
Lessons Learned ,[object Object],[object Object],[object Object],[object Object],[object Object]
Barriers/Issues/Project Action Log ,[object Object],[object Object],[object Object],[object Object],[object Object],Lean Six Sigma Project Action Log         Last Revised: 10/15/2007   No Description/ Recommendation Status  Open/Closed/Hold Due Date Revised Due Date Resp. Comments / Resolution 1 Leave of critical team member     14 May   4 May     2           3           4           5          
Next Steps ,[object Object],[object Object],[object Object]
Analyze Storyboard Define Project Charter T-6  IPR T2T RATSS T-5 T2T T-4 T2T T-3 T2T T-2 IPR  vehicle Bumper #s Given to unit T-1 Tank draw, HETT, 5988-E update Measure BII draw measured Tank draw measured 5988-E updates measured RIE Baselines  collected Critical X’s Identified Potential Root Causes Identified Root Causes Prioritized Analyze Problem: Poor tank quality at issue Goal: Improve tank quality at issue,  Reduce rework, improve fault tracking Non-quantifiable Benefits Morale, tank maintenance, fault tracking
Sign Off ,[object Object],[object Object],CW4 David Lucy Resource Manager/Finance COL Leopoldo Quintas  Deployment Director  SFC Don H. Henry II  Black Belt Nathan Sprague Master Black Belt MAJ Andre L. Mackey  Sponsor / Process Owner
Analyze  Tollgate Checklist ,[object Object],[object Object],[object Object],[object Object],[object Object],[object Object],[object Object],[object Object],Has the team identified the key  factors (critical X’s) that have the biggest impact on process performance?  Have they validated the root causes? ,[object Object],[object Object],[object Object],[object Object],[object Object],[object Object],[object Object],[object Object],[object Object],Tollgate Review Stop
 

More Related Content

What's hot

8D Training, Eight Disciplines Training : Tonex Training
8D Training, Eight Disciplines Training : Tonex Training8D Training, Eight Disciplines Training : Tonex Training
8D Training, Eight Disciplines Training : Tonex TrainingBryan Len
 
8D Problem Solving - Automotive Industry
8D Problem Solving - Automotive Industry8D Problem Solving - Automotive Industry
8D Problem Solving - Automotive IndustryGestion Projet Auto
 
Operational excellence through lean &amp; six sigma
Operational excellence through lean &amp; six sigmaOperational excellence through lean &amp; six sigma
Operational excellence through lean &amp; six sigmaHarsh Upadhyay
 
Failure Mode Effect Analysis (FMEA)
Failure Mode Effect Analysis (FMEA)Failure Mode Effect Analysis (FMEA)
Failure Mode Effect Analysis (FMEA)DEEPAK SAHOO
 
Analyze phase lean six sigma tollgate template
Analyze phase   lean six sigma tollgate templateAnalyze phase   lean six sigma tollgate template
Analyze phase lean six sigma tollgate templateSteven Bonacorsi
 
8 D – Problem Solving Process
8 D – Problem Solving Process8 D – Problem Solving Process
8 D – Problem Solving ProcessAnand Subramaniam
 
Basic 8D Problem Solving Tools & Methods - Part 1
Basic 8D Problem Solving Tools & Methods - Part 1Basic 8D Problem Solving Tools & Methods - Part 1
Basic 8D Problem Solving Tools & Methods - Part 1Tony Alvarez
 
Business Process Re-Engineering by ADITI WALIA
Business Process Re-Engineering by ADITI WALIABusiness Process Re-Engineering by ADITI WALIA
Business Process Re-Engineering by ADITI WALIAAditi Walia
 
DOE Full factorial
DOE Full factorialDOE Full factorial
DOE Full factorialMonty Webb
 
Failure Modes & Effects Analysis (FMEA)
Failure Modes & Effects Analysis (FMEA)Failure Modes & Effects Analysis (FMEA)
Failure Modes & Effects Analysis (FMEA)Anand Subramaniam
 
Lean Six Sigma project Caponera
Lean Six Sigma project CaponeraLean Six Sigma project Caponera
Lean Six Sigma project CaponeraAnnalisa Caponera
 

What's hot (20)

Lean Six Sigma Green Belt roadmap poster
Lean Six Sigma Green Belt roadmap posterLean Six Sigma Green Belt roadmap poster
Lean Six Sigma Green Belt roadmap poster
 
8D Training, Eight Disciplines Training : Tonex Training
8D Training, Eight Disciplines Training : Tonex Training8D Training, Eight Disciplines Training : Tonex Training
8D Training, Eight Disciplines Training : Tonex Training
 
8D Problem Solving - Automotive Industry
8D Problem Solving - Automotive Industry8D Problem Solving - Automotive Industry
8D Problem Solving - Automotive Industry
 
Operational excellence through lean &amp; six sigma
Operational excellence through lean &amp; six sigmaOperational excellence through lean &amp; six sigma
Operational excellence through lean &amp; six sigma
 
Dmaic
DmaicDmaic
Dmaic
 
Failure Mode Effect Analysis (FMEA)
Failure Mode Effect Analysis (FMEA)Failure Mode Effect Analysis (FMEA)
Failure Mode Effect Analysis (FMEA)
 
Analyze phase lean six sigma tollgate template
Analyze phase   lean six sigma tollgate templateAnalyze phase   lean six sigma tollgate template
Analyze phase lean six sigma tollgate template
 
8 D – Problem Solving Process
8 D – Problem Solving Process8 D – Problem Solving Process
8 D – Problem Solving Process
 
Six Sigma Yellow Belt
Six Sigma Yellow BeltSix Sigma Yellow Belt
Six Sigma Yellow Belt
 
8D analysis presentation
8D analysis presentation8D analysis presentation
8D analysis presentation
 
Basic 8D Problem Solving Tools & Methods - Part 1
Basic 8D Problem Solving Tools & Methods - Part 1Basic 8D Problem Solving Tools & Methods - Part 1
Basic 8D Problem Solving Tools & Methods - Part 1
 
Quality Circle Steps
Quality Circle StepsQuality Circle Steps
Quality Circle Steps
 
7 QC Tools
7 QC Tools7 QC Tools
7 QC Tools
 
8D problem solving
8D problem solving8D problem solving
8D problem solving
 
Quality Circle
Quality CircleQuality Circle
Quality Circle
 
Dmaic
DmaicDmaic
Dmaic
 
Business Process Re-Engineering by ADITI WALIA
Business Process Re-Engineering by ADITI WALIABusiness Process Re-Engineering by ADITI WALIA
Business Process Re-Engineering by ADITI WALIA
 
DOE Full factorial
DOE Full factorialDOE Full factorial
DOE Full factorial
 
Failure Modes & Effects Analysis (FMEA)
Failure Modes & Effects Analysis (FMEA)Failure Modes & Effects Analysis (FMEA)
Failure Modes & Effects Analysis (FMEA)
 
Lean Six Sigma project Caponera
Lean Six Sigma project CaponeraLean Six Sigma project Caponera
Lean Six Sigma project Caponera
 

Viewers also liked

Improve Tollgate
Improve TollgateImprove Tollgate
Improve Tollgatedonhhenry
 
Measure Tollgate
Measure TollgateMeasure Tollgate
Measure Tollgatedonhhenry
 
2011 - Best Practices In Forecasting
2011 - Best Practices In Forecasting2011 - Best Practices In Forecasting
2011 - Best Practices In ForecastingProductCamp Toronto
 
Six sigma 12-21-2k[2]3
Six sigma 12-21-2k[2]3Six sigma 12-21-2k[2]3
Six sigma 12-21-2k[2]3sadegh57
 
Рептилии или пресмыкающиеся
Рептилии или пресмыкающиесяРептилии или пресмыкающиеся
Рептилии или пресмыкающиесяvolha_S
 
Six sigma final
Six sigma final Six sigma final
Six sigma final birjinia
 
Six sigma dmaic strategy
Six sigma dmaic strategySix sigma dmaic strategy
Six sigma dmaic strategyMohit Singla
 
Six Sigma the best ppt
Six Sigma the best pptSix Sigma the best ppt
Six Sigma the best pptRabia Sgh S
 

Viewers also liked (11)

Improve Tollgate
Improve TollgateImprove Tollgate
Improve Tollgate
 
Measure Tollgate
Measure TollgateMeasure Tollgate
Measure Tollgate
 
2011 - Best Practices In Forecasting
2011 - Best Practices In Forecasting2011 - Best Practices In Forecasting
2011 - Best Practices In Forecasting
 
Six sigma 12-21-2k[2]3
Six sigma 12-21-2k[2]3Six sigma 12-21-2k[2]3
Six sigma 12-21-2k[2]3
 
Six sigma
Six sigmaSix sigma
Six sigma
 
Рептилии или пресмыкающиеся
Рептилии или пресмыкающиесяРептилии или пресмыкающиеся
Рептилии или пресмыкающиеся
 
Six sigma final
Six sigma final Six sigma final
Six sigma final
 
Six sigma dmaic strategy
Six sigma dmaic strategySix sigma dmaic strategy
Six sigma dmaic strategy
 
A Roadmap To World Class Forecasting Accuracy
A Roadmap To World Class Forecasting AccuracyA Roadmap To World Class Forecasting Accuracy
A Roadmap To World Class Forecasting Accuracy
 
Phase variation
Phase variationPhase variation
Phase variation
 
Six Sigma the best ppt
Six Sigma the best pptSix Sigma the best ppt
Six Sigma the best ppt
 

Similar to Improve Tank Draw Quality by Reducing Rework

M&E Key Performance Indicators 2016
M&E Key Performance Indicators 2016M&E Key Performance Indicators 2016
M&E Key Performance Indicators 2016Nerissa Delos Santos
 
Life Cycle Cost Analysis Case of Study
Life Cycle Cost Analysis Case of StudyLife Cycle Cost Analysis Case of Study
Life Cycle Cost Analysis Case of StudyLuis Khalil, CMRP
 
IRJET- A Case Study Approach of Quality Tools in Manufacturing Industry
IRJET- A Case Study Approach of Quality Tools in Manufacturing IndustryIRJET- A Case Study Approach of Quality Tools in Manufacturing Industry
IRJET- A Case Study Approach of Quality Tools in Manufacturing IndustryIRJET Journal
 
Production Performance Results Internet Sample
Production Performance Results   Internet SampleProduction Performance Results   Internet Sample
Production Performance Results Internet Sampleantonioharenas
 
SSGB-Loss Reduction in ATF PLT
SSGB-Loss Reduction in ATF PLTSSGB-Loss Reduction in ATF PLT
SSGB-Loss Reduction in ATF PLTNeelesh Bhagwat
 
Using Six Sigma to reduce ATF pipeline transfer losses
Using Six Sigma to reduce ATF pipeline transfer lossesUsing Six Sigma to reduce ATF pipeline transfer losses
Using Six Sigma to reduce ATF pipeline transfer lossesNeelesh Bhagwat
 
1. What is operations management Why is it important Is a good k.docx
1. What is operations management Why is it important Is a good k.docx1. What is operations management Why is it important Is a good k.docx
1. What is operations management Why is it important Is a good k.docxjackiewalcutt
 
Tara institute-franchise batao
Tara institute-franchise bataoTara institute-franchise batao
Tara institute-franchise bataoFranchiseBatao
 
Tara institute-franchise
Tara institute-franchiseTara institute-franchise
Tara institute-franchiseFranchiseBatao
 
FY2009 BFCO Standardization Assessment Analysis
FY2009 BFCO Standardization Assessment AnalysisFY2009 BFCO Standardization Assessment Analysis
FY2009 BFCO Standardization Assessment AnalysisRobert Pierson
 
Scheduling by Primavera - Training
Scheduling by Primavera - TrainingScheduling by Primavera - Training
Scheduling by Primavera - TrainingMohammed Feroze
 
A multi phase decision on reliability growth with latent failure modes
A multi phase decision on reliability growth with latent failure modesA multi phase decision on reliability growth with latent failure modes
A multi phase decision on reliability growth with latent failure modesASQ Reliability Division
 
Reliability Prediction using the Fussel Algorithm
Reliability Prediction using the Fussel AlgorithmReliability Prediction using the Fussel Algorithm
Reliability Prediction using the Fussel AlgorithmIRJET Journal
 
Dual Purpose Generator Set Maintenance Manual
Dual Purpose Generator Set Maintenance ManualDual Purpose Generator Set Maintenance Manual
Dual Purpose Generator Set Maintenance ManualRimsky Cheng
 
Flex Maint Plan C 40 A
Flex Maint Plan C 40 AFlex Maint Plan C 40 A
Flex Maint Plan C 40 Akingstonmj
 

Similar to Improve Tank Draw Quality by Reducing Rework (20)

M&E Key Performance Indicators 2016
M&E Key Performance Indicators 2016M&E Key Performance Indicators 2016
M&E Key Performance Indicators 2016
 
Dmaic
DmaicDmaic
Dmaic
 
Life Cycle Cost Analysis Case of Study
Life Cycle Cost Analysis Case of StudyLife Cycle Cost Analysis Case of Study
Life Cycle Cost Analysis Case of Study
 
IRJET- A Case Study Approach of Quality Tools in Manufacturing Industry
IRJET- A Case Study Approach of Quality Tools in Manufacturing IndustryIRJET- A Case Study Approach of Quality Tools in Manufacturing Industry
IRJET- A Case Study Approach of Quality Tools in Manufacturing Industry
 
Production Performance Results Internet Sample
Production Performance Results   Internet SampleProduction Performance Results   Internet Sample
Production Performance Results Internet Sample
 
SSGB-Loss Reduction in ATF PLT
SSGB-Loss Reduction in ATF PLTSSGB-Loss Reduction in ATF PLT
SSGB-Loss Reduction in ATF PLT
 
Using Six Sigma to reduce ATF pipeline transfer losses
Using Six Sigma to reduce ATF pipeline transfer lossesUsing Six Sigma to reduce ATF pipeline transfer losses
Using Six Sigma to reduce ATF pipeline transfer losses
 
1. What is operations management Why is it important Is a good k.docx
1. What is operations management Why is it important Is a good k.docx1. What is operations management Why is it important Is a good k.docx
1. What is operations management Why is it important Is a good k.docx
 
Tara institute-franchise batao
Tara institute-franchise bataoTara institute-franchise batao
Tara institute-franchise batao
 
Tara institute-franchise
Tara institute-franchiseTara institute-franchise
Tara institute-franchise
 
FY2009 BFCO Standardization Assessment Analysis
FY2009 BFCO Standardization Assessment AnalysisFY2009 BFCO Standardization Assessment Analysis
FY2009 BFCO Standardization Assessment Analysis
 
IRJET_KSK
IRJET_KSKIRJET_KSK
IRJET_KSK
 
Scheduling by Primavera - Training
Scheduling by Primavera - TrainingScheduling by Primavera - Training
Scheduling by Primavera - Training
 
A multi phase decision on reliability growth with latent failure modes
A multi phase decision on reliability growth with latent failure modesA multi phase decision on reliability growth with latent failure modes
A multi phase decision on reliability growth with latent failure modes
 
SIP PPT
SIP PPTSIP PPT
SIP PPT
 
Reliability Prediction using the Fussel Algorithm
Reliability Prediction using the Fussel AlgorithmReliability Prediction using the Fussel Algorithm
Reliability Prediction using the Fussel Algorithm
 
Dual Purpose Generator Set Maintenance Manual
Dual Purpose Generator Set Maintenance ManualDual Purpose Generator Set Maintenance Manual
Dual Purpose Generator Set Maintenance Manual
 
S Sathish Kumar
S Sathish KumarS Sathish Kumar
S Sathish Kumar
 
Flex Maint Plan C 40 A
Flex Maint Plan C 40 AFlex Maint Plan C 40 A
Flex Maint Plan C 40 A
 
Kaizen Event formalized post-molding
Kaizen Event formalized post-molding Kaizen Event formalized post-molding
Kaizen Event formalized post-molding
 

Recently uploaded

Organic Name Reactions for the students and aspirants of Chemistry12th.pptx
Organic Name Reactions  for the students and aspirants of Chemistry12th.pptxOrganic Name Reactions  for the students and aspirants of Chemistry12th.pptx
Organic Name Reactions for the students and aspirants of Chemistry12th.pptxVS Mahajan Coaching Centre
 
Capitol Tech U Doctoral Presentation - April 2024.pptx
Capitol Tech U Doctoral Presentation - April 2024.pptxCapitol Tech U Doctoral Presentation - April 2024.pptx
Capitol Tech U Doctoral Presentation - April 2024.pptxCapitolTechU
 
Computed Fields and api Depends in the Odoo 17
Computed Fields and api Depends in the Odoo 17Computed Fields and api Depends in the Odoo 17
Computed Fields and api Depends in the Odoo 17Celine George
 
Hierarchy of management that covers different levels of management
Hierarchy of management that covers different levels of managementHierarchy of management that covers different levels of management
Hierarchy of management that covers different levels of managementmkooblal
 
Incoming and Outgoing Shipments in 1 STEP Using Odoo 17
Incoming and Outgoing Shipments in 1 STEP Using Odoo 17Incoming and Outgoing Shipments in 1 STEP Using Odoo 17
Incoming and Outgoing Shipments in 1 STEP Using Odoo 17Celine George
 
ECONOMIC CONTEXT - PAPER 1 Q3: NEWSPAPERS.pptx
ECONOMIC CONTEXT - PAPER 1 Q3: NEWSPAPERS.pptxECONOMIC CONTEXT - PAPER 1 Q3: NEWSPAPERS.pptx
ECONOMIC CONTEXT - PAPER 1 Q3: NEWSPAPERS.pptxiammrhaywood
 
Alper Gobel In Media Res Media Component
Alper Gobel In Media Res Media ComponentAlper Gobel In Media Res Media Component
Alper Gobel In Media Res Media ComponentInMediaRes1
 
Historical philosophical, theoretical, and legal foundations of special and i...
Historical philosophical, theoretical, and legal foundations of special and i...Historical philosophical, theoretical, and legal foundations of special and i...
Historical philosophical, theoretical, and legal foundations of special and i...jaredbarbolino94
 
KSHARA STURA .pptx---KSHARA KARMA THERAPY (CAUSTIC THERAPY)————IMP.OF KSHARA ...
KSHARA STURA .pptx---KSHARA KARMA THERAPY (CAUSTIC THERAPY)————IMP.OF KSHARA ...KSHARA STURA .pptx---KSHARA KARMA THERAPY (CAUSTIC THERAPY)————IMP.OF KSHARA ...
KSHARA STURA .pptx---KSHARA KARMA THERAPY (CAUSTIC THERAPY)————IMP.OF KSHARA ...M56BOOKSTORE PRODUCT/SERVICE
 
Software Engineering Methodologies (overview)
Software Engineering Methodologies (overview)Software Engineering Methodologies (overview)
Software Engineering Methodologies (overview)eniolaolutunde
 
Solving Puzzles Benefits Everyone (English).pptx
Solving Puzzles Benefits Everyone (English).pptxSolving Puzzles Benefits Everyone (English).pptx
Solving Puzzles Benefits Everyone (English).pptxOH TEIK BIN
 
Final demo Grade 9 for demo Plan dessert.pptx
Final demo Grade 9 for demo Plan dessert.pptxFinal demo Grade 9 for demo Plan dessert.pptx
Final demo Grade 9 for demo Plan dessert.pptxAvyJaneVismanos
 
Proudly South Africa powerpoint Thorisha.pptx
Proudly South Africa powerpoint Thorisha.pptxProudly South Africa powerpoint Thorisha.pptx
Proudly South Africa powerpoint Thorisha.pptxthorishapillay1
 
Earth Day Presentation wow hello nice great
Earth Day Presentation wow hello nice greatEarth Day Presentation wow hello nice great
Earth Day Presentation wow hello nice greatYousafMalik24
 
Enzyme, Pharmaceutical Aids, Miscellaneous Last Part of Chapter no 5th.pdf
Enzyme, Pharmaceutical Aids, Miscellaneous Last Part of Chapter no 5th.pdfEnzyme, Pharmaceutical Aids, Miscellaneous Last Part of Chapter no 5th.pdf
Enzyme, Pharmaceutical Aids, Miscellaneous Last Part of Chapter no 5th.pdfSumit Tiwari
 
Biting mechanism of poisonous snakes.pdf
Biting mechanism of poisonous snakes.pdfBiting mechanism of poisonous snakes.pdf
Biting mechanism of poisonous snakes.pdfadityarao40181
 
Painted Grey Ware.pptx, PGW Culture of India
Painted Grey Ware.pptx, PGW Culture of IndiaPainted Grey Ware.pptx, PGW Culture of India
Painted Grey Ware.pptx, PGW Culture of IndiaVirag Sontakke
 
18-04-UA_REPORT_MEDIALITERAСY_INDEX-DM_23-1-final-eng.pdf
18-04-UA_REPORT_MEDIALITERAСY_INDEX-DM_23-1-final-eng.pdf18-04-UA_REPORT_MEDIALITERAСY_INDEX-DM_23-1-final-eng.pdf
18-04-UA_REPORT_MEDIALITERAСY_INDEX-DM_23-1-final-eng.pdfssuser54595a
 

Recently uploaded (20)

Organic Name Reactions for the students and aspirants of Chemistry12th.pptx
Organic Name Reactions  for the students and aspirants of Chemistry12th.pptxOrganic Name Reactions  for the students and aspirants of Chemistry12th.pptx
Organic Name Reactions for the students and aspirants of Chemistry12th.pptx
 
Capitol Tech U Doctoral Presentation - April 2024.pptx
Capitol Tech U Doctoral Presentation - April 2024.pptxCapitol Tech U Doctoral Presentation - April 2024.pptx
Capitol Tech U Doctoral Presentation - April 2024.pptx
 
Computed Fields and api Depends in the Odoo 17
Computed Fields and api Depends in the Odoo 17Computed Fields and api Depends in the Odoo 17
Computed Fields and api Depends in the Odoo 17
 
TataKelola dan KamSiber Kecerdasan Buatan v022.pdf
TataKelola dan KamSiber Kecerdasan Buatan v022.pdfTataKelola dan KamSiber Kecerdasan Buatan v022.pdf
TataKelola dan KamSiber Kecerdasan Buatan v022.pdf
 
Hierarchy of management that covers different levels of management
Hierarchy of management that covers different levels of managementHierarchy of management that covers different levels of management
Hierarchy of management that covers different levels of management
 
Incoming and Outgoing Shipments in 1 STEP Using Odoo 17
Incoming and Outgoing Shipments in 1 STEP Using Odoo 17Incoming and Outgoing Shipments in 1 STEP Using Odoo 17
Incoming and Outgoing Shipments in 1 STEP Using Odoo 17
 
ECONOMIC CONTEXT - PAPER 1 Q3: NEWSPAPERS.pptx
ECONOMIC CONTEXT - PAPER 1 Q3: NEWSPAPERS.pptxECONOMIC CONTEXT - PAPER 1 Q3: NEWSPAPERS.pptx
ECONOMIC CONTEXT - PAPER 1 Q3: NEWSPAPERS.pptx
 
ESSENTIAL of (CS/IT/IS) class 06 (database)
ESSENTIAL of (CS/IT/IS) class 06 (database)ESSENTIAL of (CS/IT/IS) class 06 (database)
ESSENTIAL of (CS/IT/IS) class 06 (database)
 
Alper Gobel In Media Res Media Component
Alper Gobel In Media Res Media ComponentAlper Gobel In Media Res Media Component
Alper Gobel In Media Res Media Component
 
Historical philosophical, theoretical, and legal foundations of special and i...
Historical philosophical, theoretical, and legal foundations of special and i...Historical philosophical, theoretical, and legal foundations of special and i...
Historical philosophical, theoretical, and legal foundations of special and i...
 
KSHARA STURA .pptx---KSHARA KARMA THERAPY (CAUSTIC THERAPY)————IMP.OF KSHARA ...
KSHARA STURA .pptx---KSHARA KARMA THERAPY (CAUSTIC THERAPY)————IMP.OF KSHARA ...KSHARA STURA .pptx---KSHARA KARMA THERAPY (CAUSTIC THERAPY)————IMP.OF KSHARA ...
KSHARA STURA .pptx---KSHARA KARMA THERAPY (CAUSTIC THERAPY)————IMP.OF KSHARA ...
 
Software Engineering Methodologies (overview)
Software Engineering Methodologies (overview)Software Engineering Methodologies (overview)
Software Engineering Methodologies (overview)
 
Solving Puzzles Benefits Everyone (English).pptx
Solving Puzzles Benefits Everyone (English).pptxSolving Puzzles Benefits Everyone (English).pptx
Solving Puzzles Benefits Everyone (English).pptx
 
Final demo Grade 9 for demo Plan dessert.pptx
Final demo Grade 9 for demo Plan dessert.pptxFinal demo Grade 9 for demo Plan dessert.pptx
Final demo Grade 9 for demo Plan dessert.pptx
 
Proudly South Africa powerpoint Thorisha.pptx
Proudly South Africa powerpoint Thorisha.pptxProudly South Africa powerpoint Thorisha.pptx
Proudly South Africa powerpoint Thorisha.pptx
 
Earth Day Presentation wow hello nice great
Earth Day Presentation wow hello nice greatEarth Day Presentation wow hello nice great
Earth Day Presentation wow hello nice great
 
Enzyme, Pharmaceutical Aids, Miscellaneous Last Part of Chapter no 5th.pdf
Enzyme, Pharmaceutical Aids, Miscellaneous Last Part of Chapter no 5th.pdfEnzyme, Pharmaceutical Aids, Miscellaneous Last Part of Chapter no 5th.pdf
Enzyme, Pharmaceutical Aids, Miscellaneous Last Part of Chapter no 5th.pdf
 
Biting mechanism of poisonous snakes.pdf
Biting mechanism of poisonous snakes.pdfBiting mechanism of poisonous snakes.pdf
Biting mechanism of poisonous snakes.pdf
 
Painted Grey Ware.pptx, PGW Culture of India
Painted Grey Ware.pptx, PGW Culture of IndiaPainted Grey Ware.pptx, PGW Culture of India
Painted Grey Ware.pptx, PGW Culture of India
 
18-04-UA_REPORT_MEDIALITERAСY_INDEX-DM_23-1-final-eng.pdf
18-04-UA_REPORT_MEDIALITERAСY_INDEX-DM_23-1-final-eng.pdf18-04-UA_REPORT_MEDIALITERAСY_INDEX-DM_23-1-final-eng.pdf
18-04-UA_REPORT_MEDIALITERAСY_INDEX-DM_23-1-final-eng.pdf
 

Improve Tank Draw Quality by Reducing Rework

  • 1. Lean Six Sigma Improving FTX/STX2 Tank Draw Quality SFC Henry, Don H. II Project Initiation Date: 31/03/08 Analyze Tollgate Date: 03/07/08
  • 2.
  • 3.
  • 4.
  • 5.
  • 6.
  • 7. Critical X’s: Cause and Effect Matrix Cause and Effect Matrix Key Process Output Variables Customer Importance 10 9 2 6 8                     Customer Rank 1 2 3 4 5                     1 2 3 4 5 6 7 8 9 10 11 12 13 14 15 Process Step KPIV accurate tank list 5988-E QA/QC DA Form 2062 Dispatch                     Rank Rating Total Process Steps & Key Process Input Variables 1 T-1 RATSS 1 9 9 9 1                     2 7.533 171 2 PMCS Technical Manual 9 1 1 9 9                     1 10 227 3 QA/QC UMA inspector 9 1 1 3 3                     3 6.3 143 4 tank sign over DA 2062 9 1 1 1 3                     4 5.771 131 5 tank dispatch 5987-E 9 1 1 1 1                     5 5.066 115 ###                                     #####  
  • 8. Potential Root Causes: C & E Diagram Effect: The tank draw takes too long. Man Machine Material Method Spread thinly across multiple tasks Shortage of UMA maintenance personnel Deadlines, AOAP, Service Schedule, affect # of tanks available Tanks already in use by other units/missions BII draw uses excessive people and excess time RATTS request is not referenced by UMA to assign accurate bumper number list Tanks are PMCS’d Tanks are QA/QC’d Tanks are dispatched Excessive delays from lack of UMA personnel 5988-E not updated by UMA
  • 9. Potential Root Causes: FMEA Process Step / Input Potential Failure Mode Potential Failure Effects SEVERITY Potential Causes OCCURRENCE Current Controls DETECTION RPN   What is the process step and Input under investiga-tion? In what ways does the Key Input go wrong? What is the impact on the Key Output Variables (Customer Requirements)? What causes the Key Input to go wrong? What are the existing controls and procedures (inspection and test) that prevent either the cause or the Failure Mode? T-1 bumper number list not accurate excessive delays 7 lack of organization 7 none 7 343 PMCS not updated rework 7 lack of personnel 6 Army Policy 5 210 QA/QC not timely rework 4 lack of maintenance 4 EXSOP/Army policy 4 64 tank sign over already issued rework 7 lack of organization 2 Army Policy/EXSOP 2 28 tank dispatch does not go wrong no problems 1 no problems 1 EXSOP 5 5
  • 10. Reducing List of Root Causes: Pareto Analysis Track able causes contained over 90% of the Defects. Our project will focus on tracking vehicle maintenance status.
  • 11. Root Cause Analysis: Non-Value Add Analysis QAQC Maintenance leader Dispatch Soldier Issues bumper number list to soldier Maintenance leader checks 5988-E and verifies faults/makes repairs if needed Hand receipt Vehicle signed over to soldier Avg. Delay 2 hours Avg.Delay 15 min Avg. Delay 90 min Soldier conducts PMCS and completes 5988-E, turns it in to maintenance leader Passes QAQC Receives signed QAQC sheet Vehicle dispatched to soldier YES NO NVA time is in dark blue Total delay time is 3.75 hours Retrieves info from RATSS system Notify UMA of the # of tanks needed
  • 12. Root Cause Analysis: Histogram The outlier was a vehicle issued that was actually NMC and required 90 minutes to repair. The vehicle that required 60 minutes was actually dispatched to another unit. Two of the five that required 45 minutes of work were deadline with a third needing a QAQC from UMA 5.25 hours were spent doing rework that is non value added
  • 13.
  • 14.
  • 15.
  • 16. Tukey’s Pairwise Comparison One-way ANOVA: TIME versus DEFECT Tukey 95% Simultaneous Confidence Intervals All Pairwise Comparisons among Levels of DEFECT Individual confidence level = 98.87% DEFECT = D subtracted from: DEFECT Lower Center Upper --------+---------+---------+---------+- I -61.47 -3.75 53.97 (----------*-----------) N -66.23 -36.96 -7.70 (-----*----) Q -76.47 -18.75 38.97 (----------*-----------) --------+---------+---------+---------+- -50 0 50 100 DEFECT = I subtracted from: DEFECT Lower Center Upper --------+---------+---------+---------+- N -86.65 -33.21 20.22 (---------*----------) Q -88.01 -15.00 58.01 (--------------*--------------) --------+---------+---------+---------+- -50 0 50 100 DEFECT = N subtracted from: DEFECT Lower Center Upper --------+---------+---------+---------+- Q -35.22 18.21 71.65 (----------*---------) --------+---------+---------+---------+- -50 0 50 100 Statistically significant factors are in RED legend I= issued already N= no defects Q= need QAQC D=deadlined Deadlined tanks are statistically significantly different in terms of time and defects Tanks with no defects are statistically significantly different in terms of time and defects
  • 17.
  • 18.
  • 19.
  • 20.
  • 21. Impact of Root Causes on Y
  • 22. Prioritized Root Causes 1 In team’s Control = 9; In team’s sphere of influence = 3; Out of team’s control = 1 2 High impact = 9; Medium impact = 3; Low impact = 1 Effect (Y) Root Cause (X) Hypothesis for Relationship In/Out of Team’s Control 1 Impact 2 Score (Control x Impact) Priority of Effort rework In-accurate bumper numbers Accurate bumper numbers will increase throughput 3 9 27 2 Poor tank maintenance PMCS not completed correctly Correctly performed PMCS will improve tank draw quality 9 9 81 1 Poor tank maintenance 5988-E’s are not regularly updated Regularly update 5988-E’s will improve tank draw quality 3 9 27 3 rework Tanks are issued that are not ready for issue Rework will be reduced if the tanks are ready for issue at the time they are to be issued to units 3 3 9 4
  • 23.
  • 24.
  • 25.
  • 26.
  • 27. Analyze Storyboard Define Project Charter T-6 IPR T2T RATSS T-5 T2T T-4 T2T T-3 T2T T-2 IPR vehicle Bumper #s Given to unit T-1 Tank draw, HETT, 5988-E update Measure BII draw measured Tank draw measured 5988-E updates measured RIE Baselines collected Critical X’s Identified Potential Root Causes Identified Root Causes Prioritized Analyze Problem: Poor tank quality at issue Goal: Improve tank quality at issue, Reduce rework, improve fault tracking Non-quantifiable Benefits Morale, tank maintenance, fault tracking
  • 28.
  • 29.
  • 30.  

Editor's Notes

  1. Expectations from the Measure Phase A detailed process map has been developed by the team and reflects key customer requirements and process variables. Key input, process and output metrics have been identified for data collection (potential Critical X’s) The relationship between process inputs and customer requirements has been investigated to provide a direction for the Analysis Phase. Special cause variation is reduced/removed providing an accurate picture of the process. A measurement system is in place and it’s error is understood. Baseline capability has been established and a path forward has been identified. A detailed project plan for the next phase exists, is realistic and reflects a more accurate financial impact statement. Who Should Attend Green Belt or Black Belt Required Project Leader Required Project Sponsor Required Process Owner Required (if not = Project Sponsor) Project Team Nice to have; Required for M, A, I, and C Stakeholders Required/Strongly Recommended Deployment Director Recommended Senior Management As possible or at DD request Master Black Belt Strongly Recommended (if available to attend)