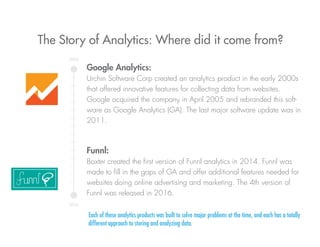
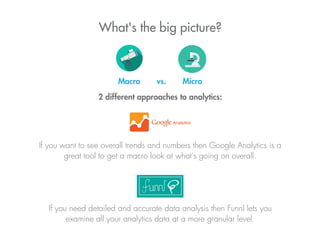
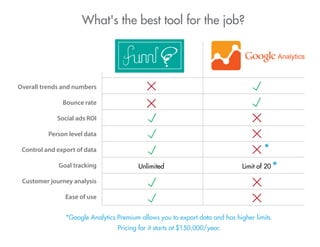
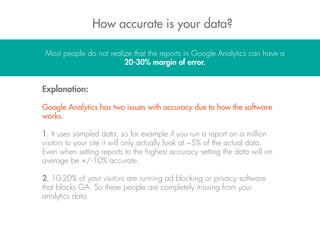
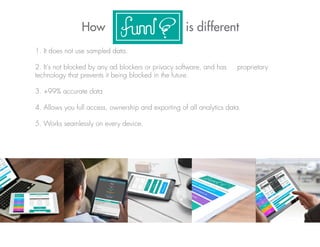
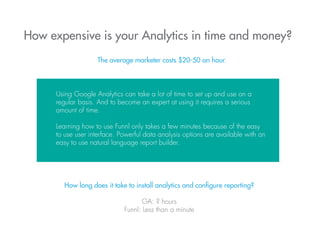
2. Do you make business decisions based on data?
Modern marketers know that a data-driven approach to
sales and marketing is needed for success. But many
people do not know key aspects of how analytics software
actually works.
3. The Story of Analytics: Where did it come from?
Google Analytics:
Urchin Software Corp created an analytics product in the early 2000s
that offered innovative features for collecting data from websites.
Google acquired the company in April 2005 and rebranded this soft-
ware as Google Analytics (GA). The last major software update was in
2011.
Funnl:
Boxter created the first version of Funnl analytics in 2014. Funnl was
made to fill in the gaps of GA and offer additional features needed for
websites doing online advertising and marketing. The 4th version of
Funnl was released in 2016.
Each of these analytics products was built to solve major problems at the time, and each has a totally
different approach to storing and analyzing data.
2016
2005
4. What's the big picture?
Macro vs. Micro
2 different approaches to analytics:
If you want to see overall trends and numbers then Google Analytics is a
great tool to get a macro look at what's going on overall.
If you need detailed and accurate data analysis then Funnl lets you
examine all your analytics data at a more granular level.
5. Overall trends and numbers
Bounce rate
Social ads ROI
Person level data
Control and export of data
Goal tracking
Customer journey analysis
Ease of use
Limit of 20Unlimited
*Google Analytics Premium allows you to export data and has higher limits.
Pricing for it starts at $150,000/year.
What's the best tool for the job?
*
*
6. How accurate is your data?
Most people do not realize that the reports in Google Analytics can have a
20-30% margin of error.
Explanation:
Google Analytics has two issues with accuracy due to how the software
works.
1. It uses sampled data, so for example if you run a report on a million
visitors to your site it will only actually look at ~5% of the actual data.
Even when setting reports to the highest accuracy setting the data will on
average be +/-10% accurate.
2. 10-20% of your visitors are running ad blocking or privacy software
that blocks GA. So these people are completely missing from your
analytics data.
7. How is different
1. It does not use sampled data.
2. It's not blocked by any ad blockers or privacy software, and has proprietary
technology that prevents it being blocked in the future.
3. +99% accurate data
4. Allows you full access, ownership and exporting of all analytics data.
5. Works seamlessly on every device.
8. How expensive is your Analytics in time and money?
The average marketer costs $20-50 an hour.
Using Google Analytics can take a lot of time to set up and use on a
regular basis. And to become an expert at using it requires a serious
amount of time.
Learning how to use Funnl only takes a few minutes because of the easy
to use user interface. Powerful data analysis options are available with an
easy to use natural language report builder.
How long does it take to install analytics and configure reporting?
GA: ? hours
Funnl: Less than a minute
9. Do you know the ROI of _______?
Are you spending money for online ads, social media, SEO or marketing?
Google makes all their money from companies buying their ads. Their number one goal
as a public company is to get people to buy more ads.
Funnl has a business model of providing top notch data analytics to businesses. The goal
of Funnl is to help you understand your data and make smarter decisions for growing your
business.
Funnl helps you quickly and easily understand the ROI of:
Facebook
Pinterest
Twitter
LinkedIn
Instagram
PPC ads
Content marketing
SEO
10. Customer Journey Data
Would you like to explore all your customer's journeys to optimize conversions?
no yes
Google Analytics simply does not give you any of this customer journey data for
individual people. It only gives you an overview of major data points.
11. - Referrer sources
- Time and date of every interaction
- IP addresses
- Geographic location
- Device
- Operating system
- Browser
- Screen resolution
- Language
- User agent
- Total number of interactions
- Length in time of customer journey
- Total number of separate visits
- Whether each interaction is on mobile
- UTM Campaign names
- UTM Sources
- UTM Mediums
- UTM Terms
- UTM Content
- Name and contact info from forms
- Time per page
Funnl stores all this data for every individual person
in your sales funnel:
Funnl reports allow you to sort, filter, search and visualize any of these data
points very quickly. You can do a deep dive into the customer journey of any
person to see everything they did even over months of time.
You can also query any combination of these data points to determine ROI,
conversion rates or any other questions you want to ask about the people in
your sales funnel.
12. Have any questions or want to see
more?
Contact us for a free consultation or demo.
info@myfunnl.com
Another quality product by
Boxter