Download as PDF, PPTX

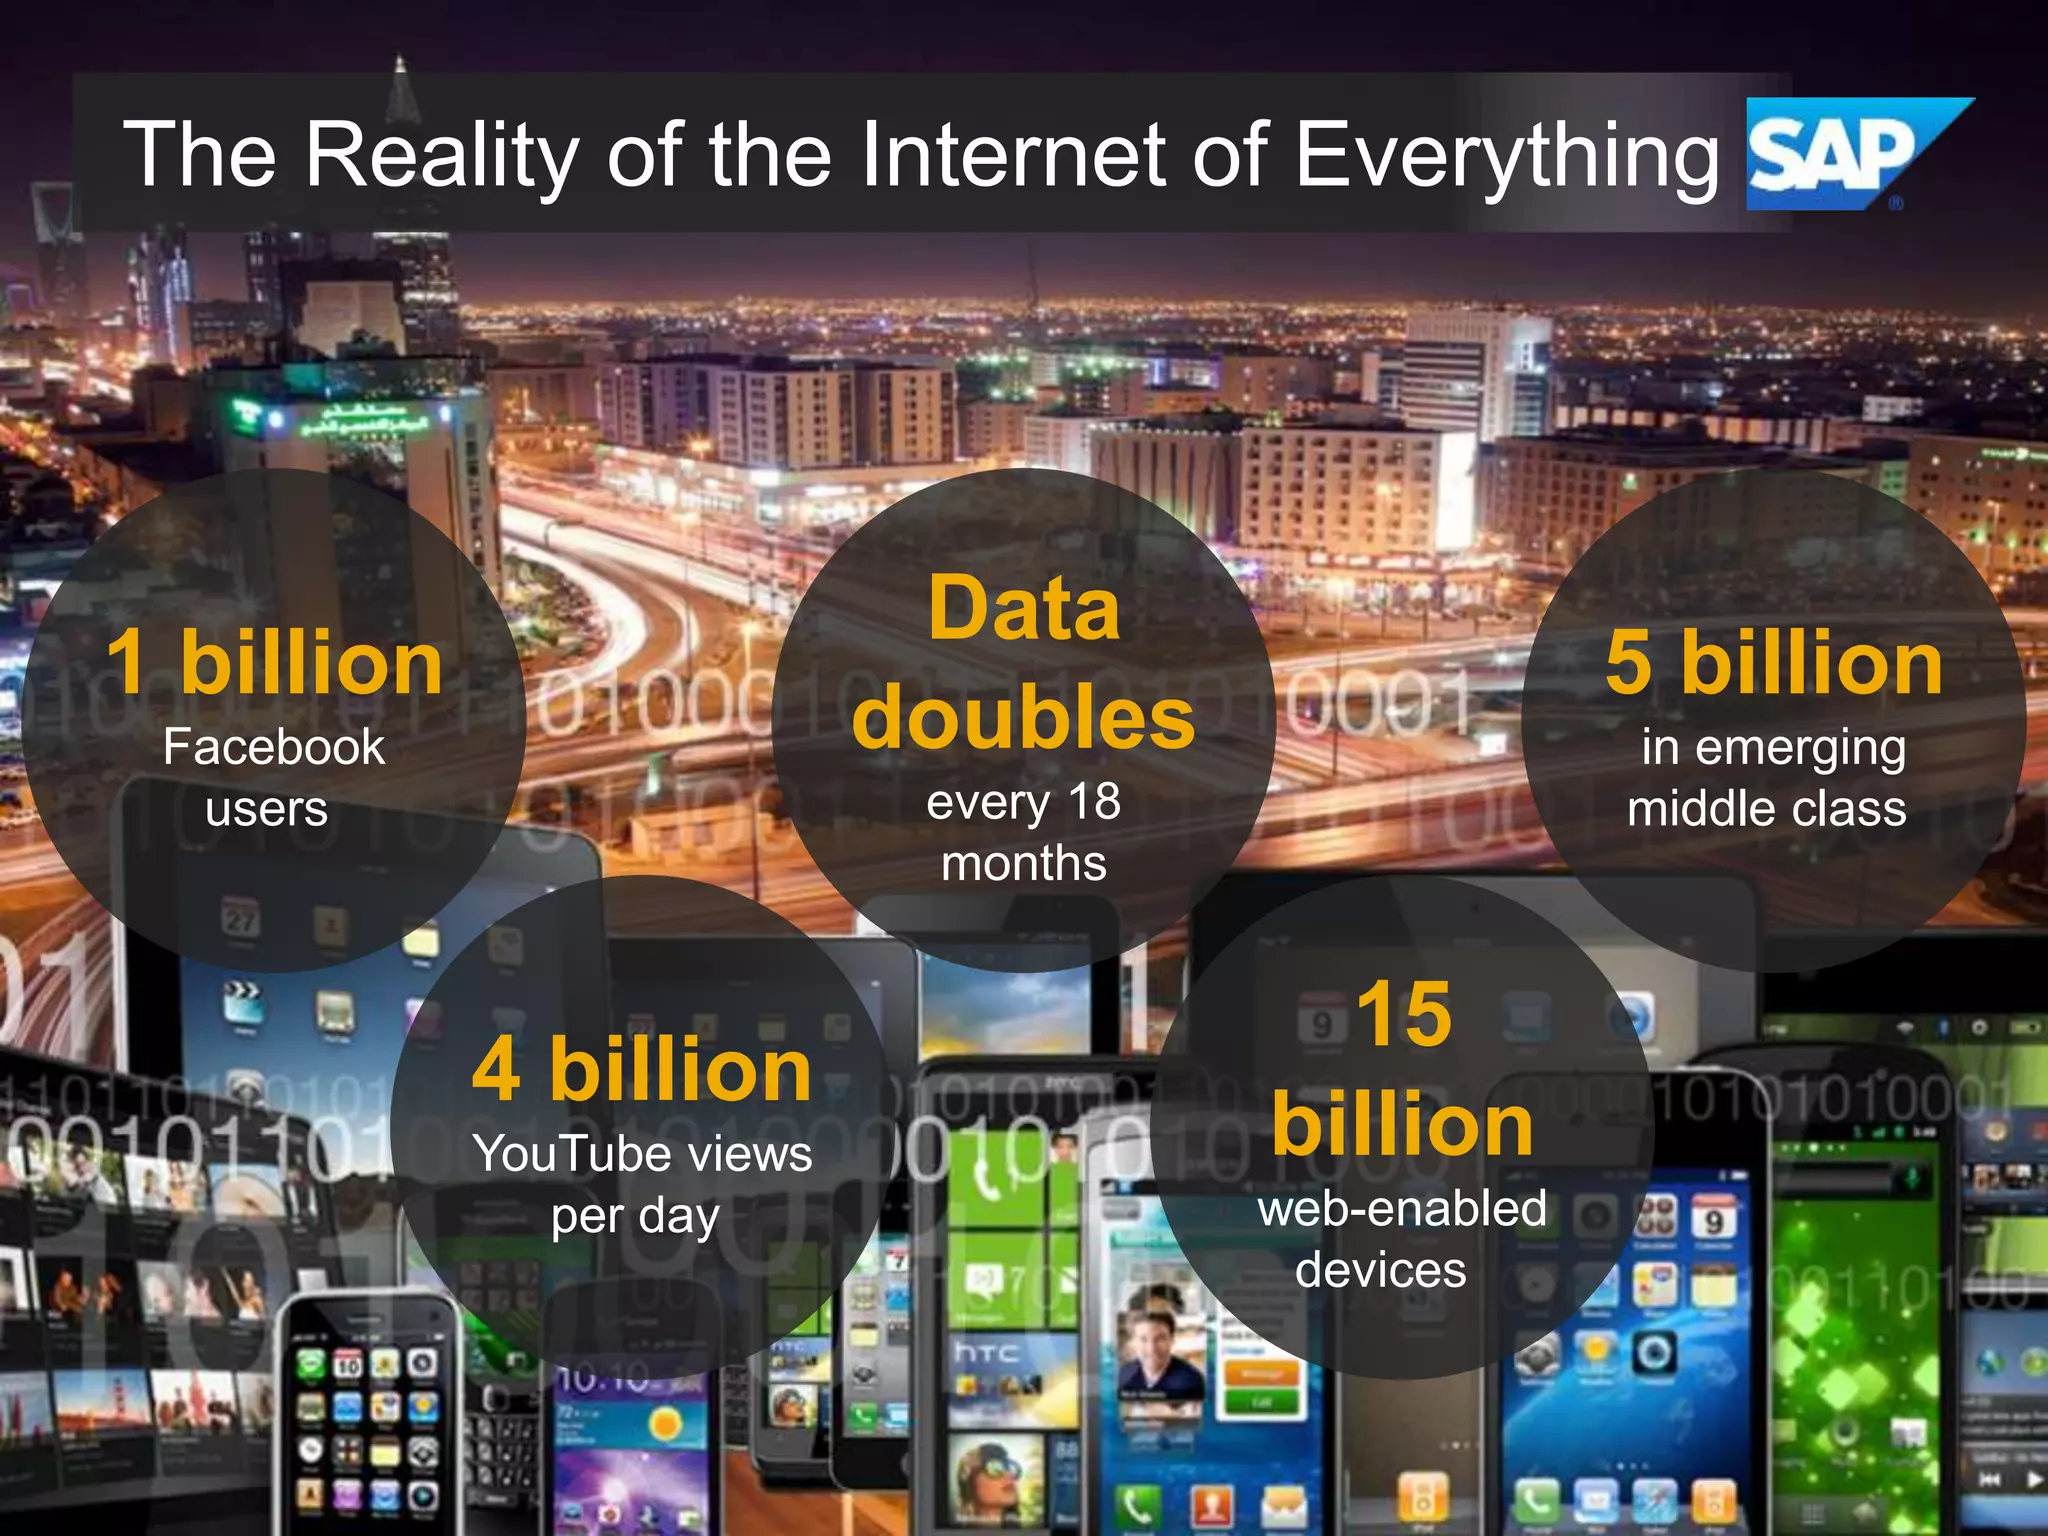
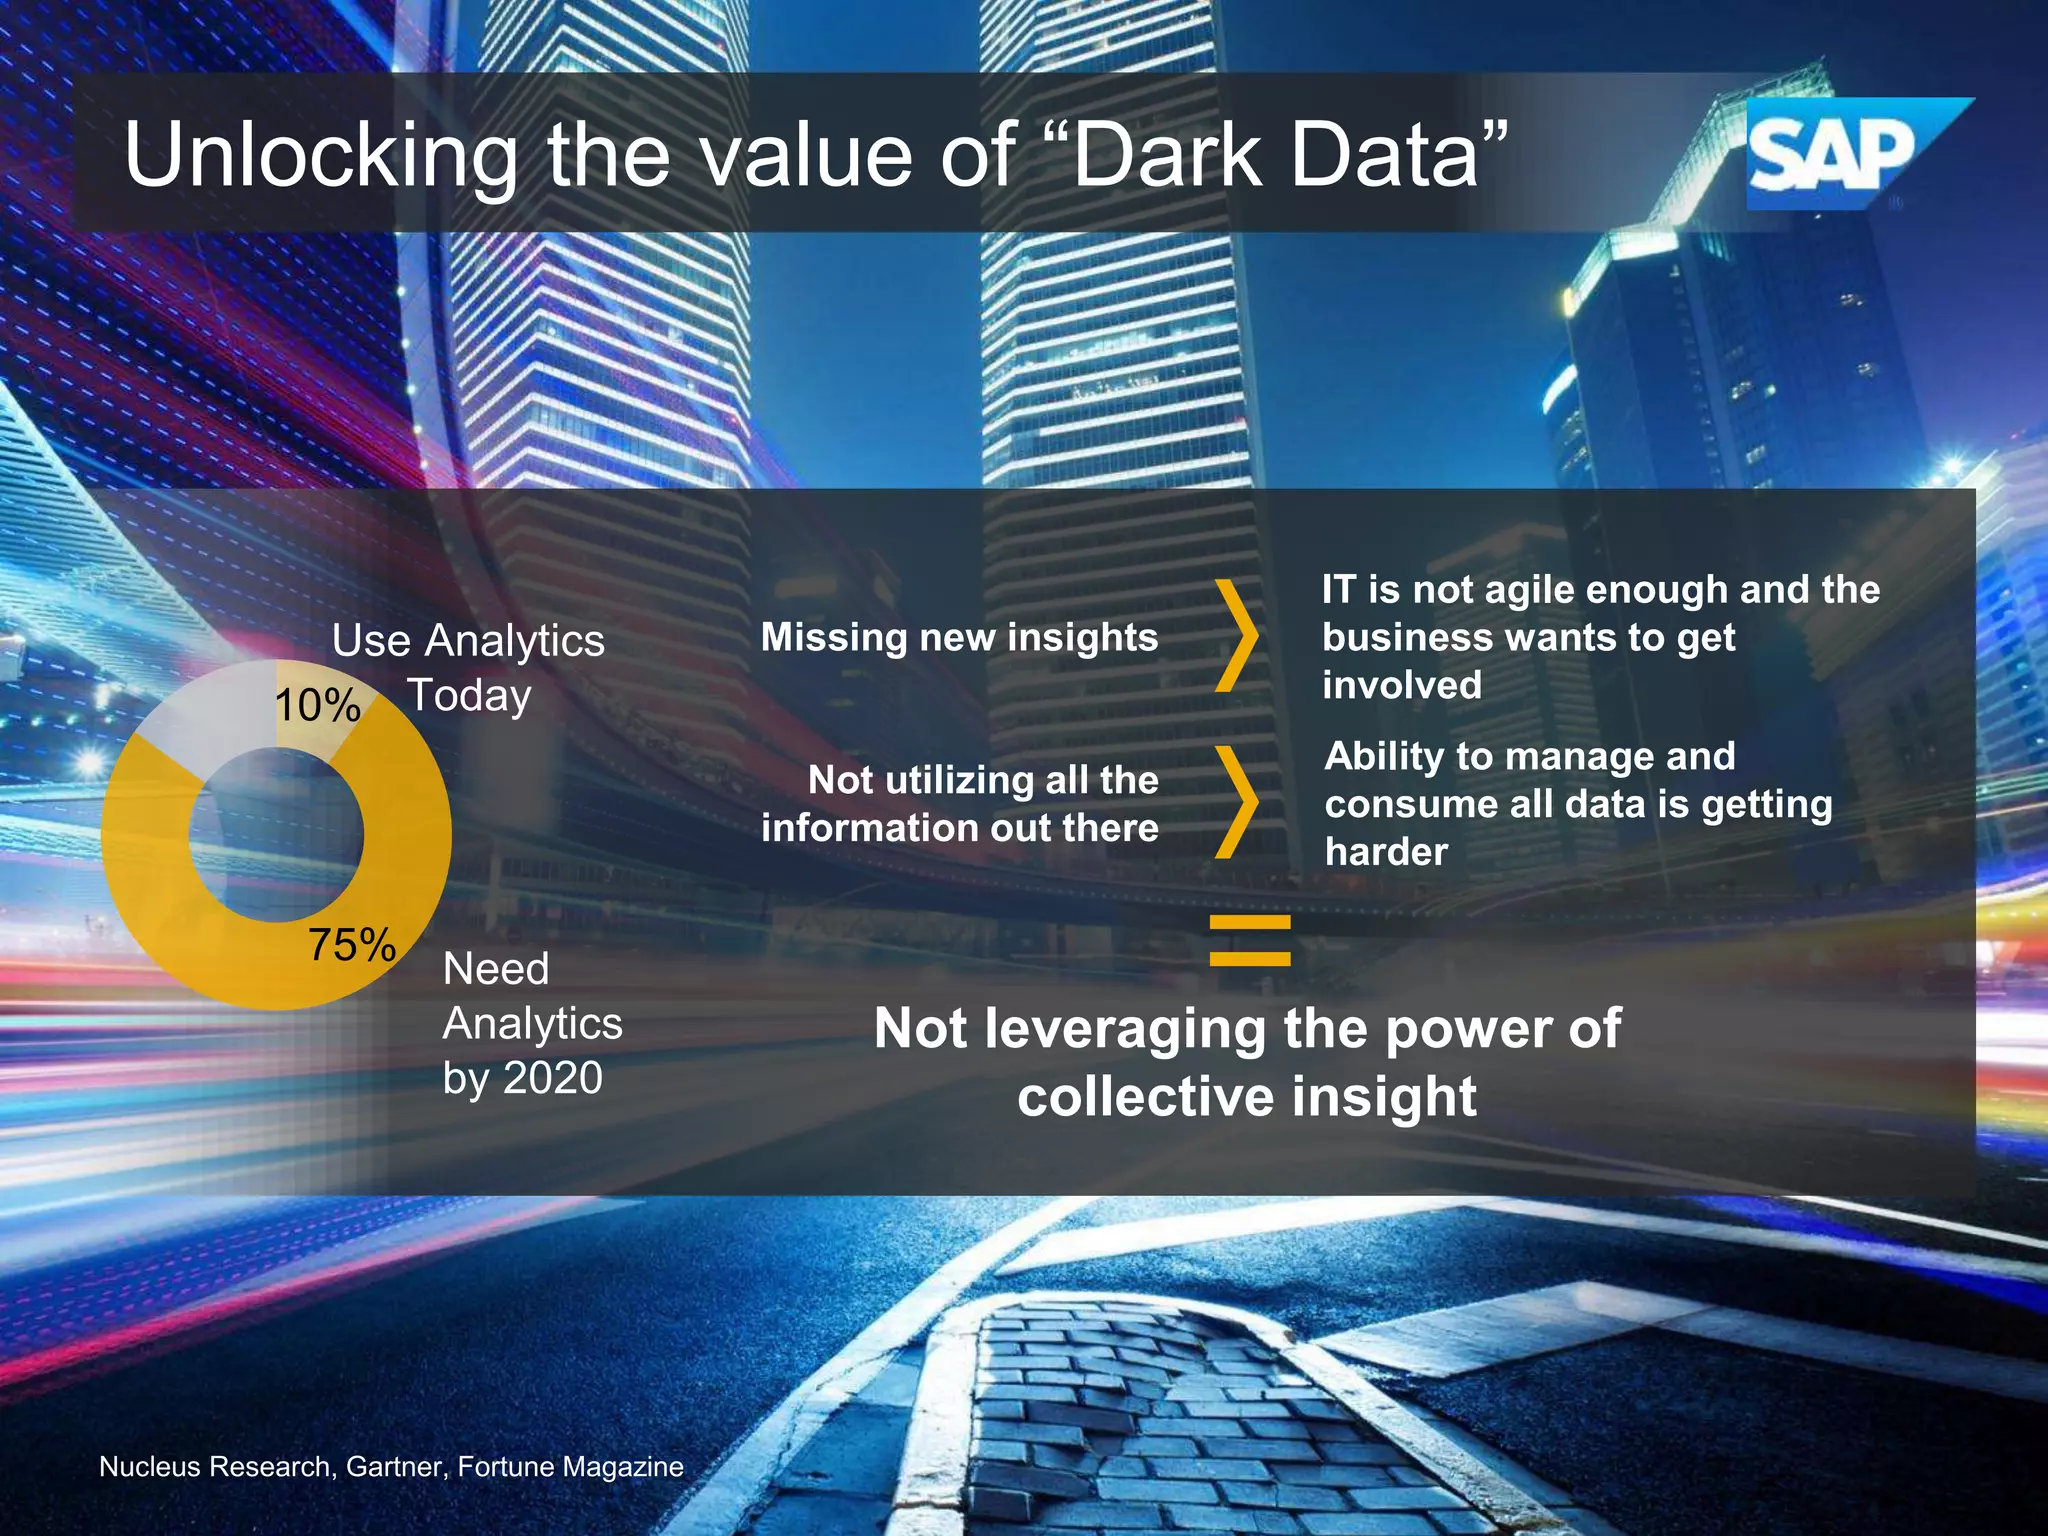
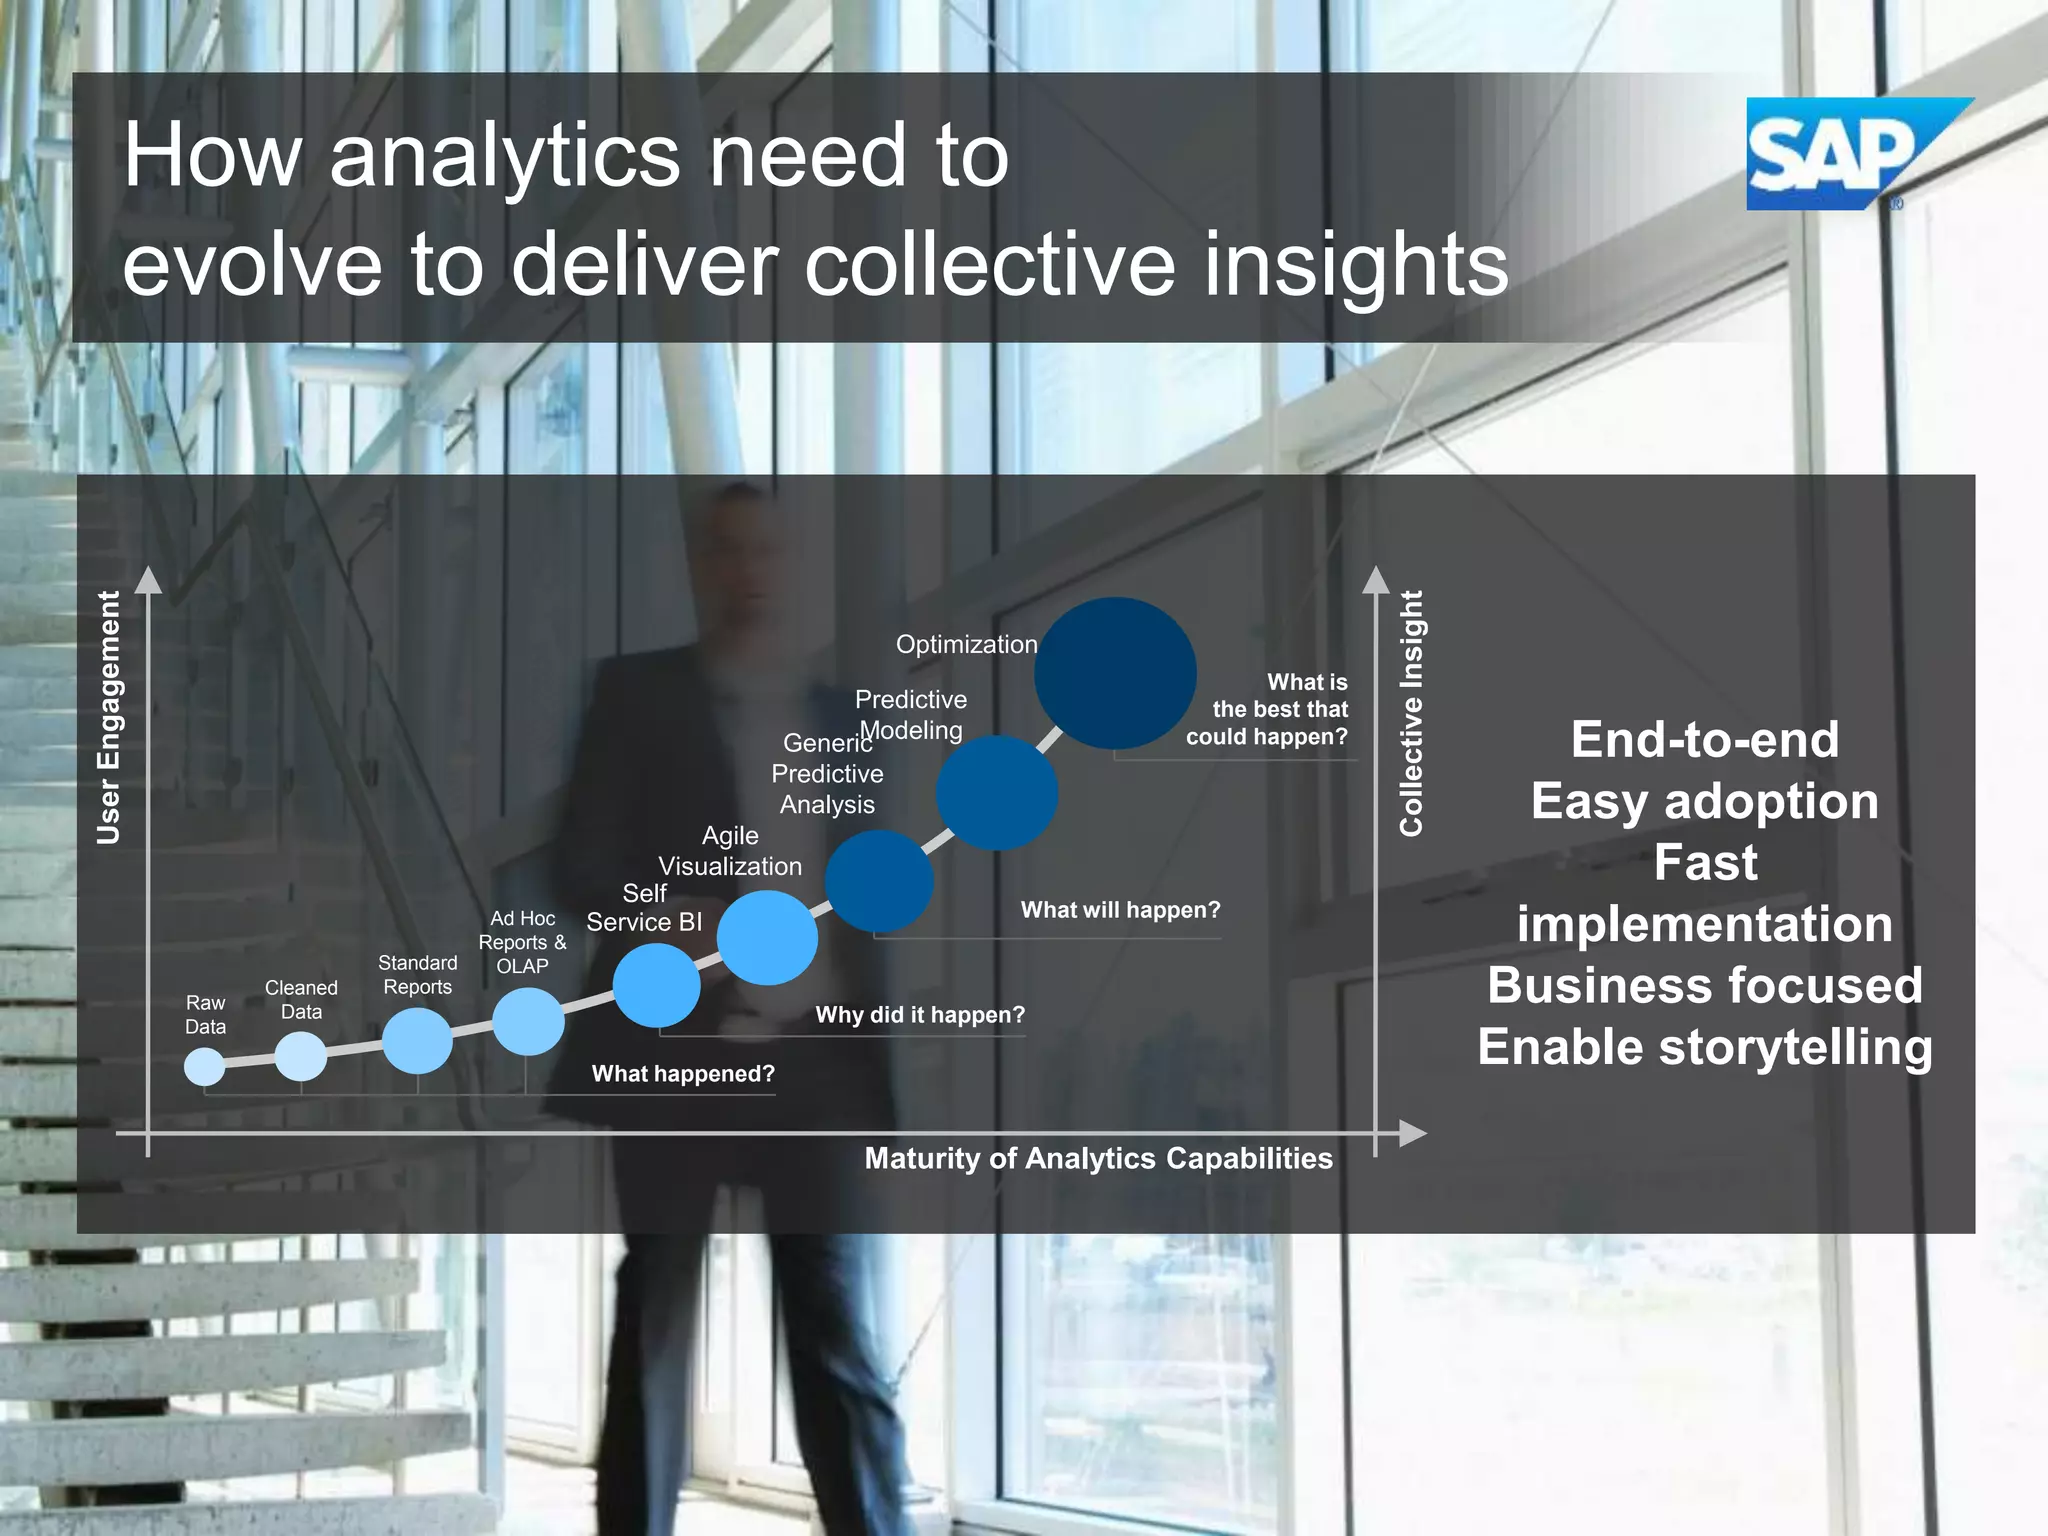
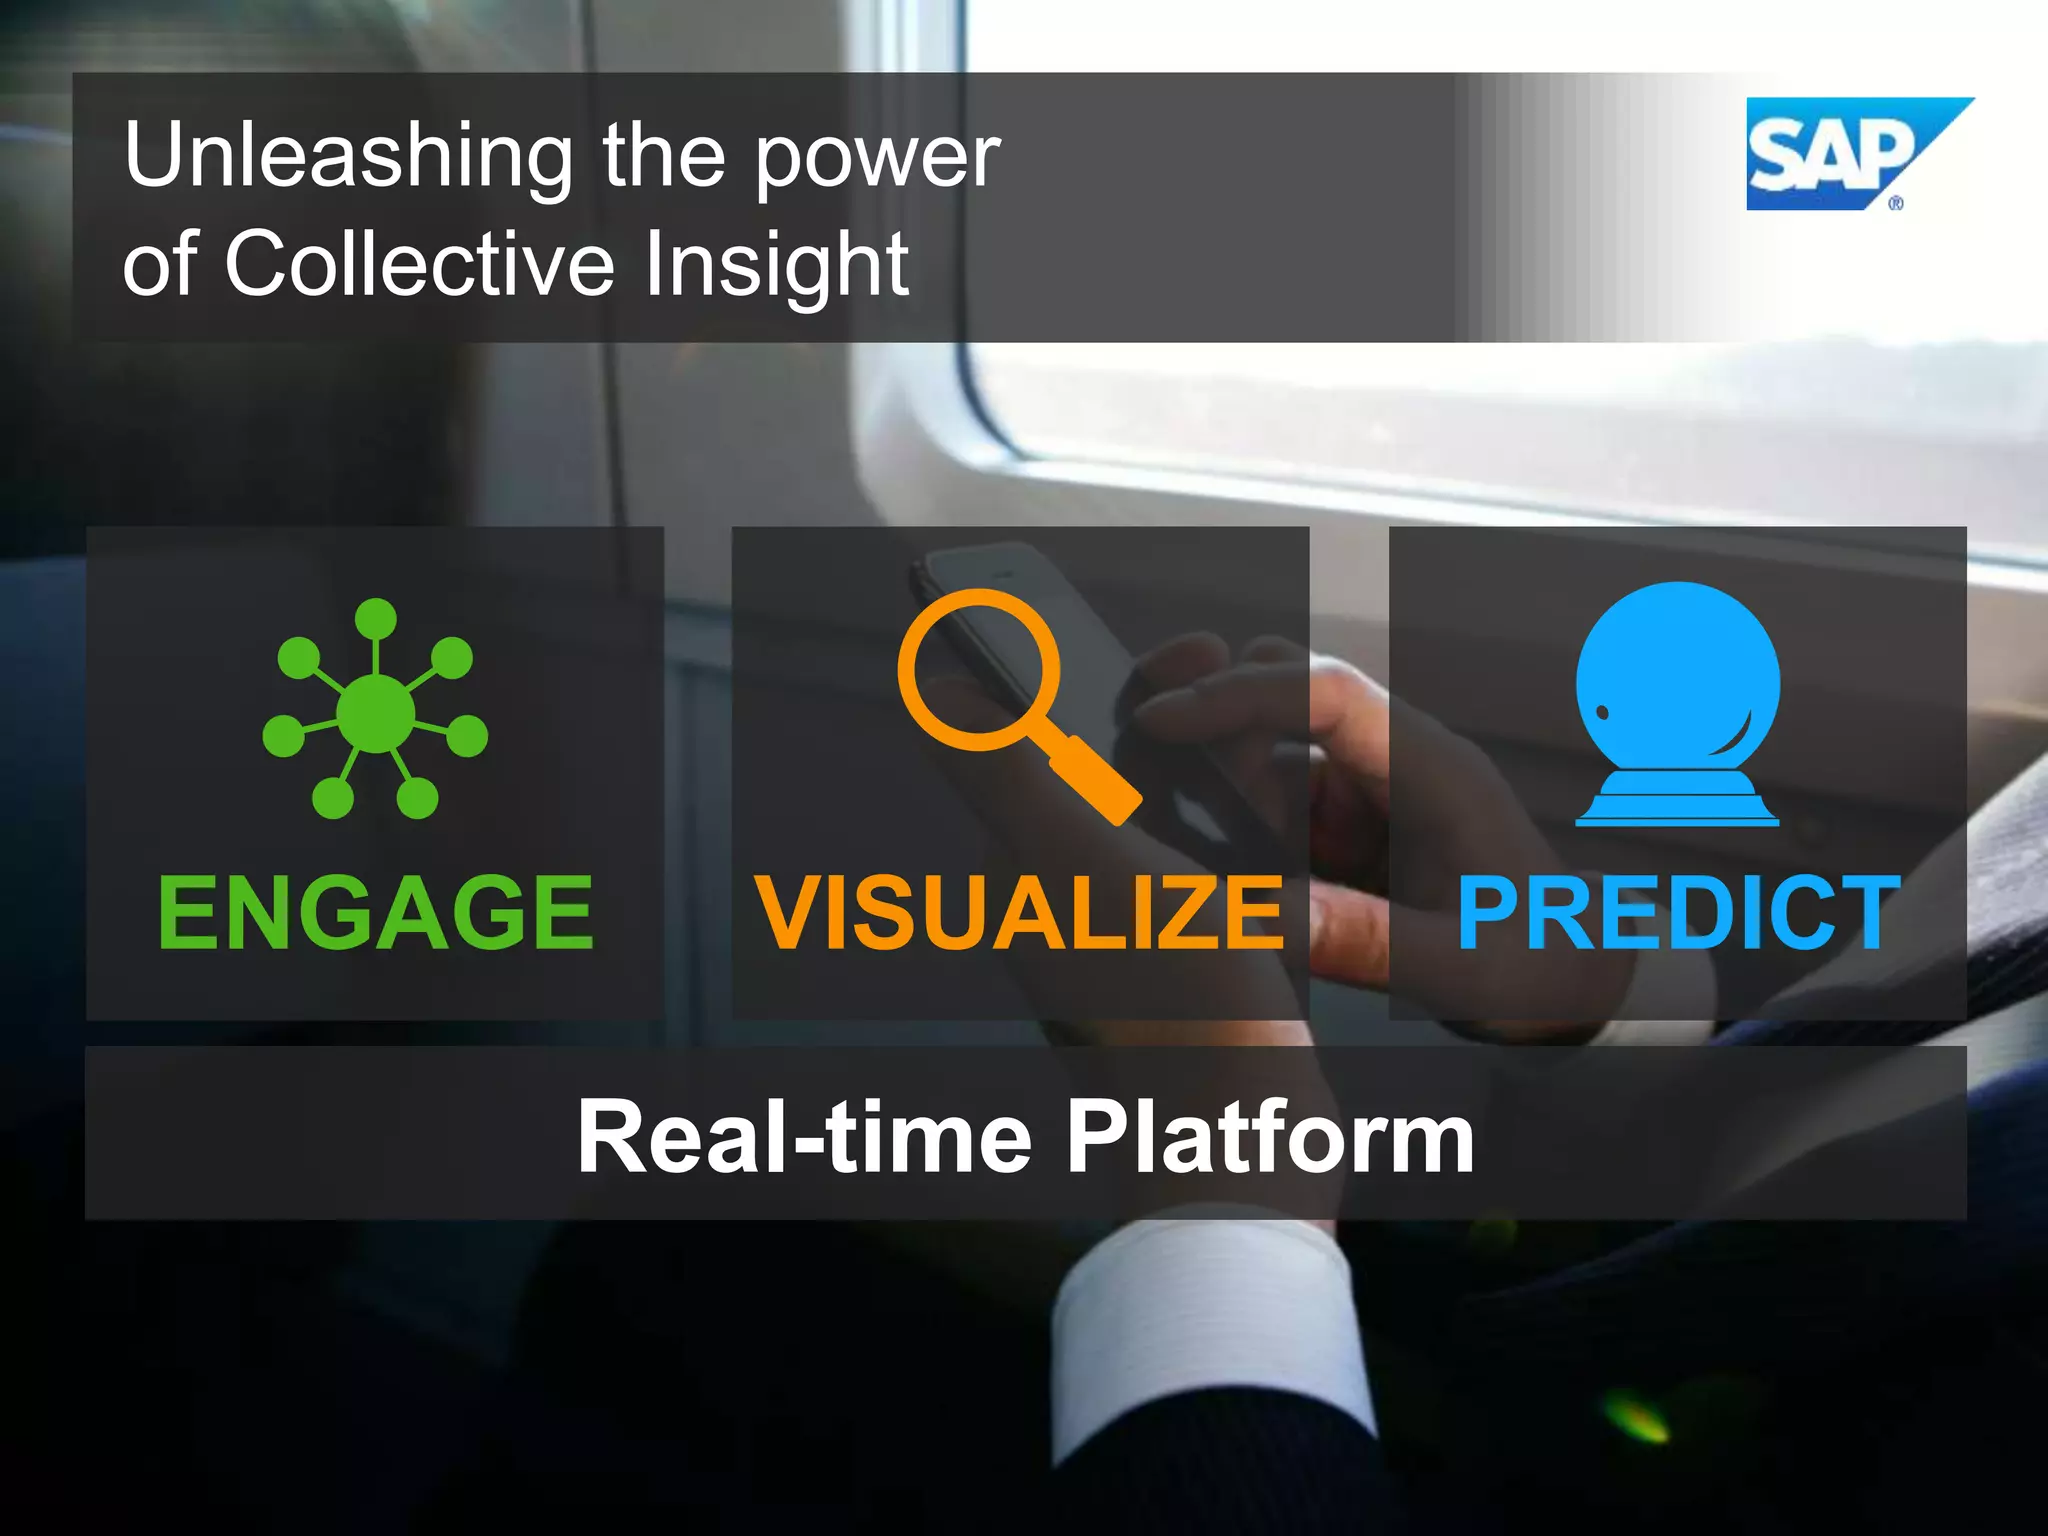
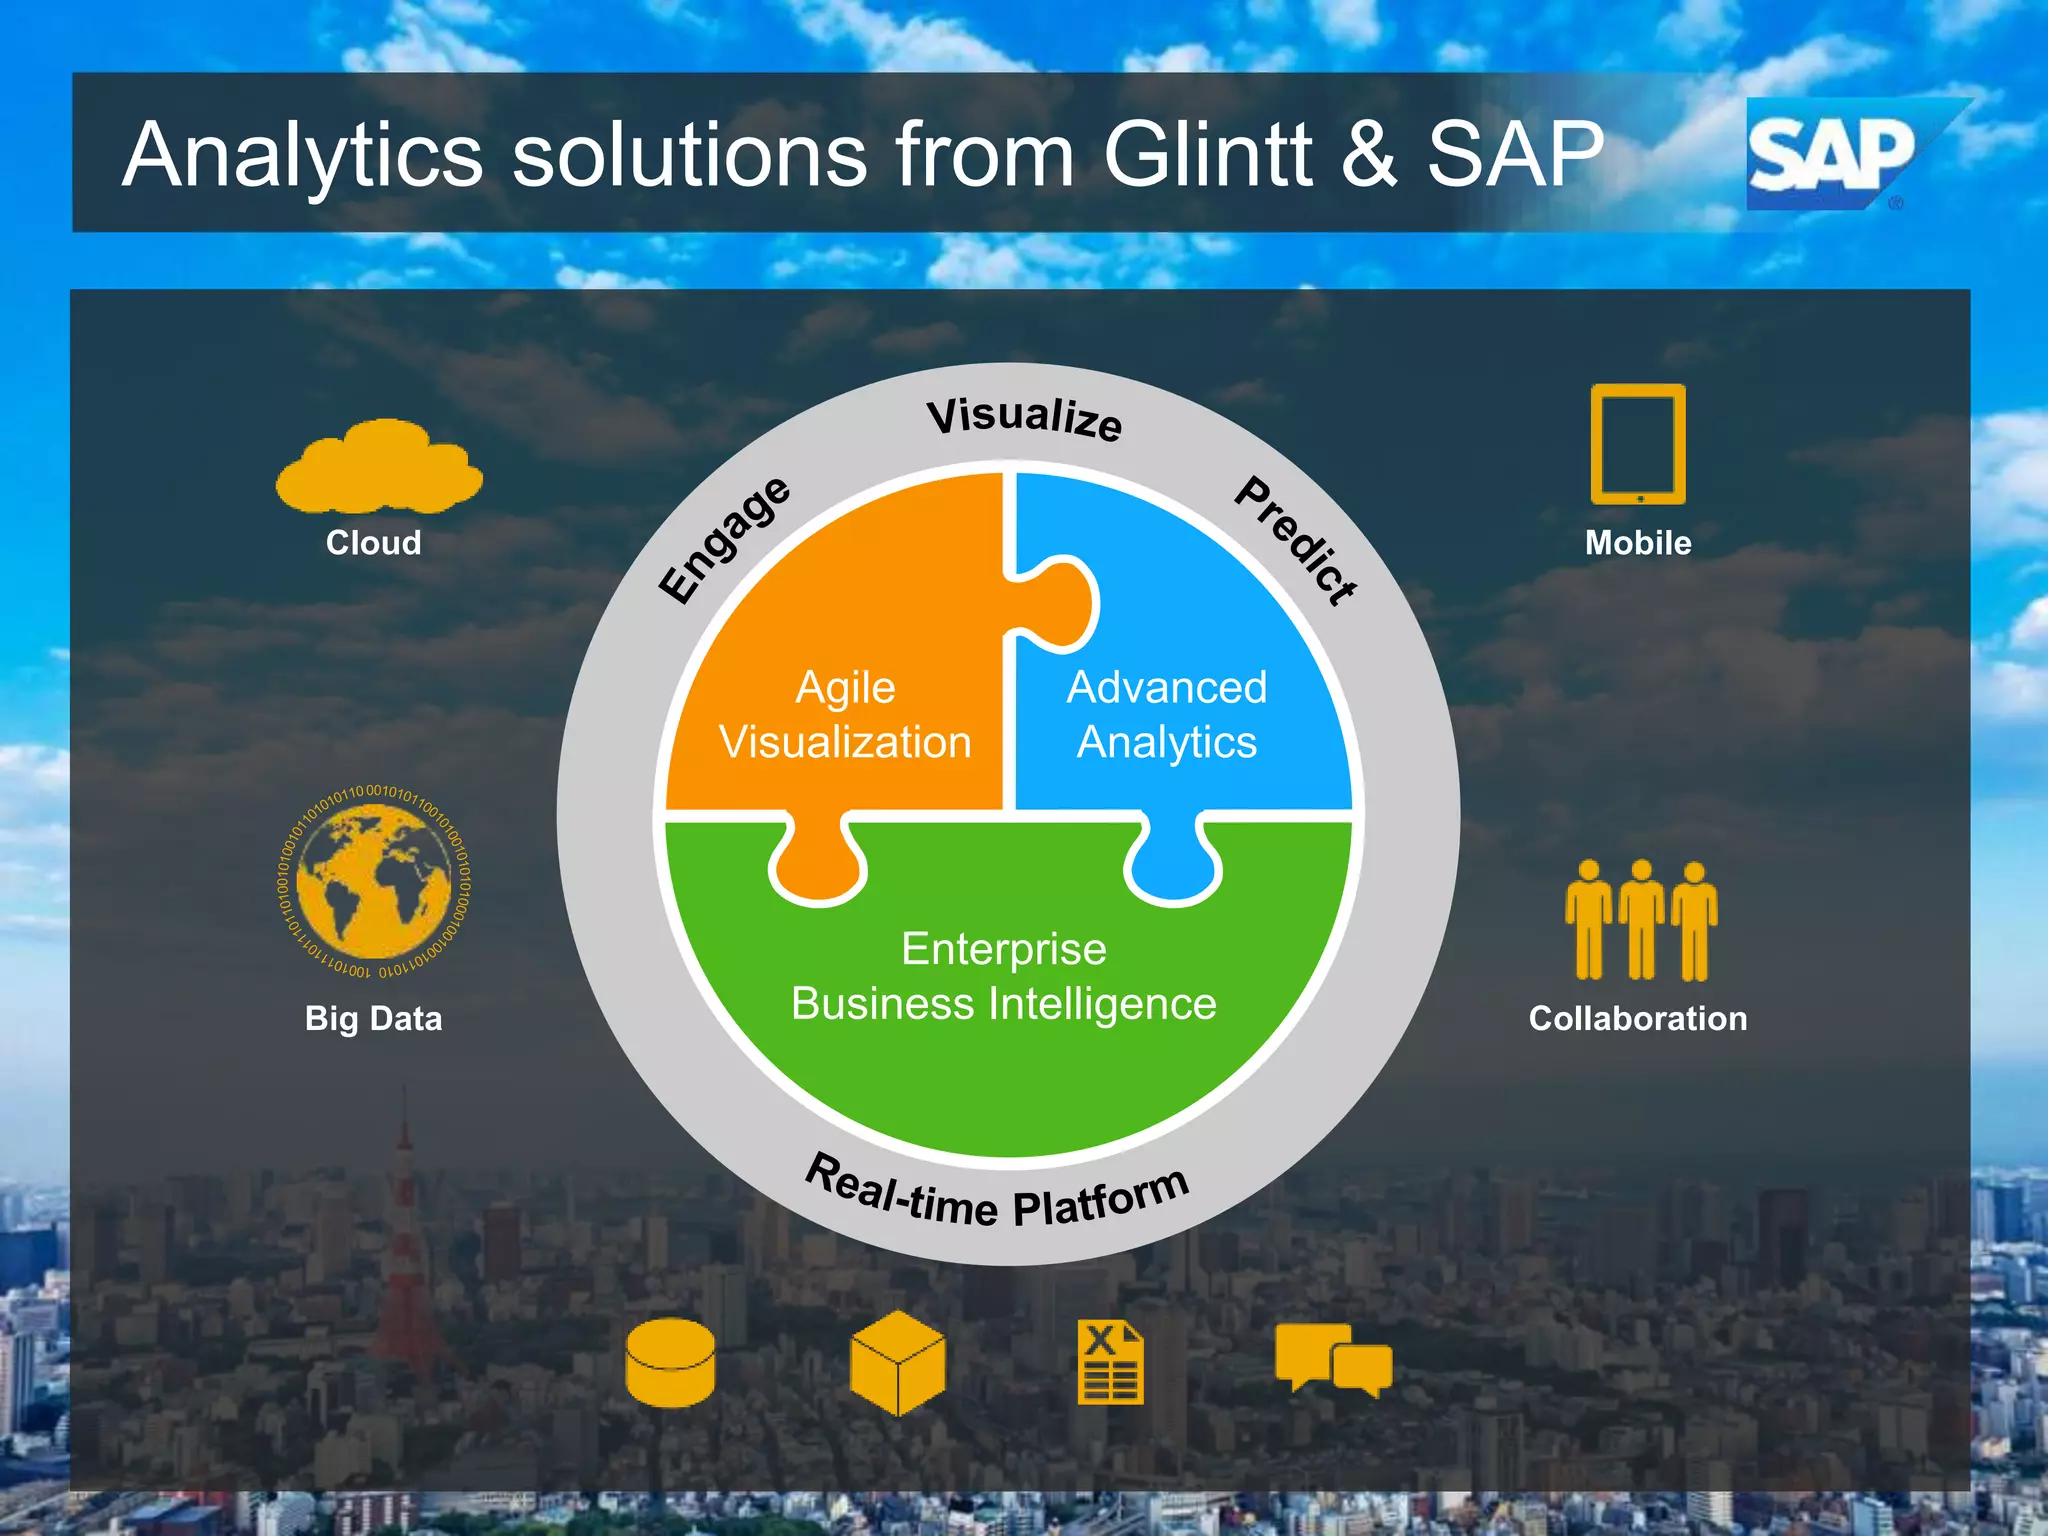
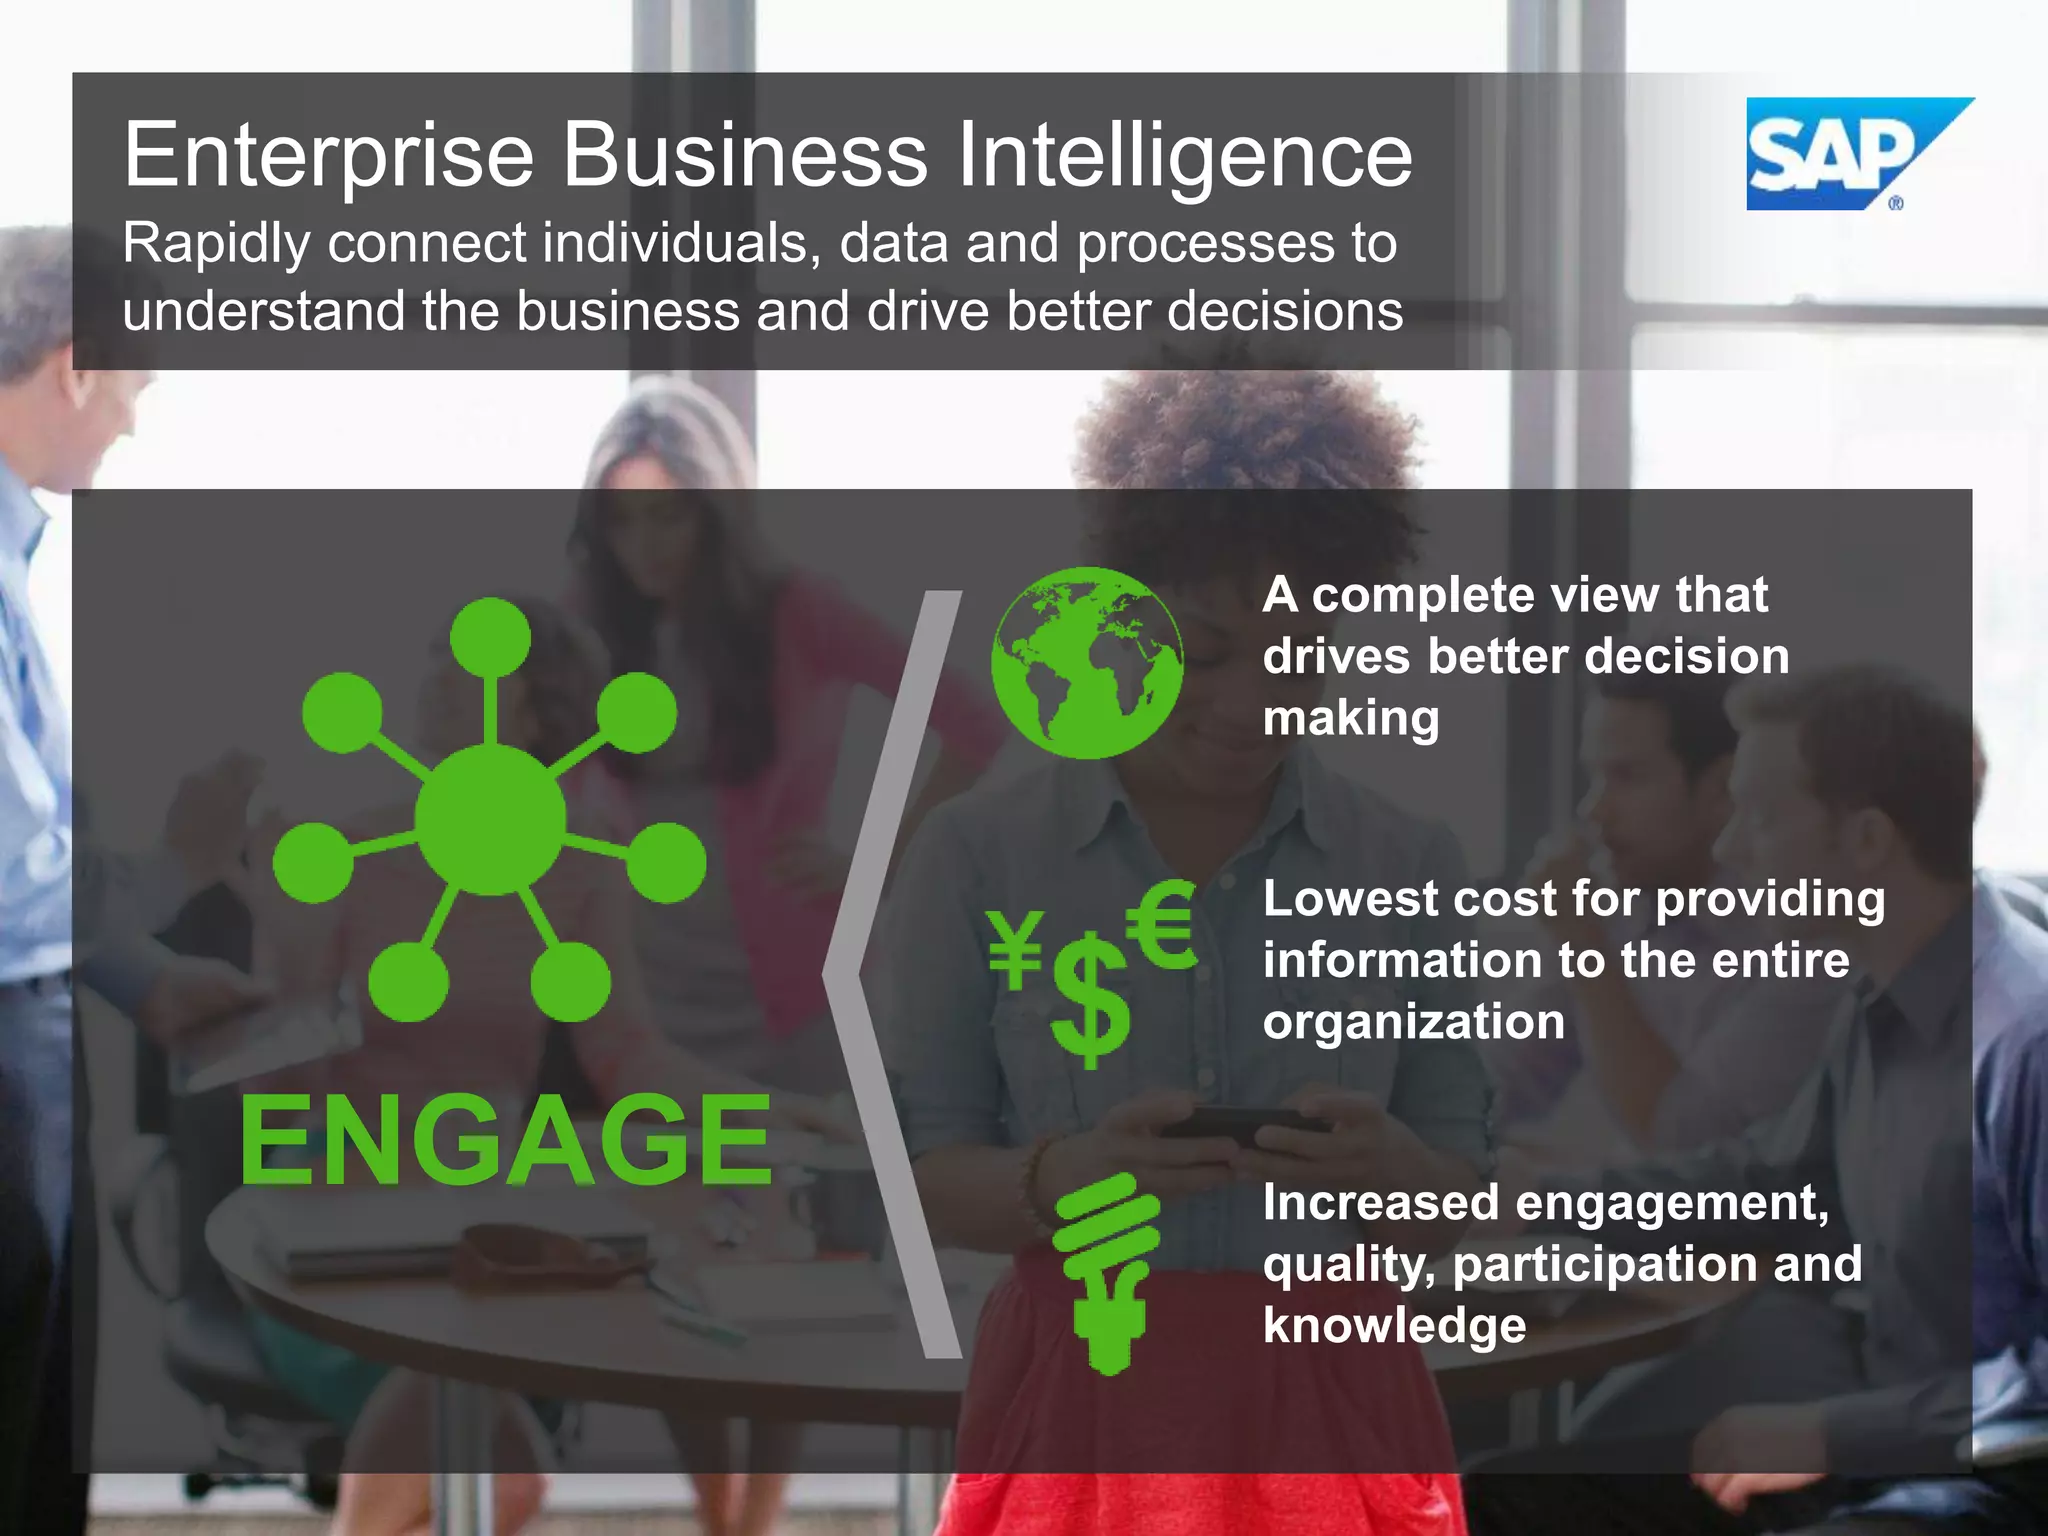
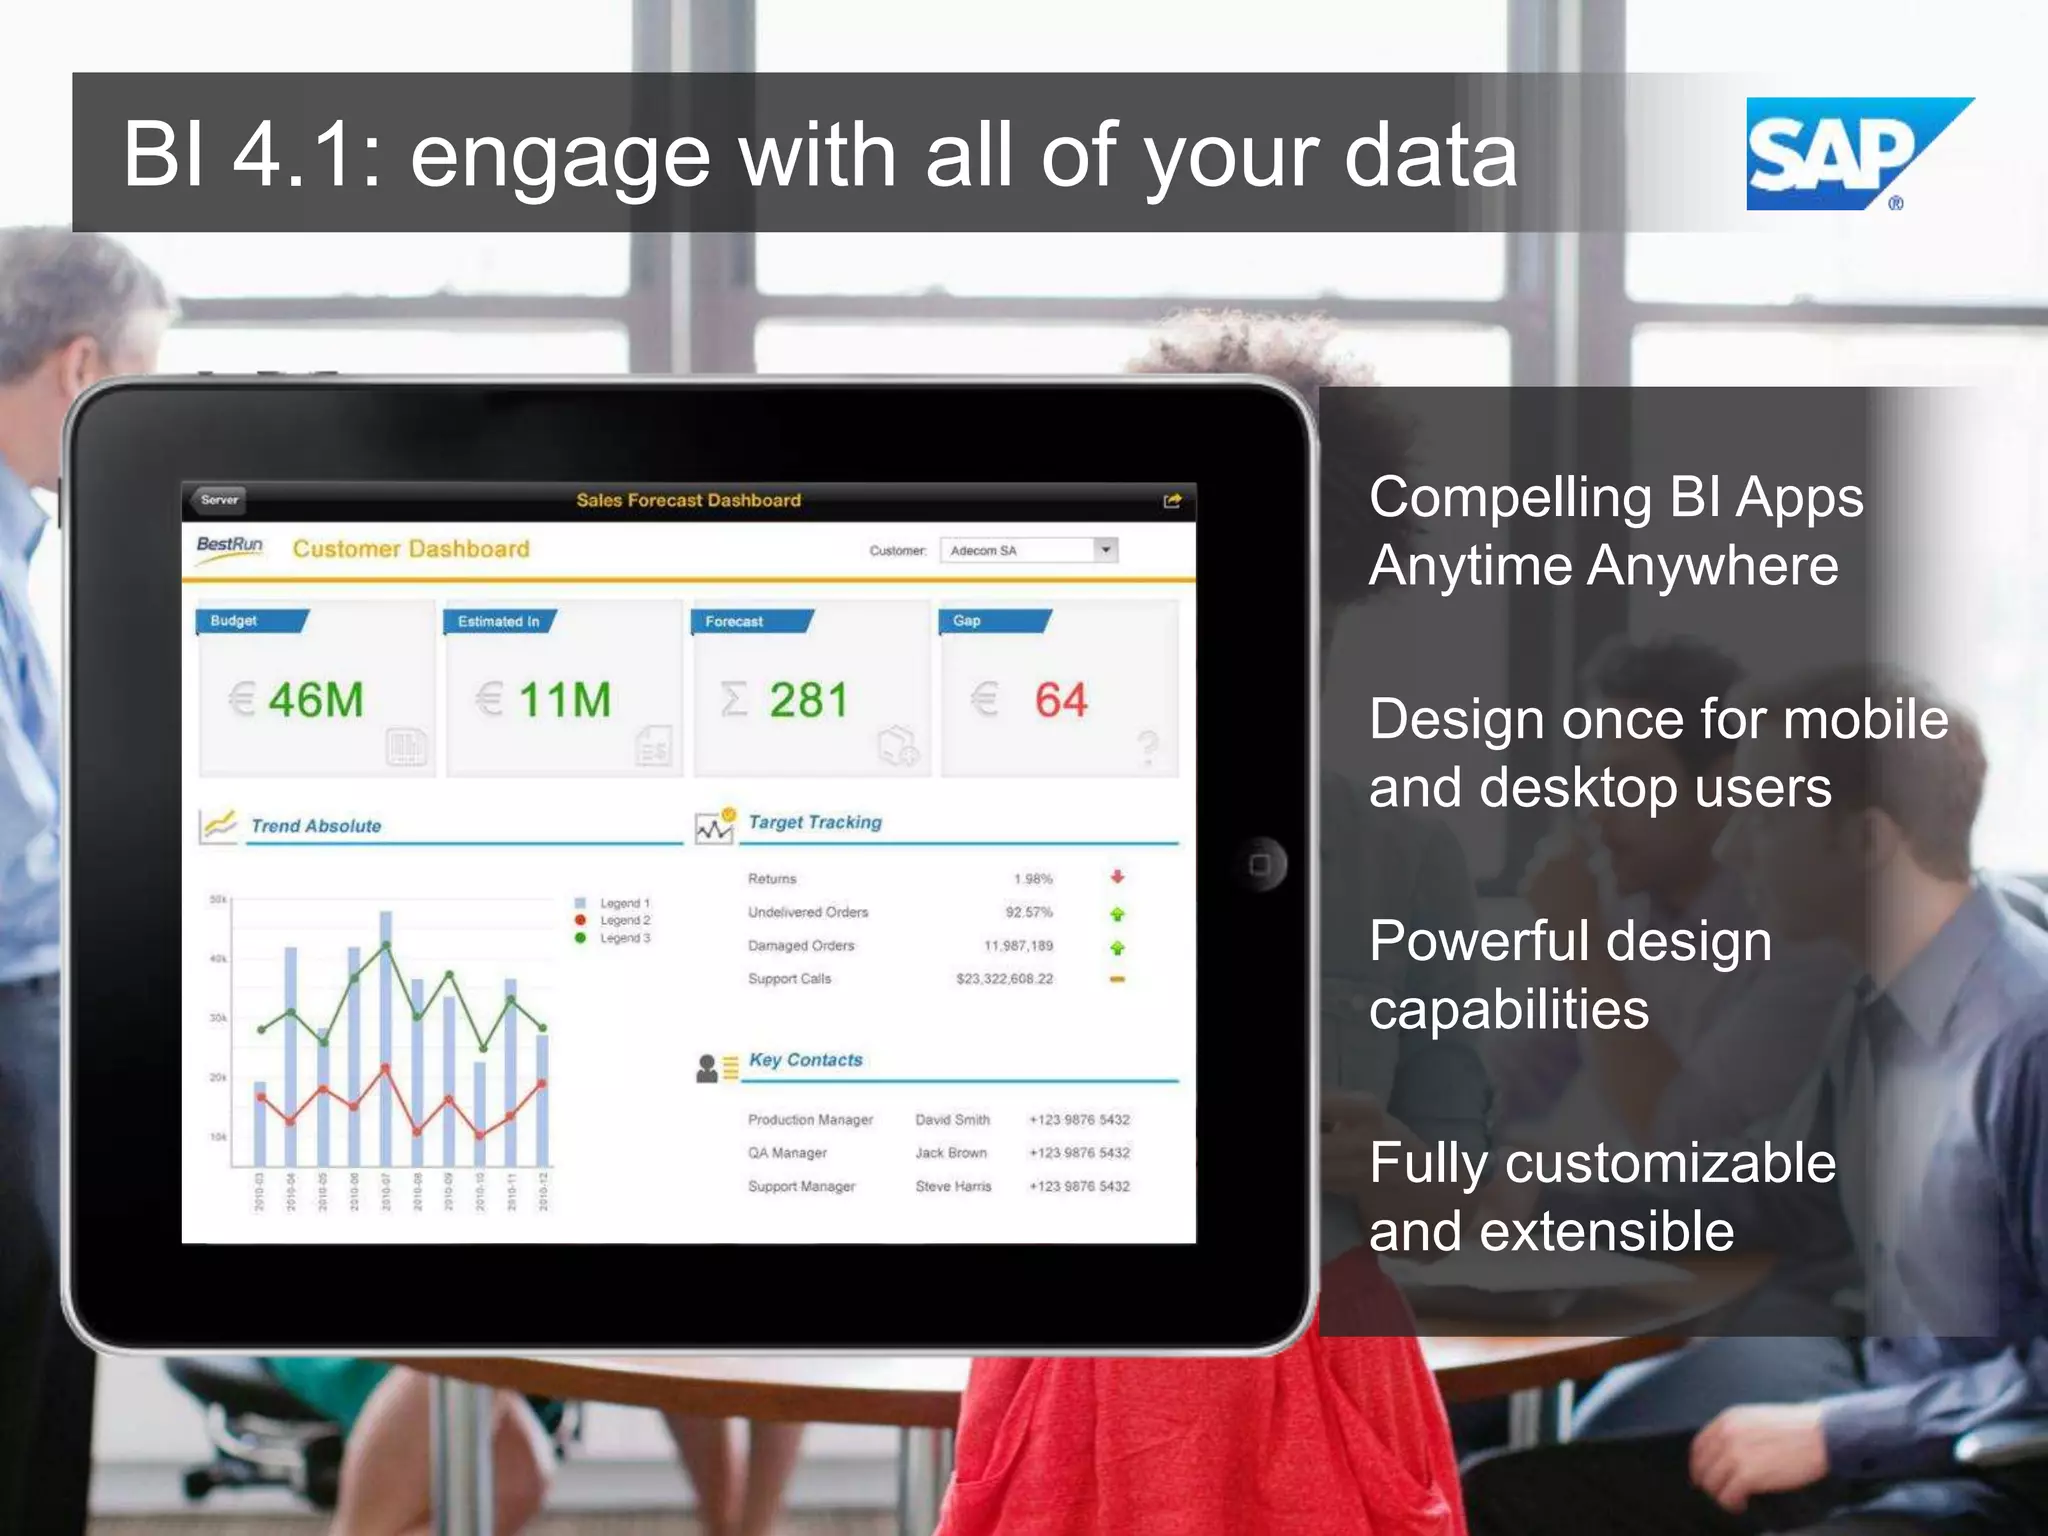
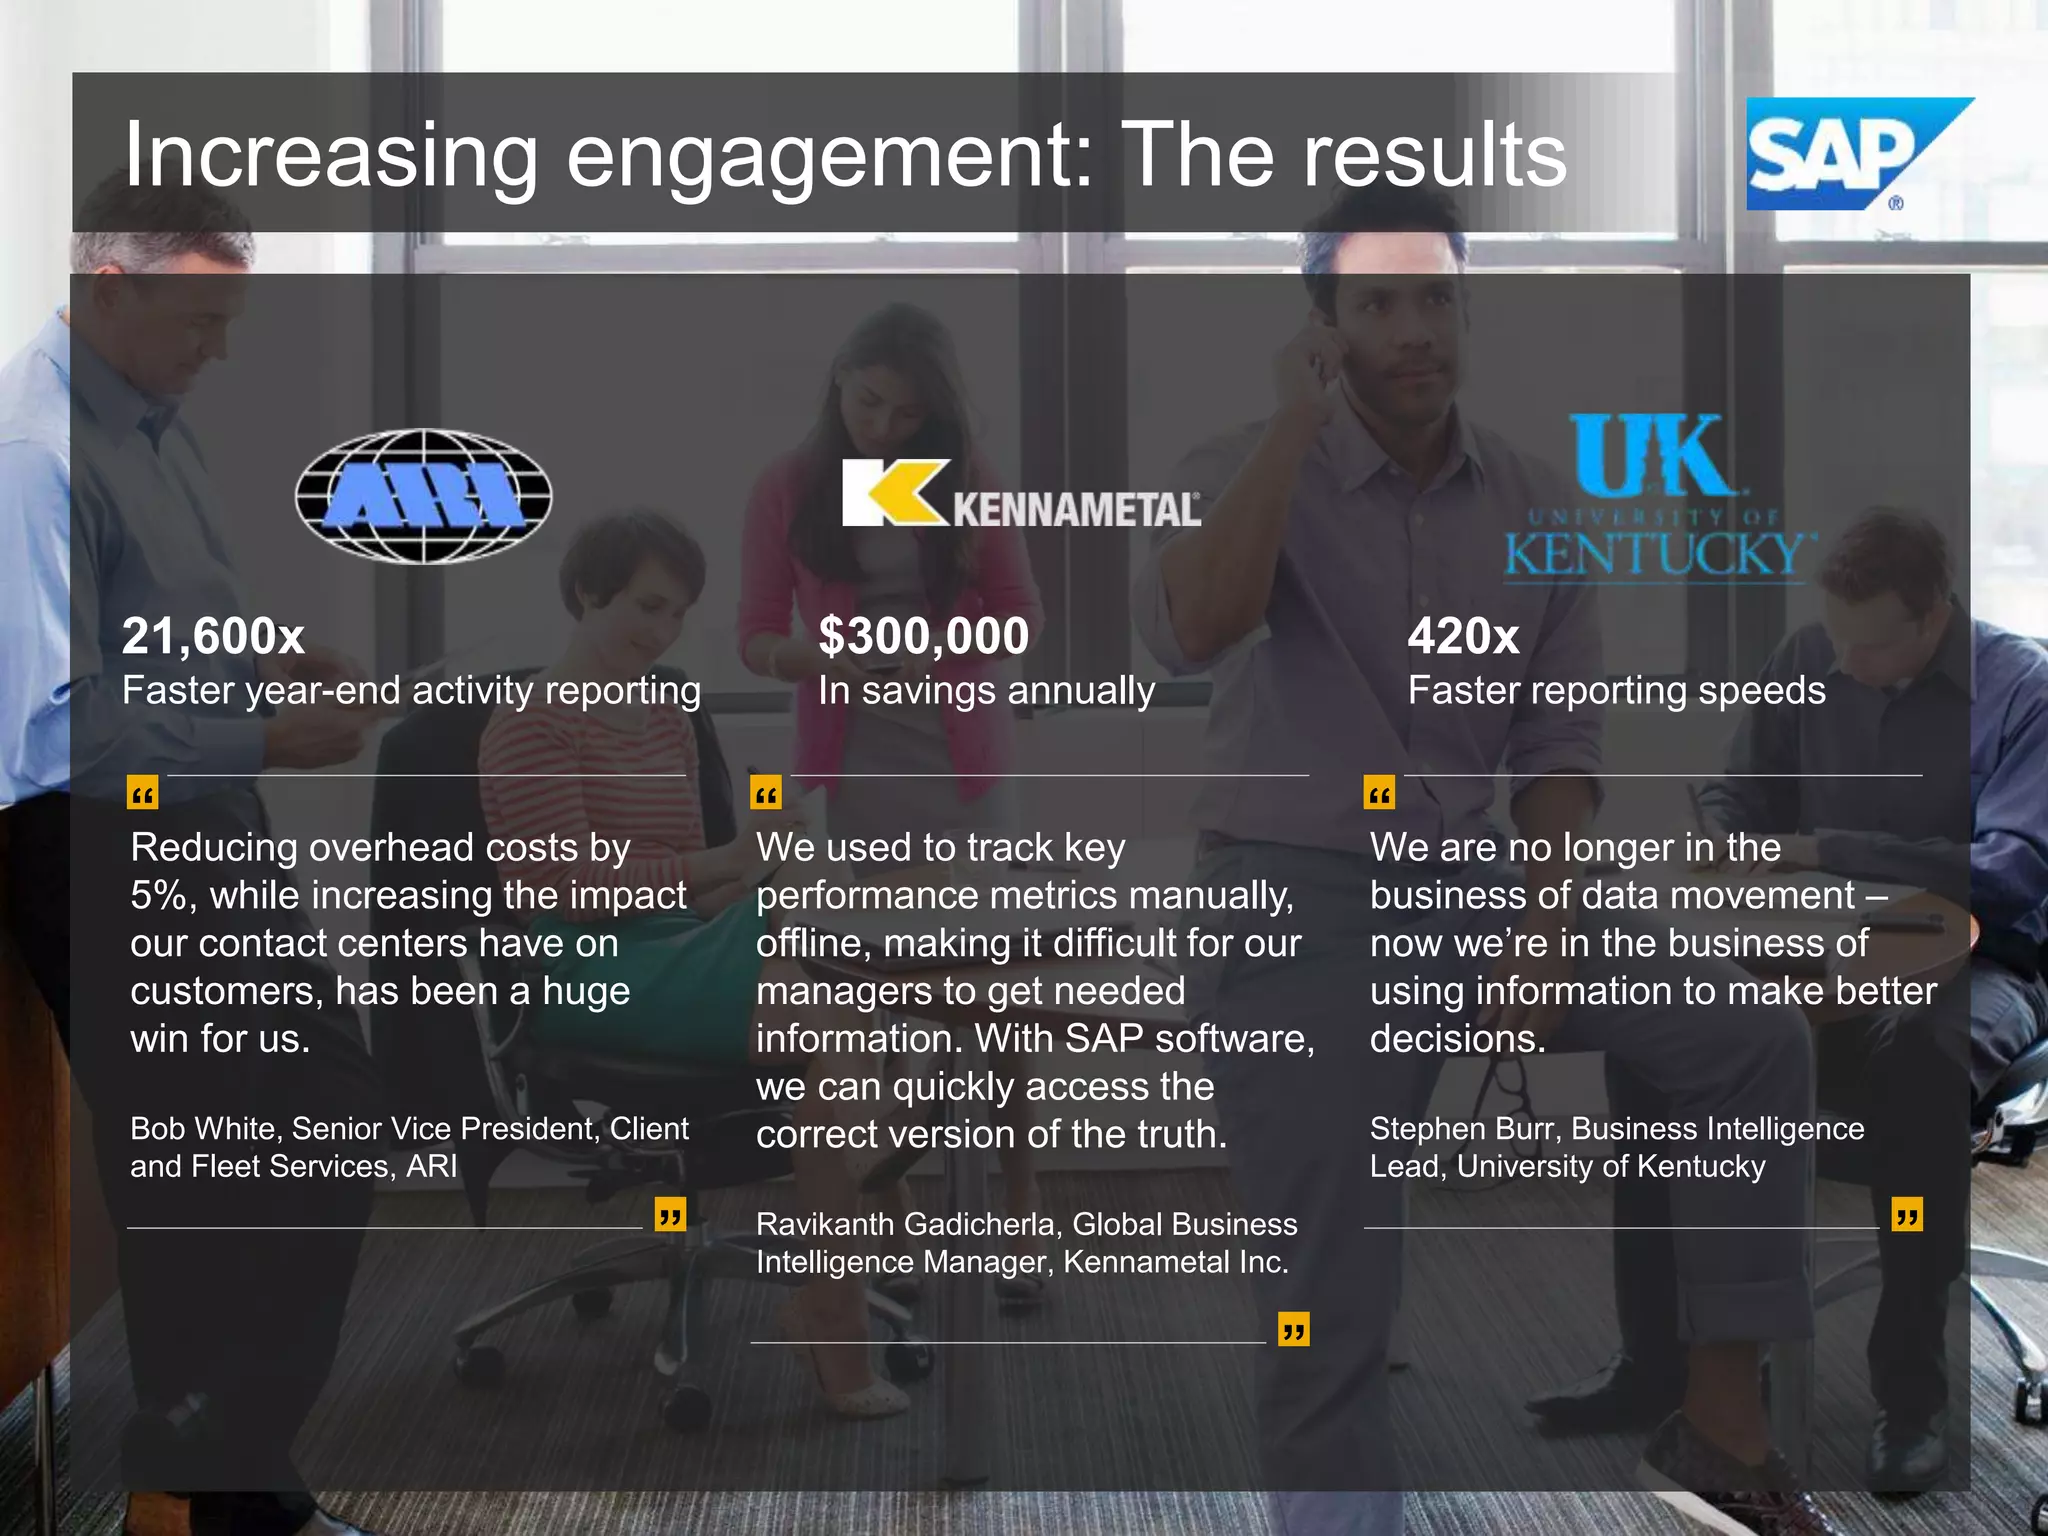
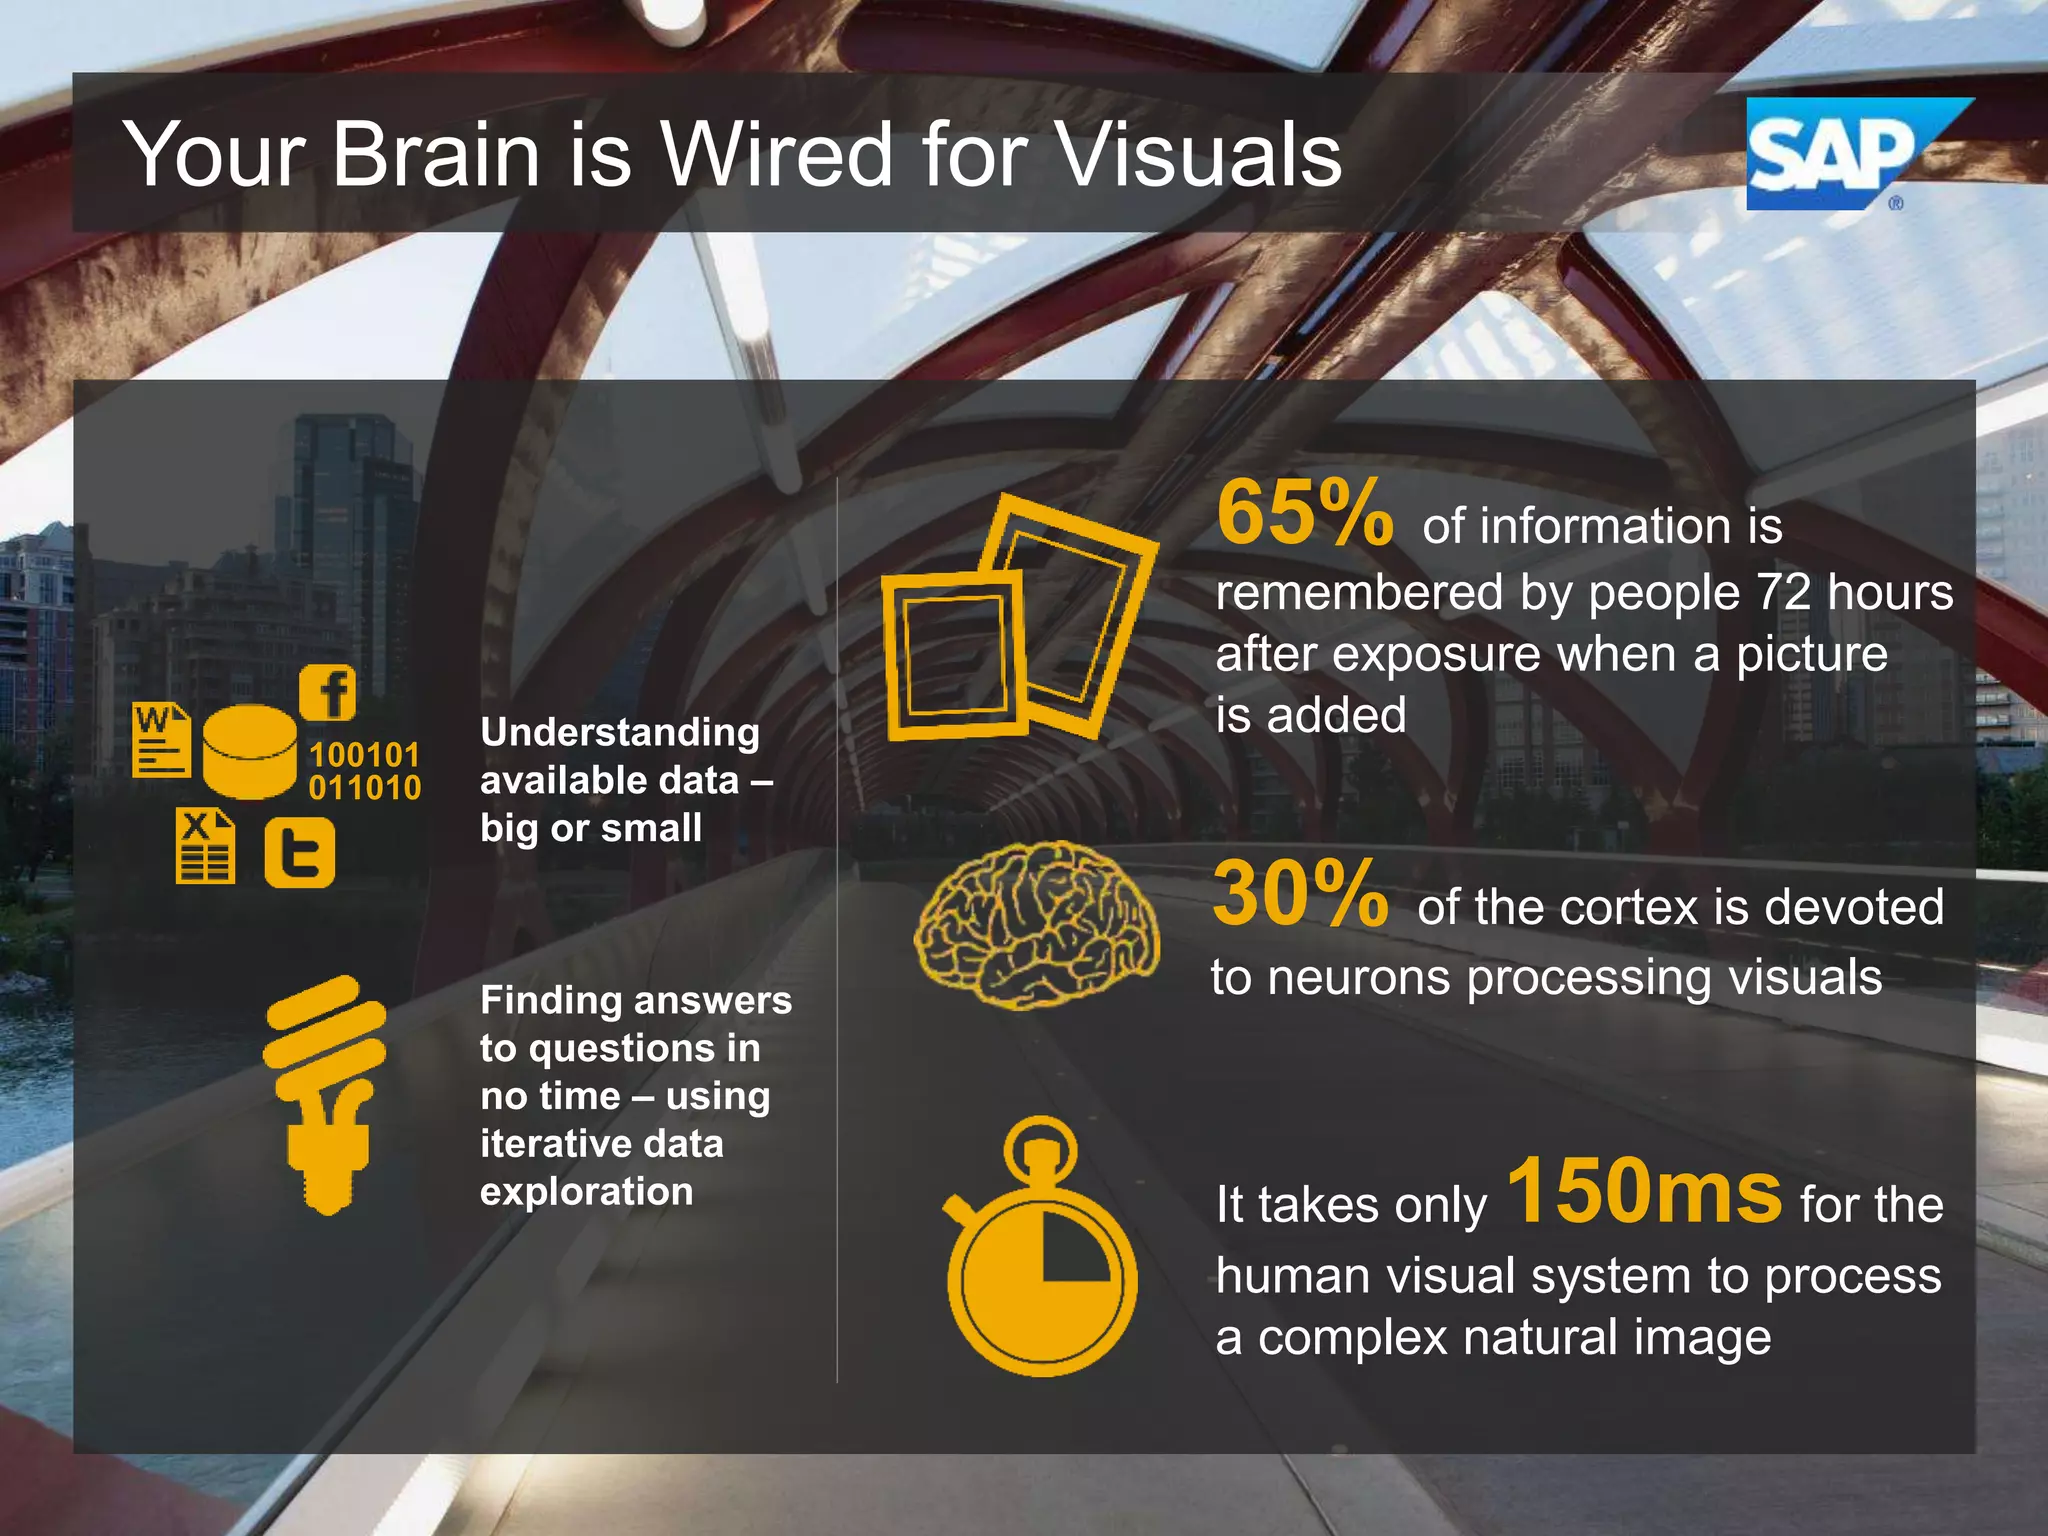
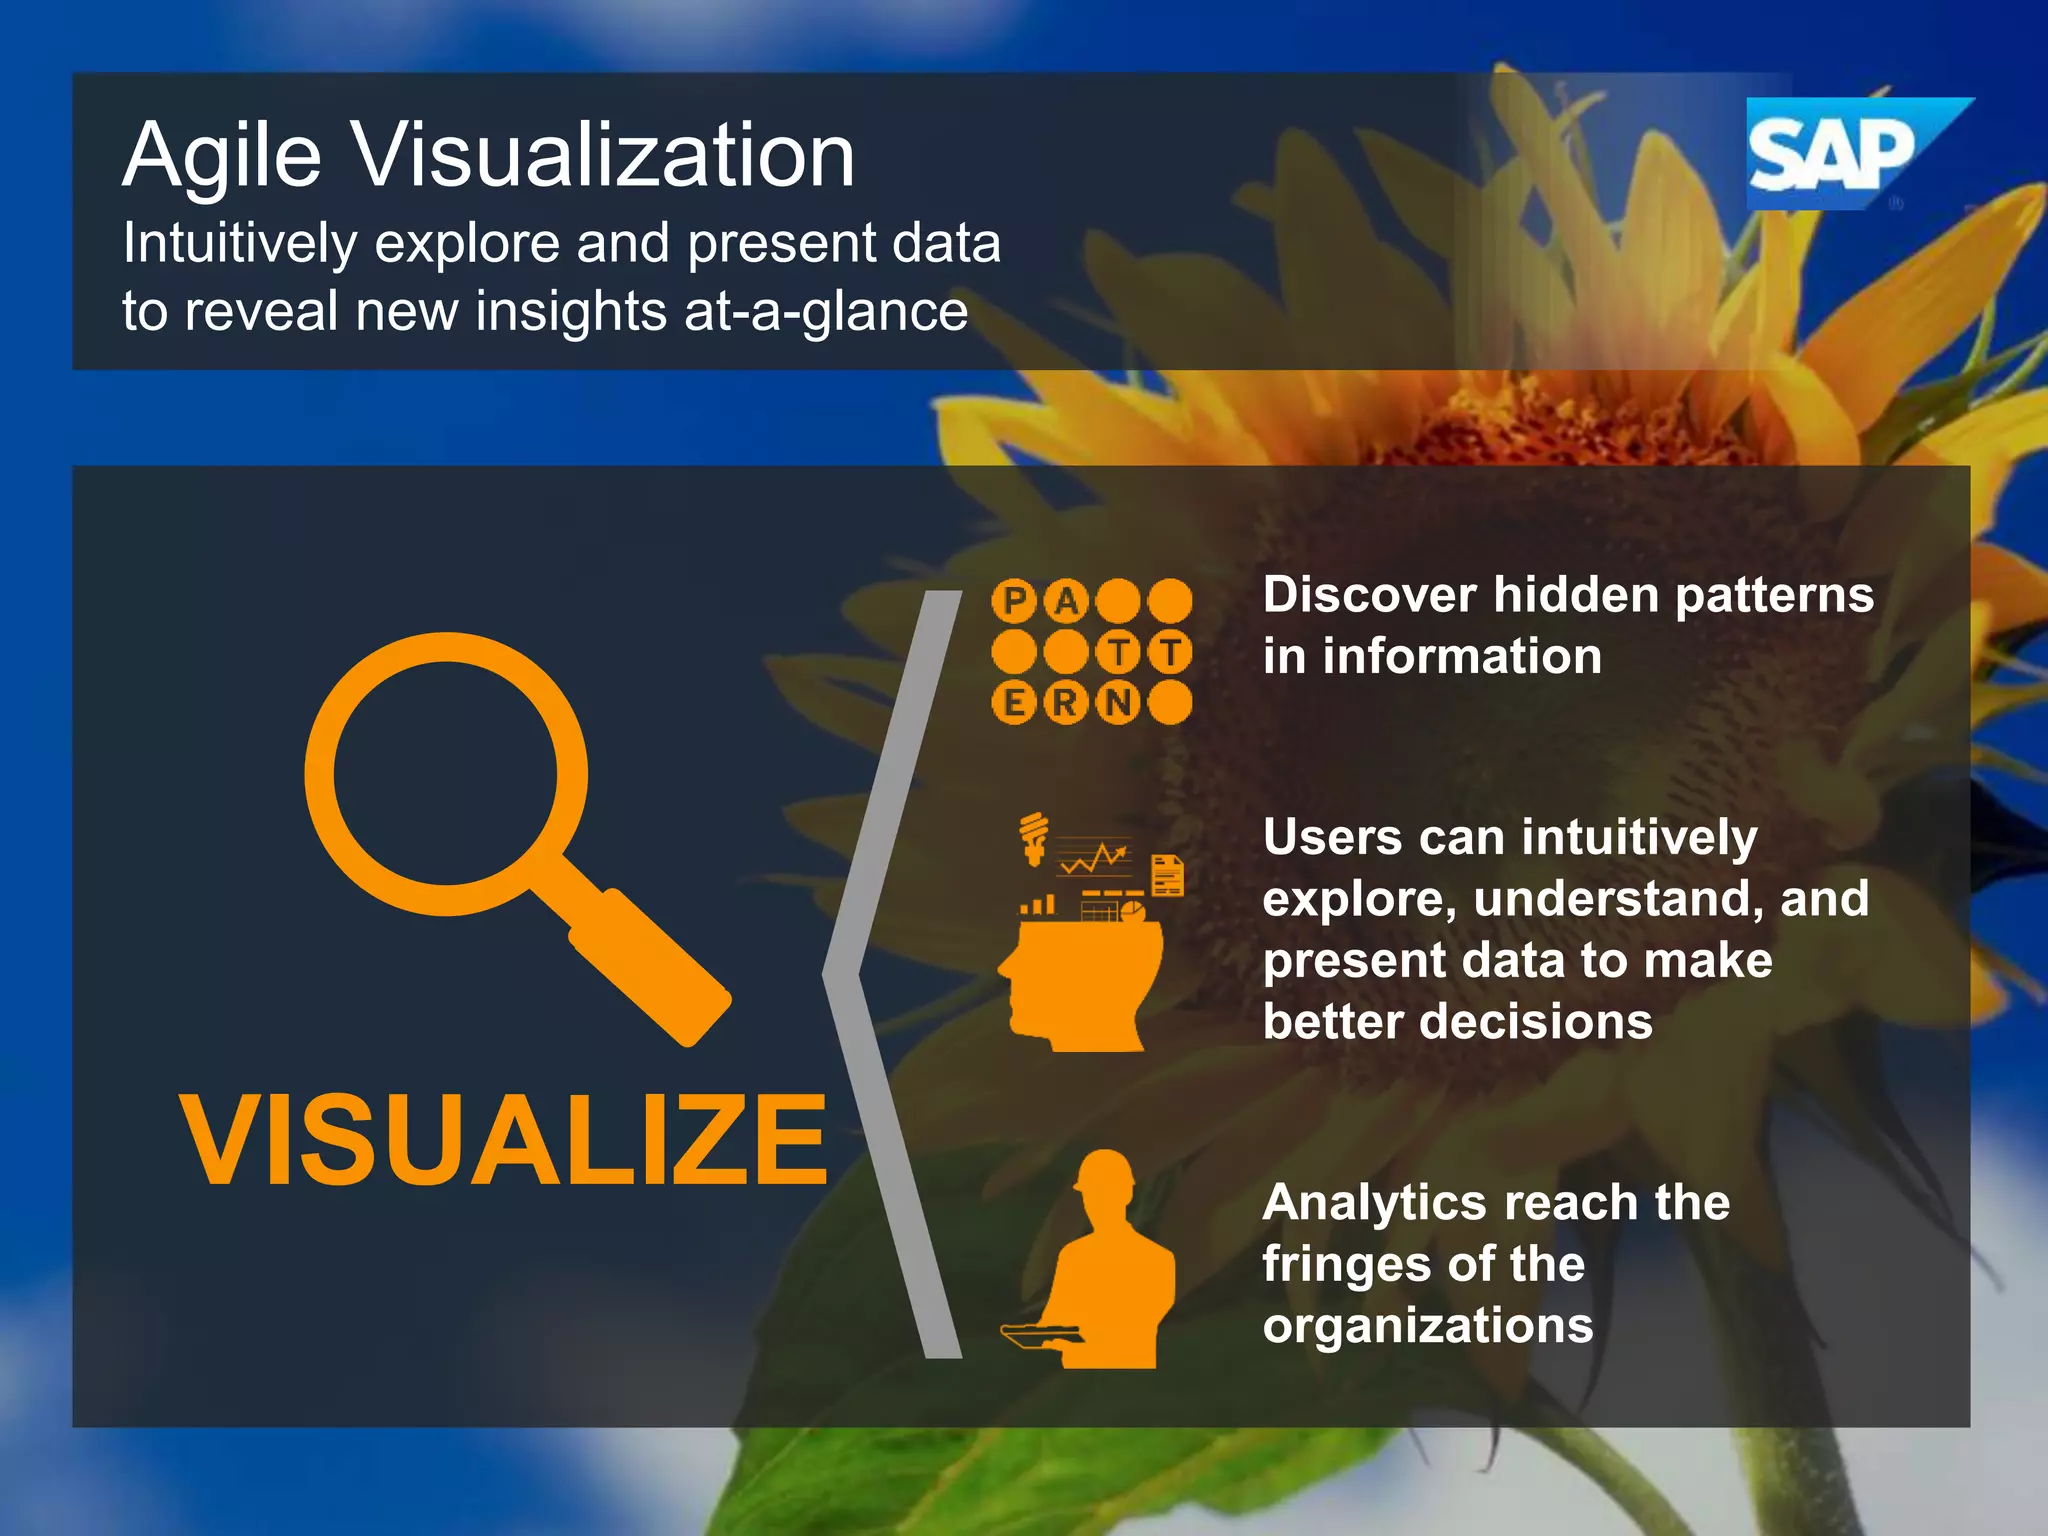
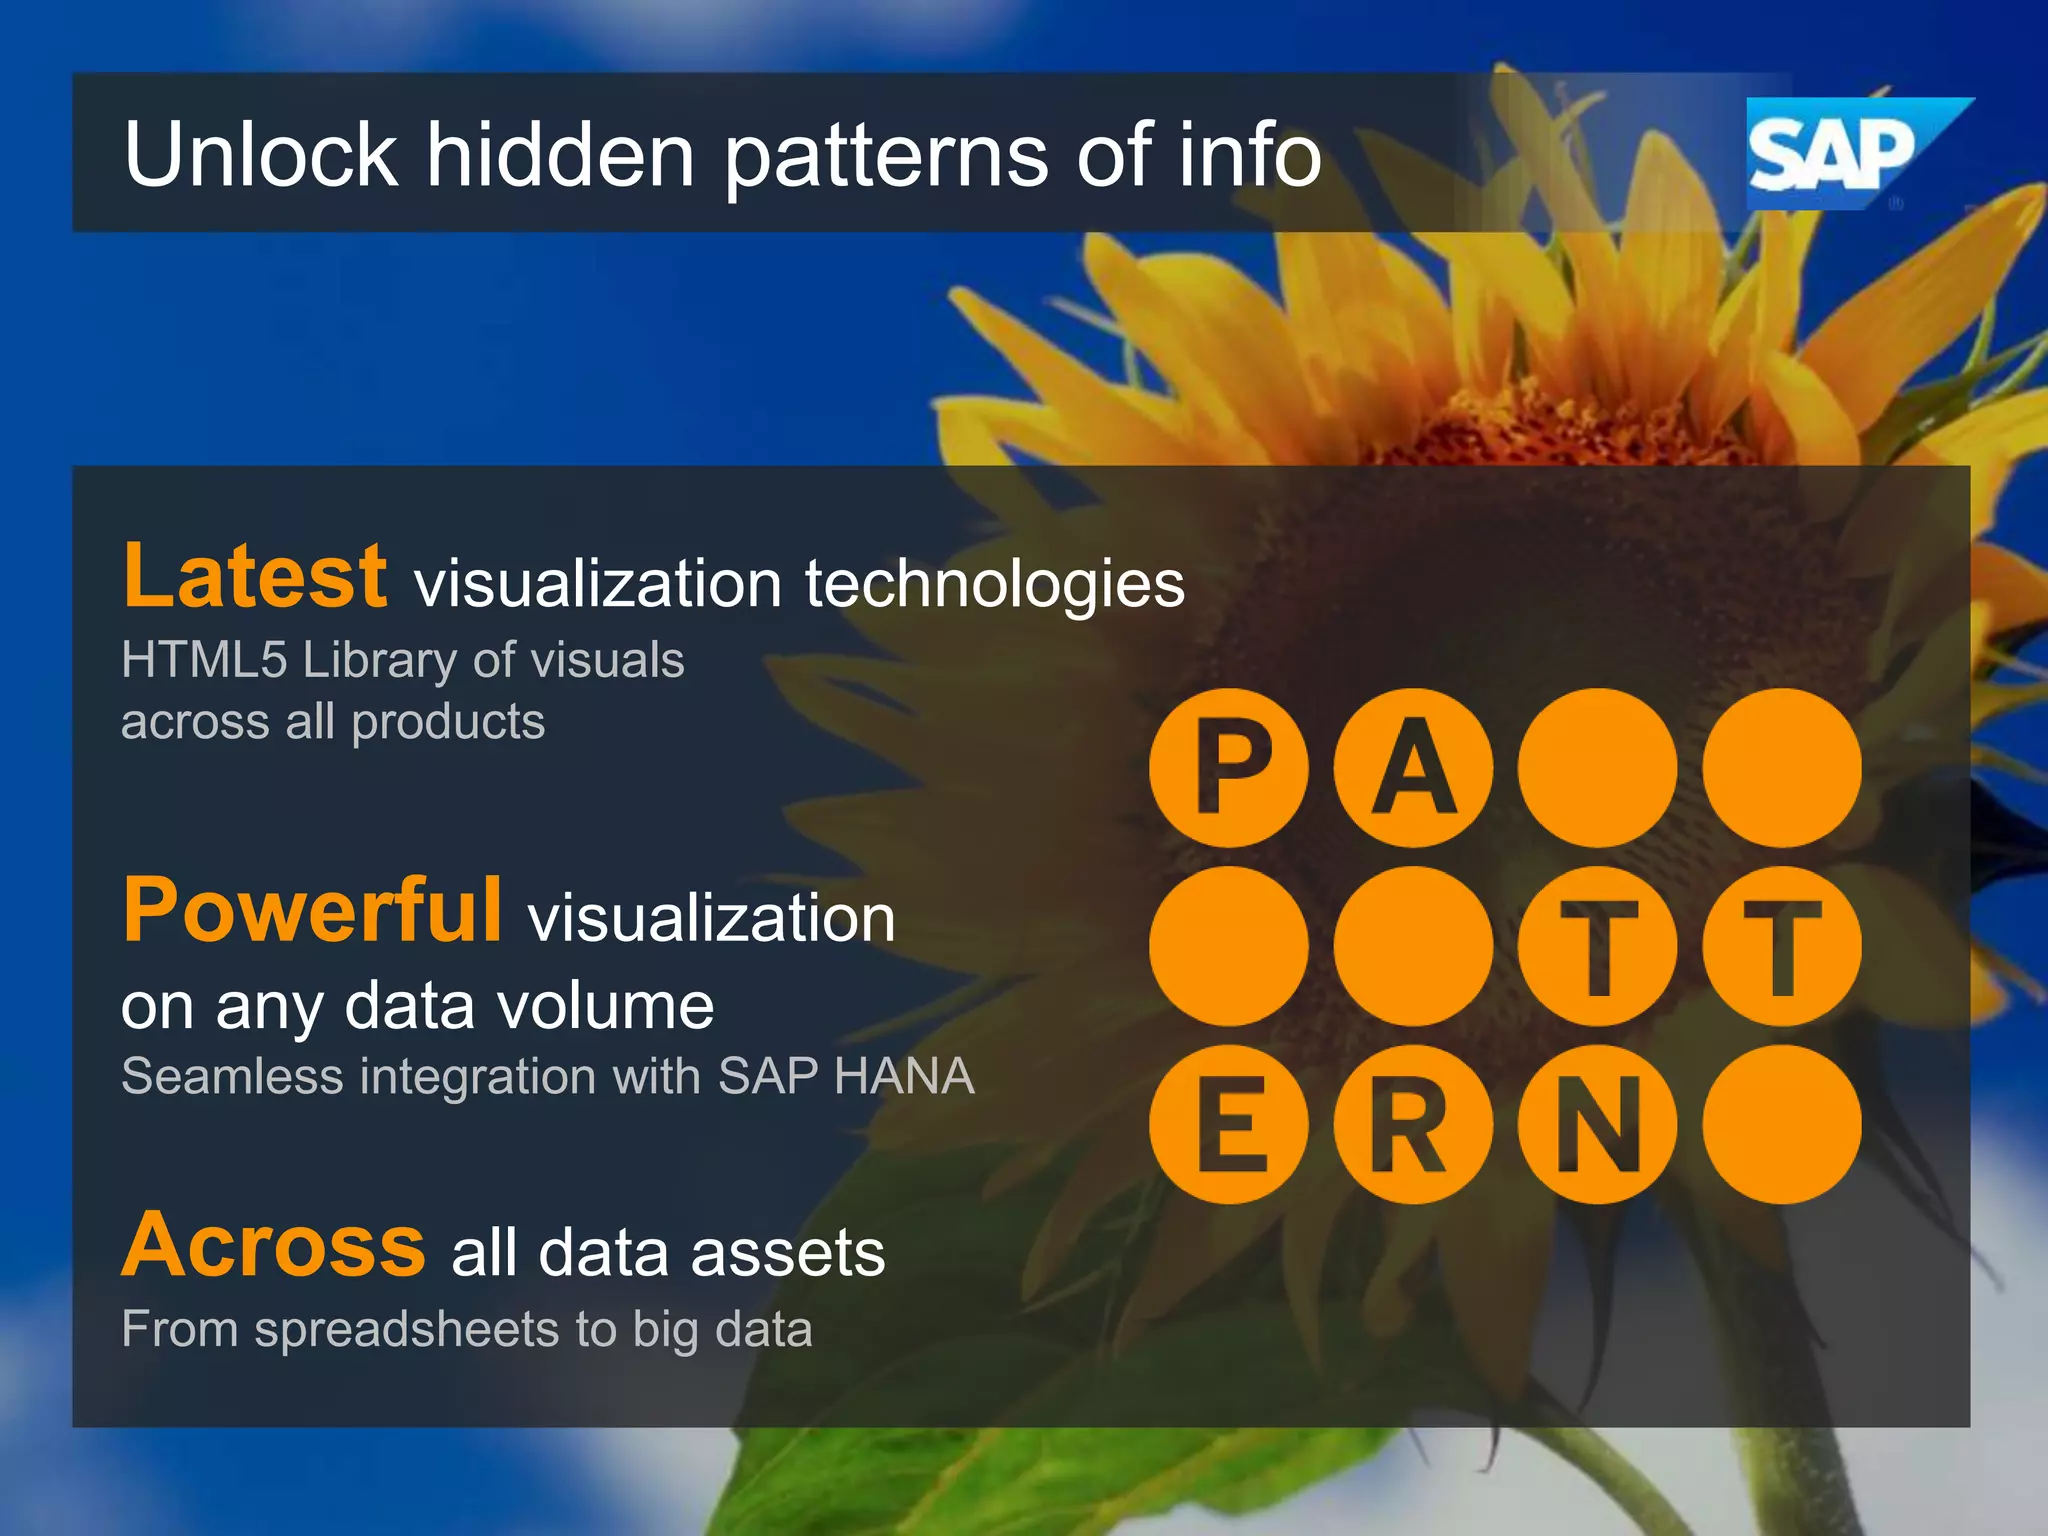
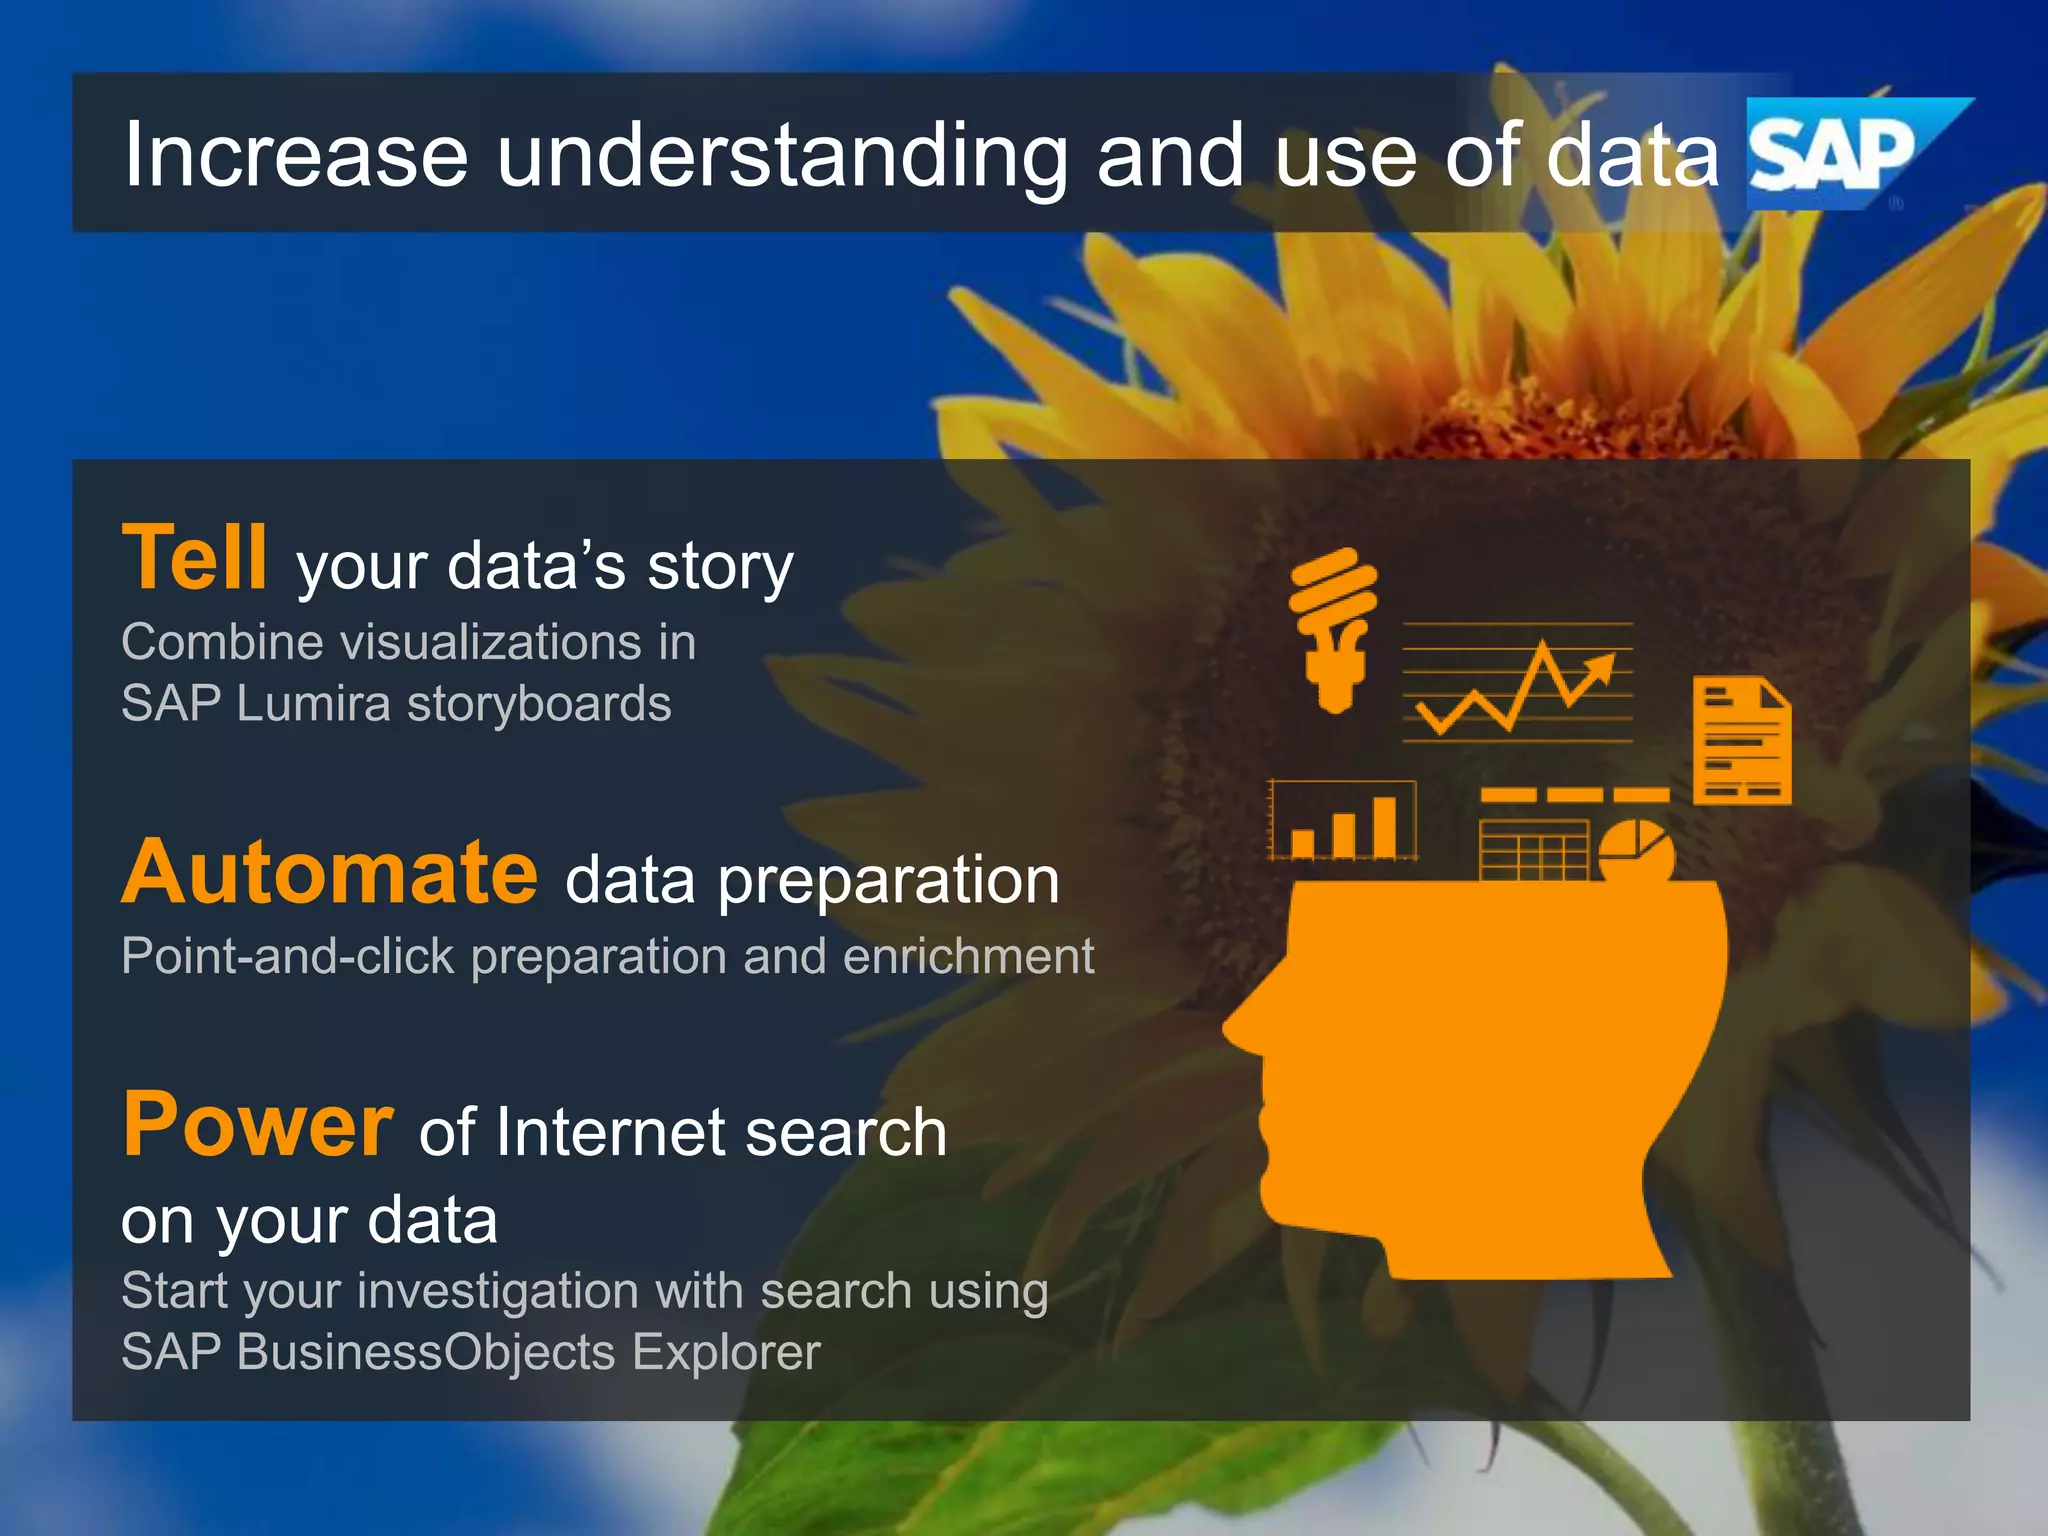
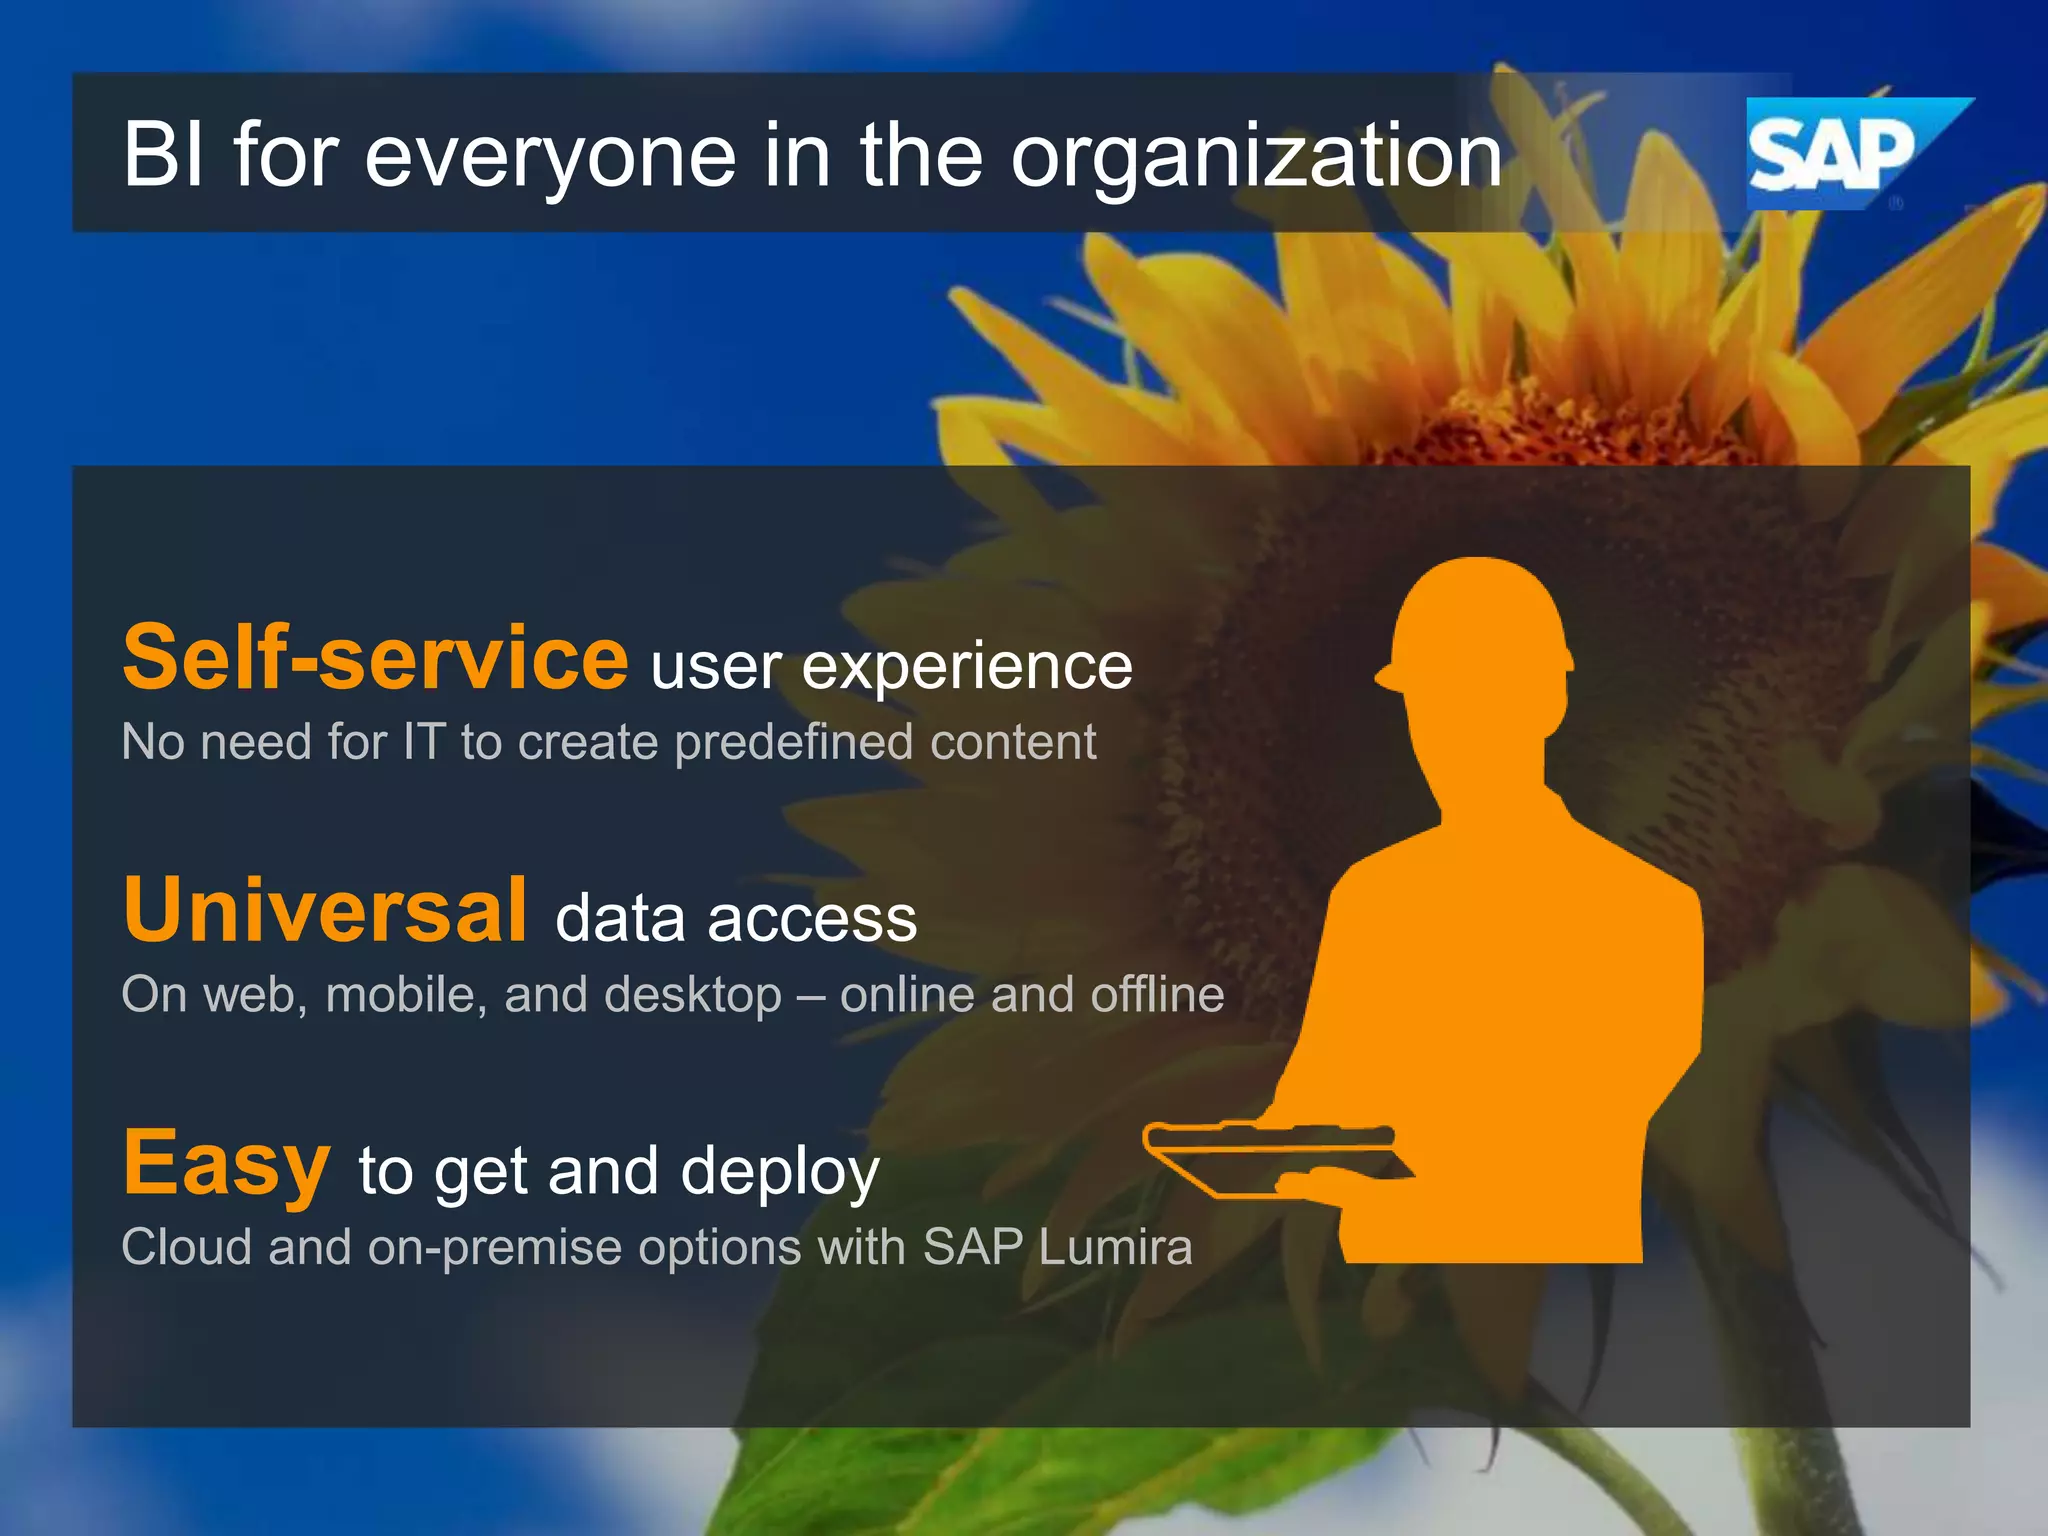
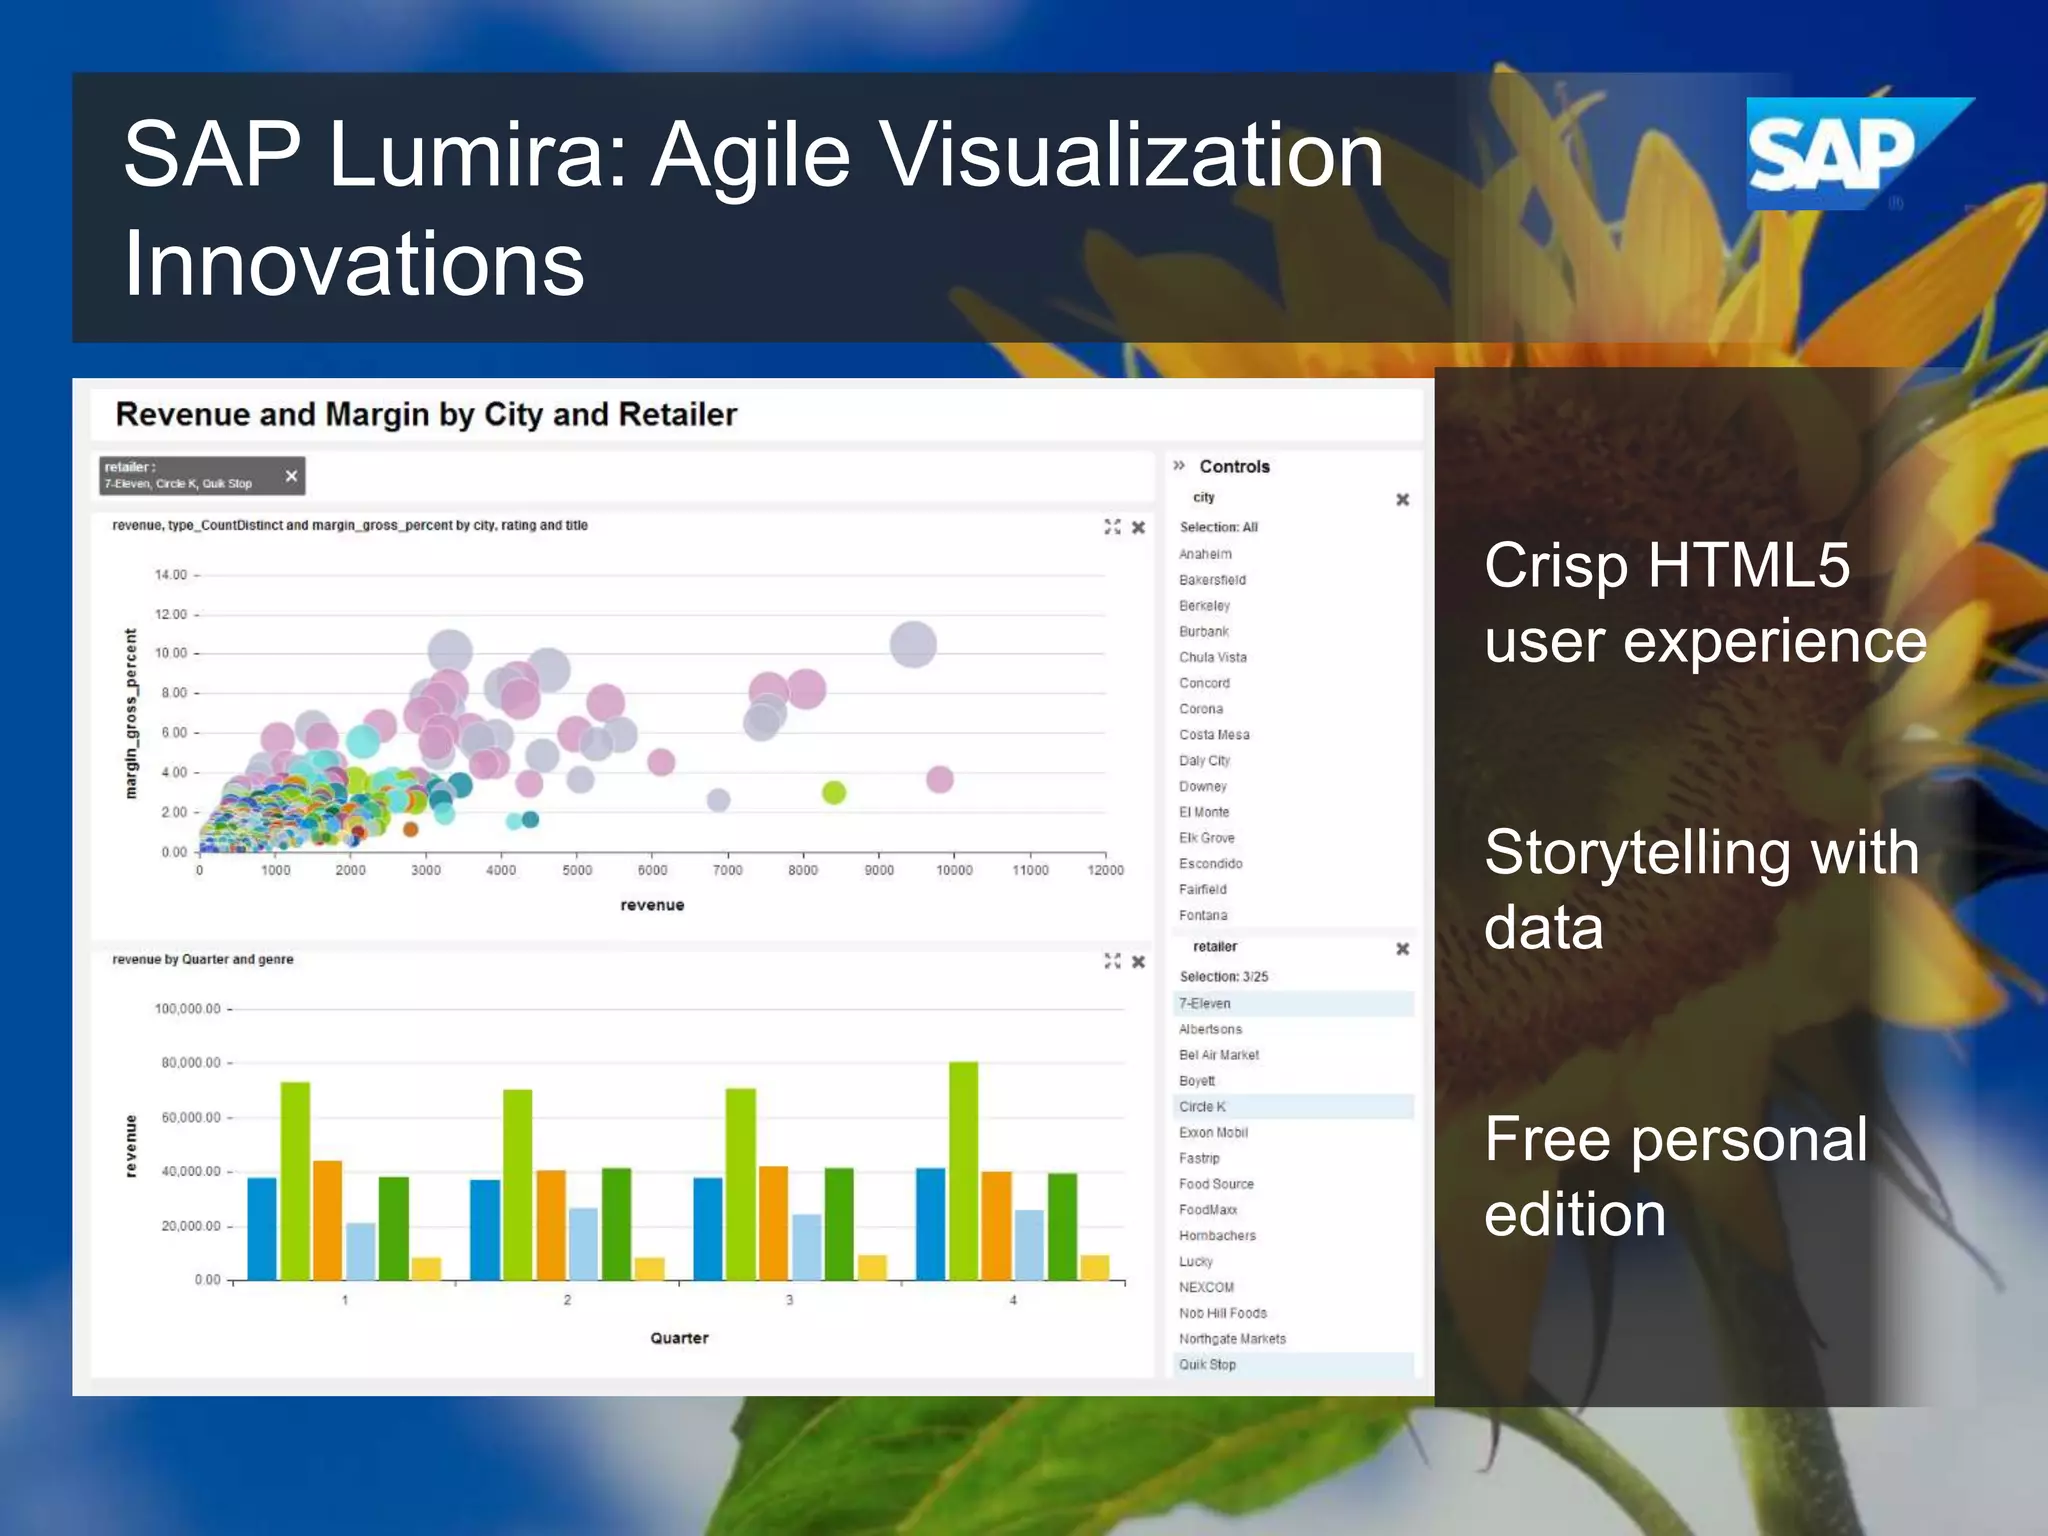
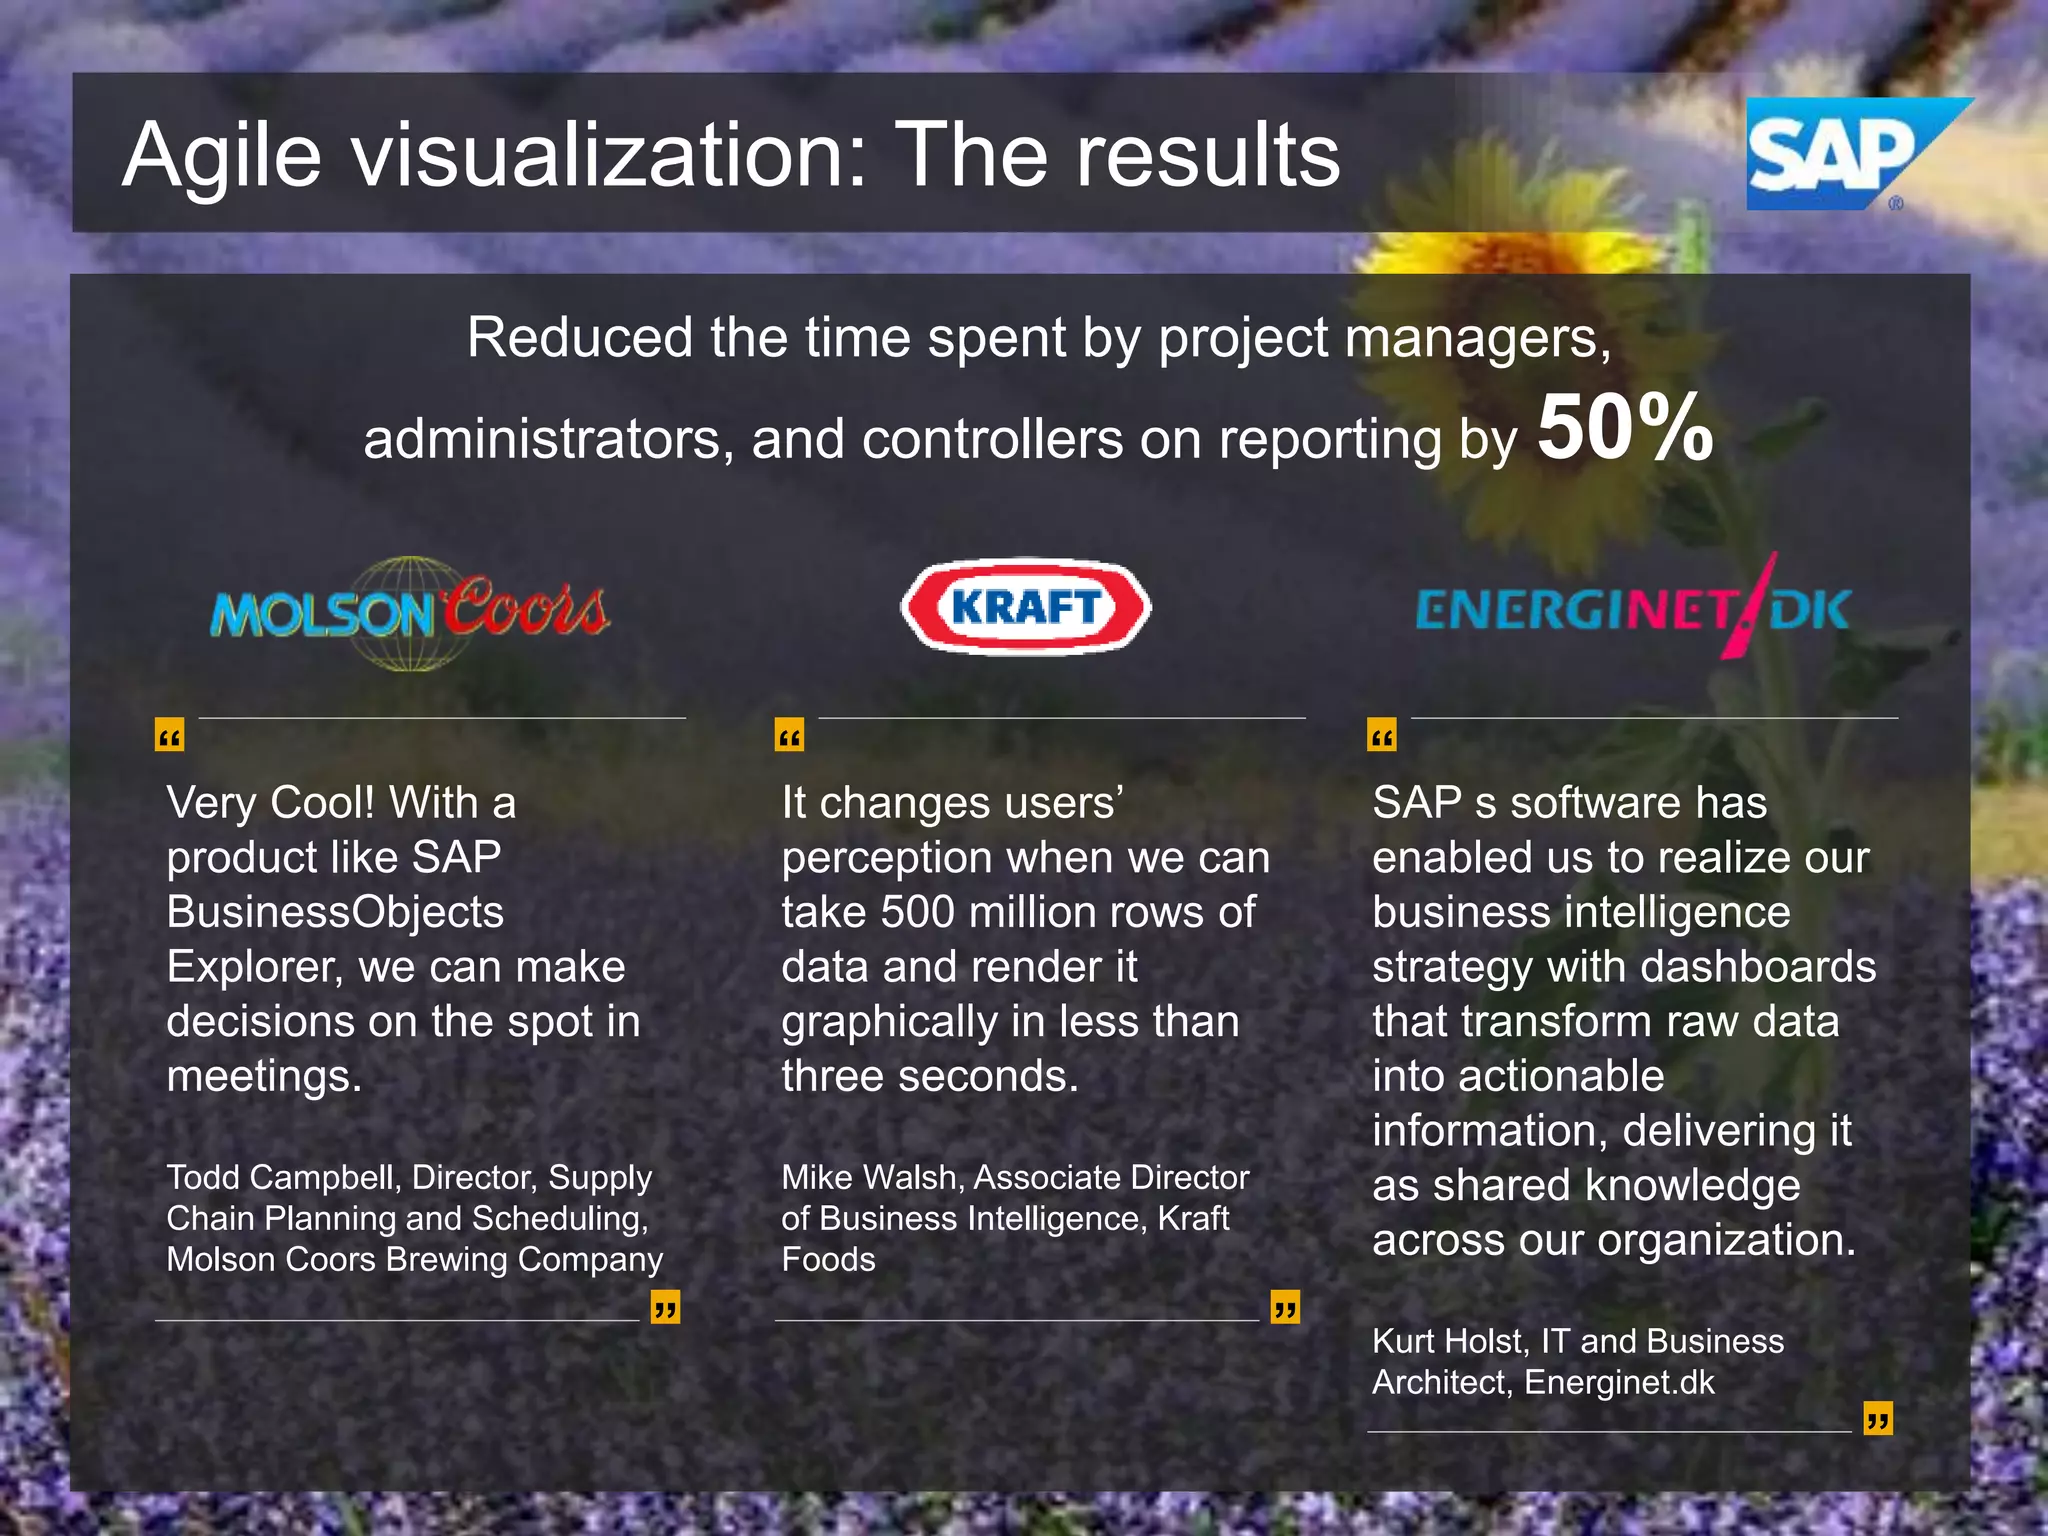
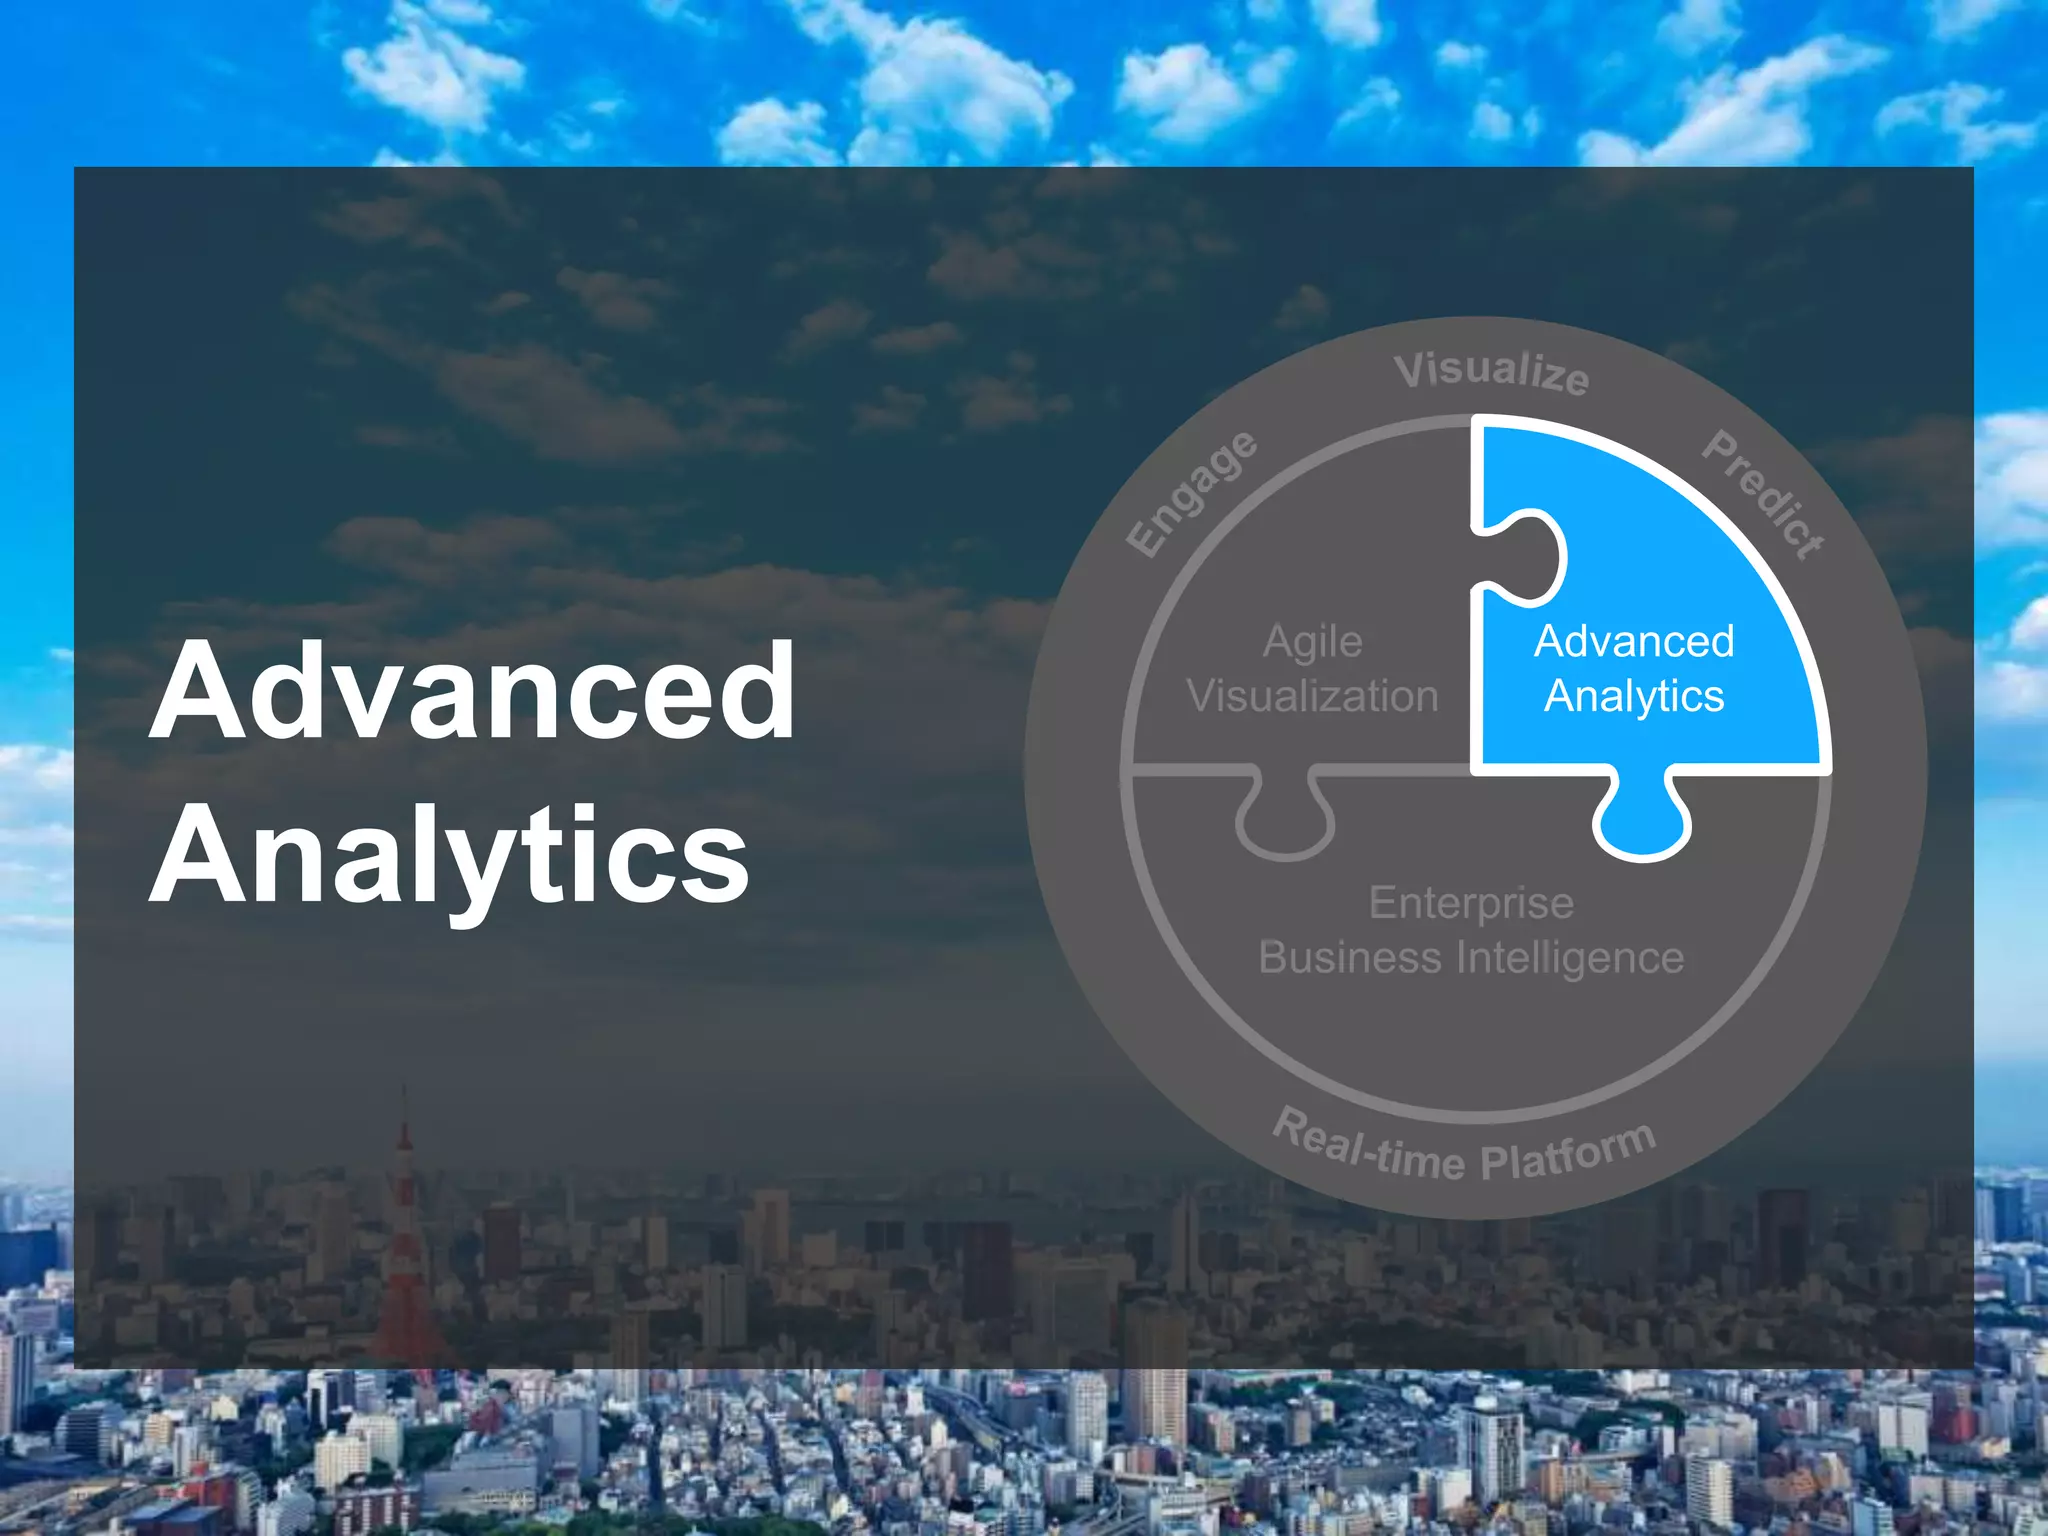
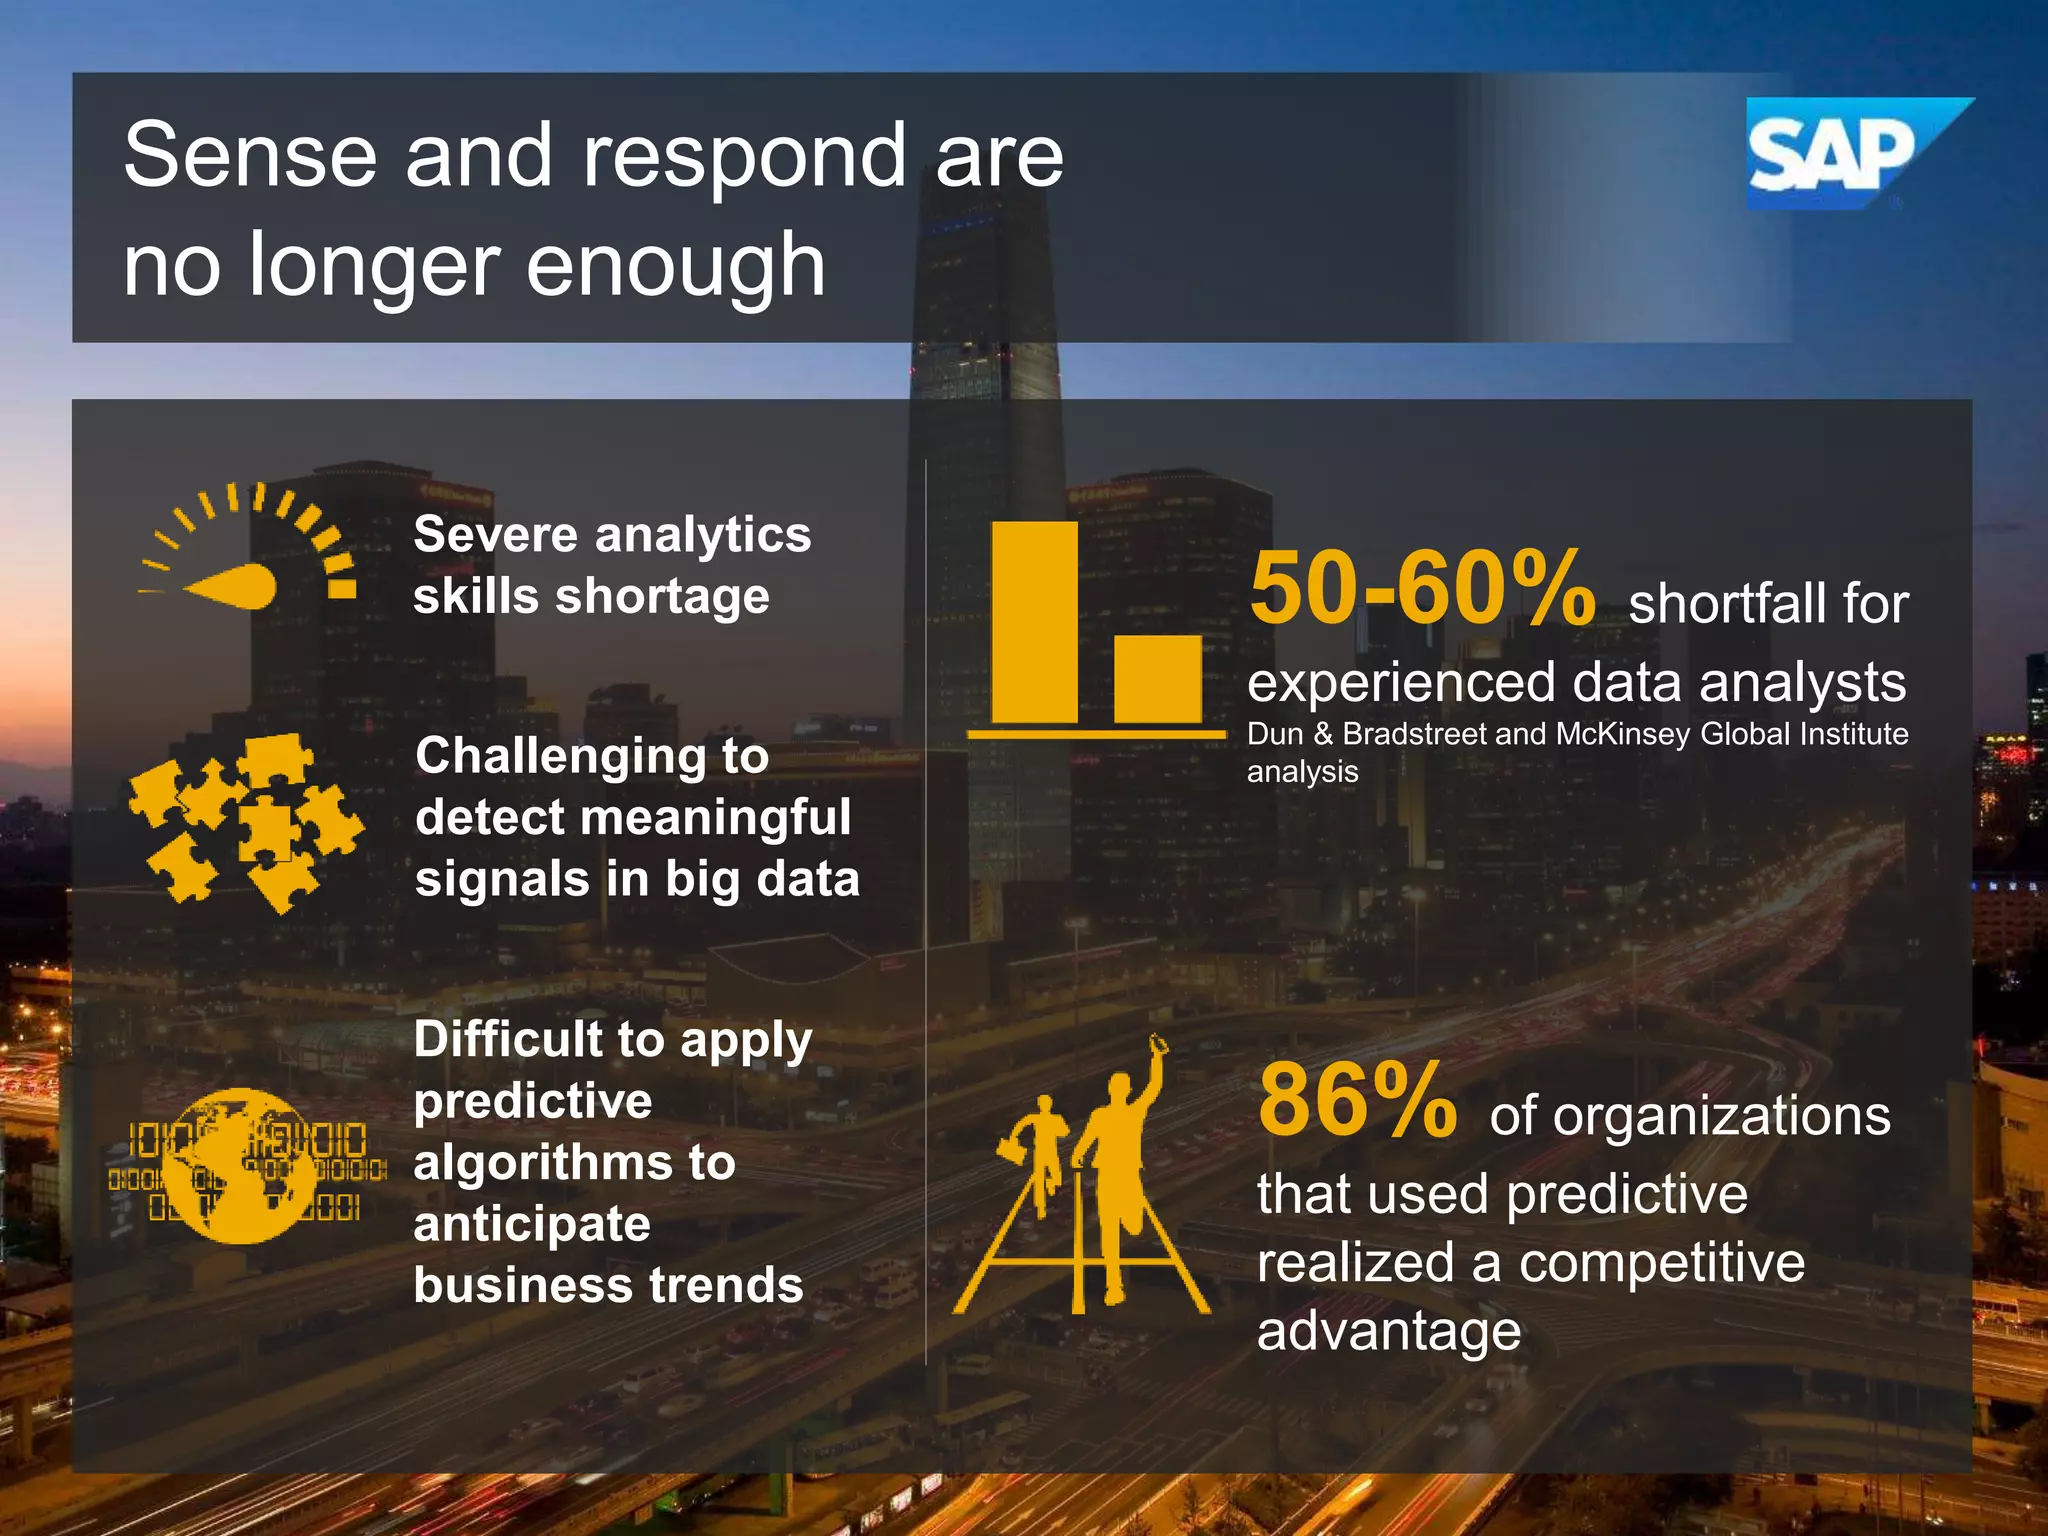
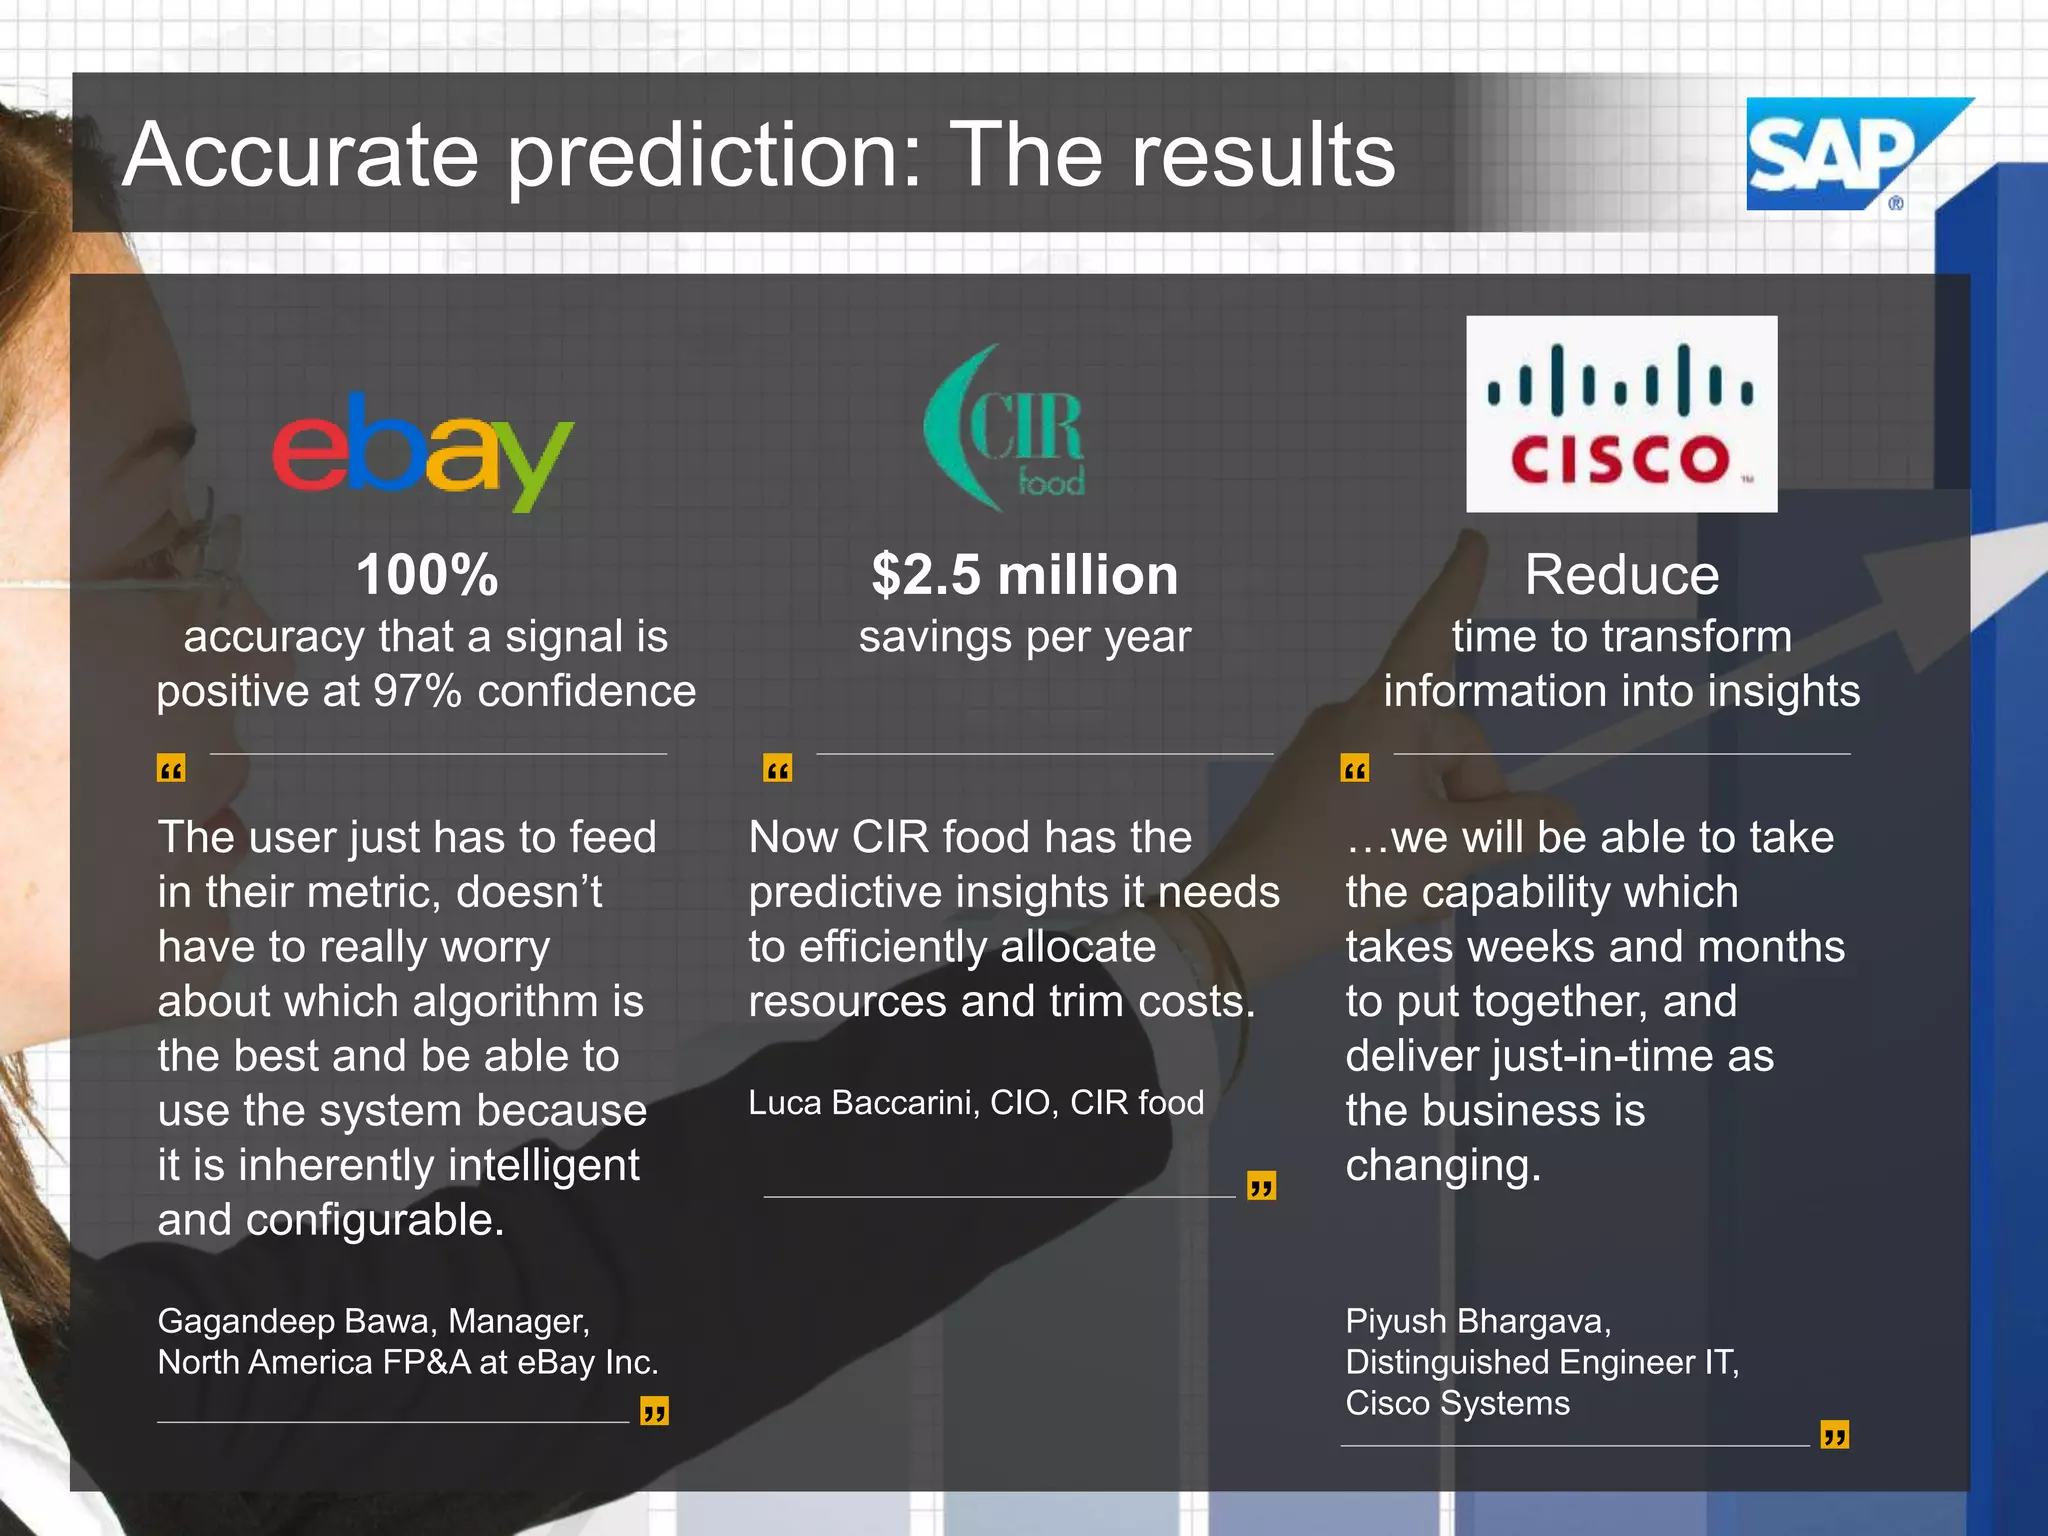
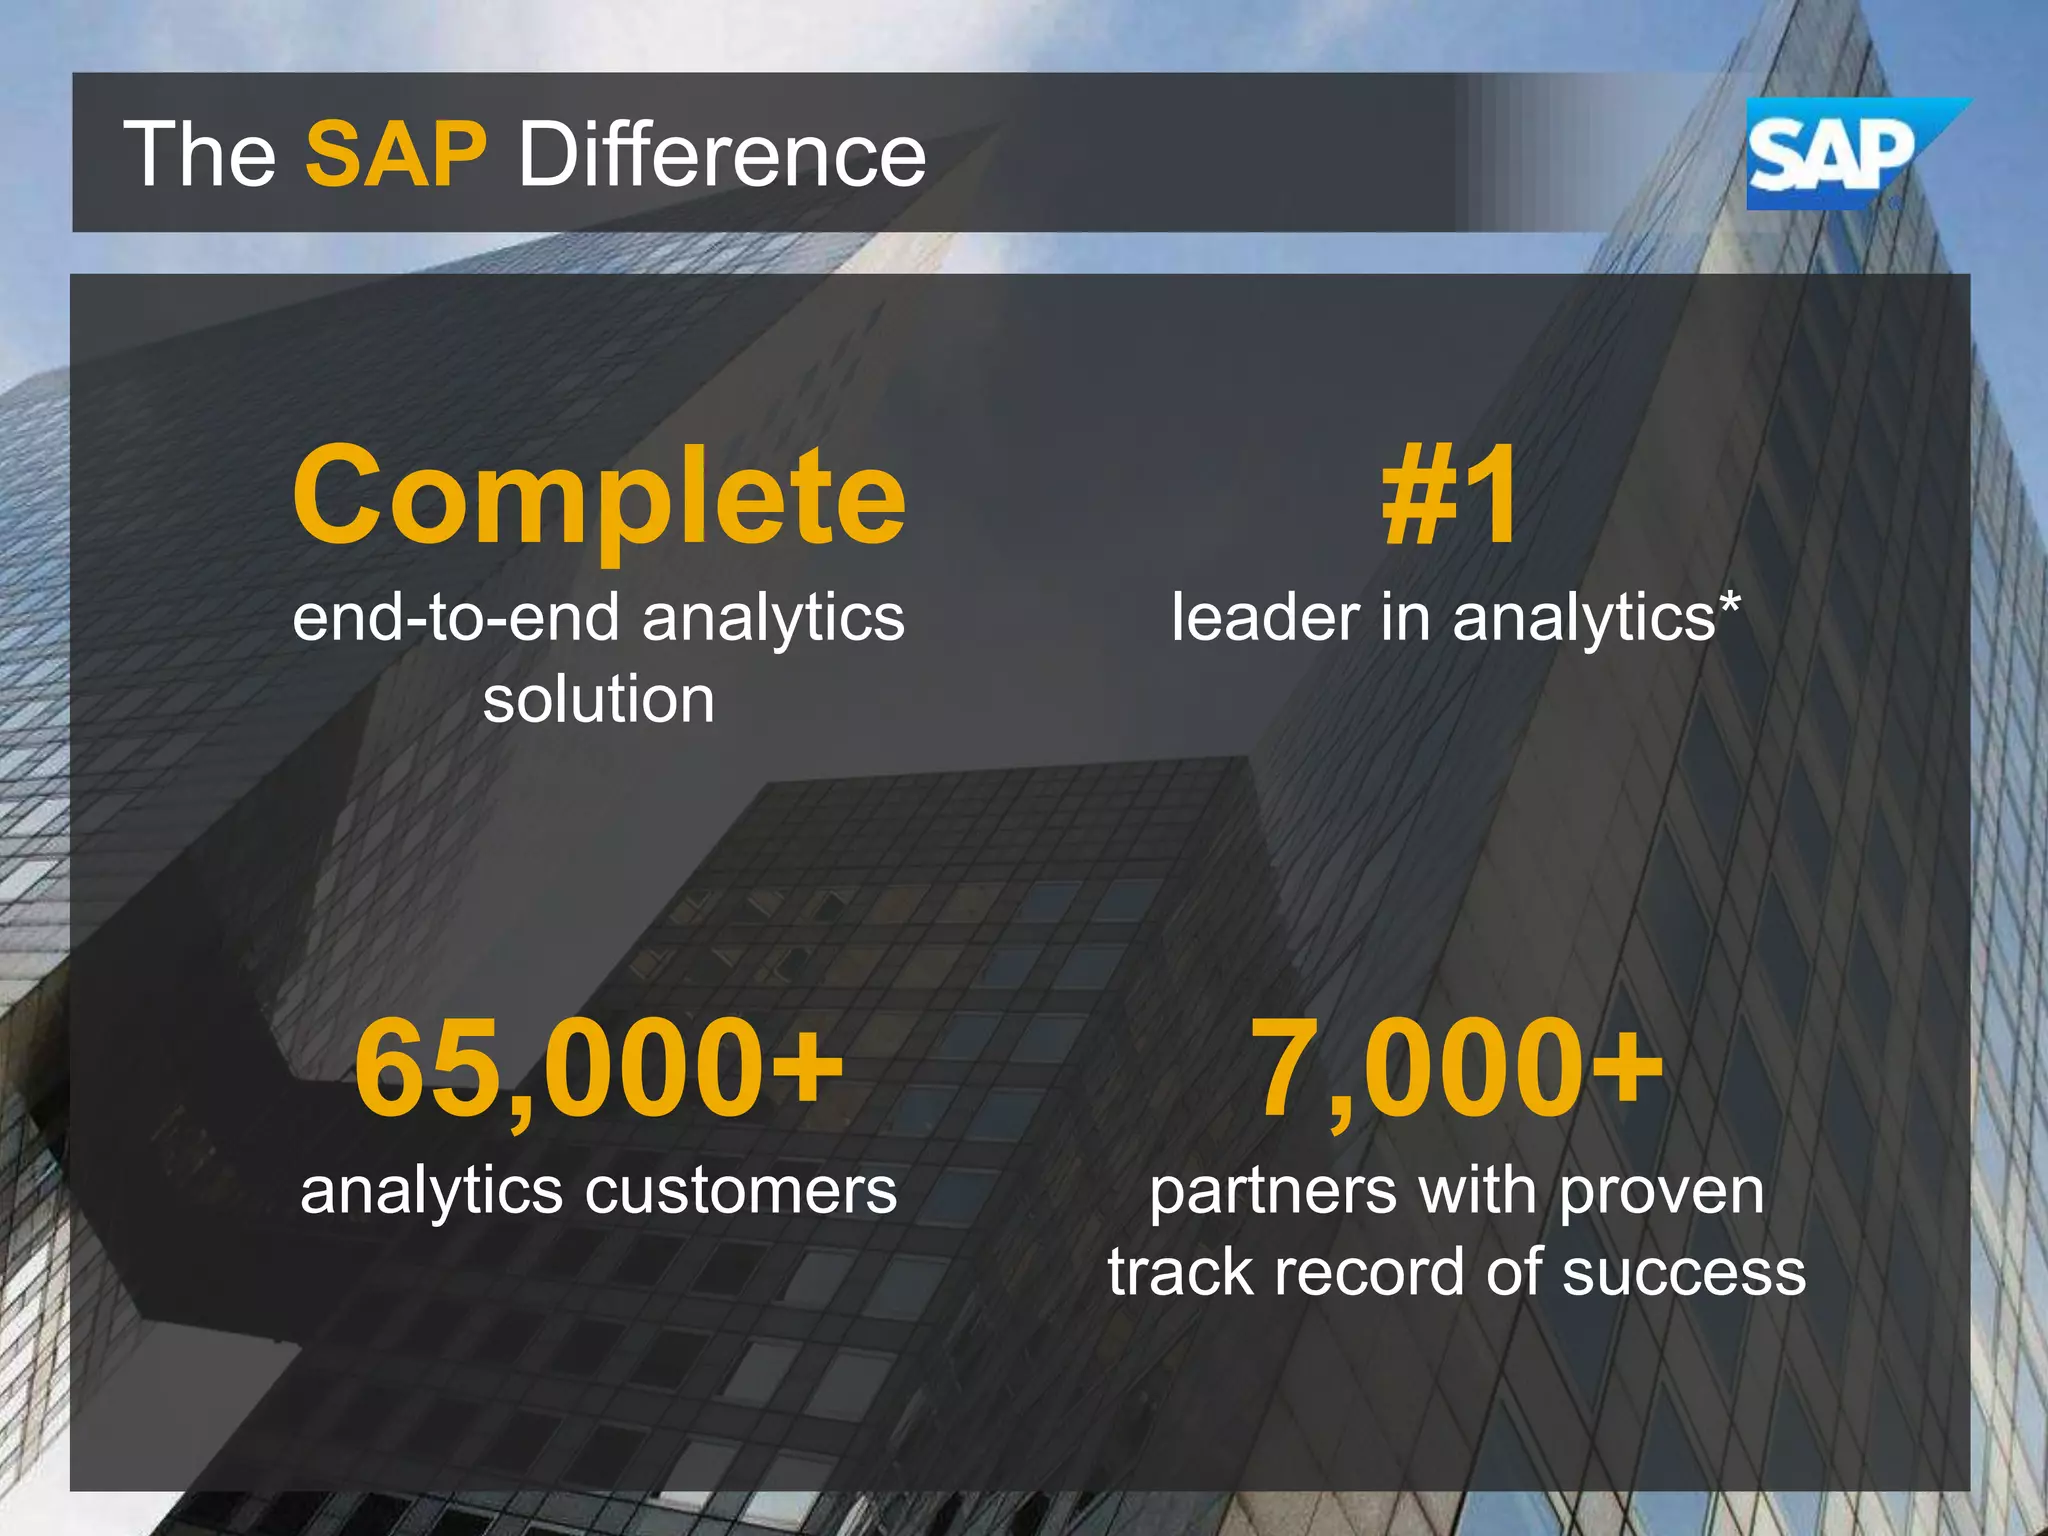
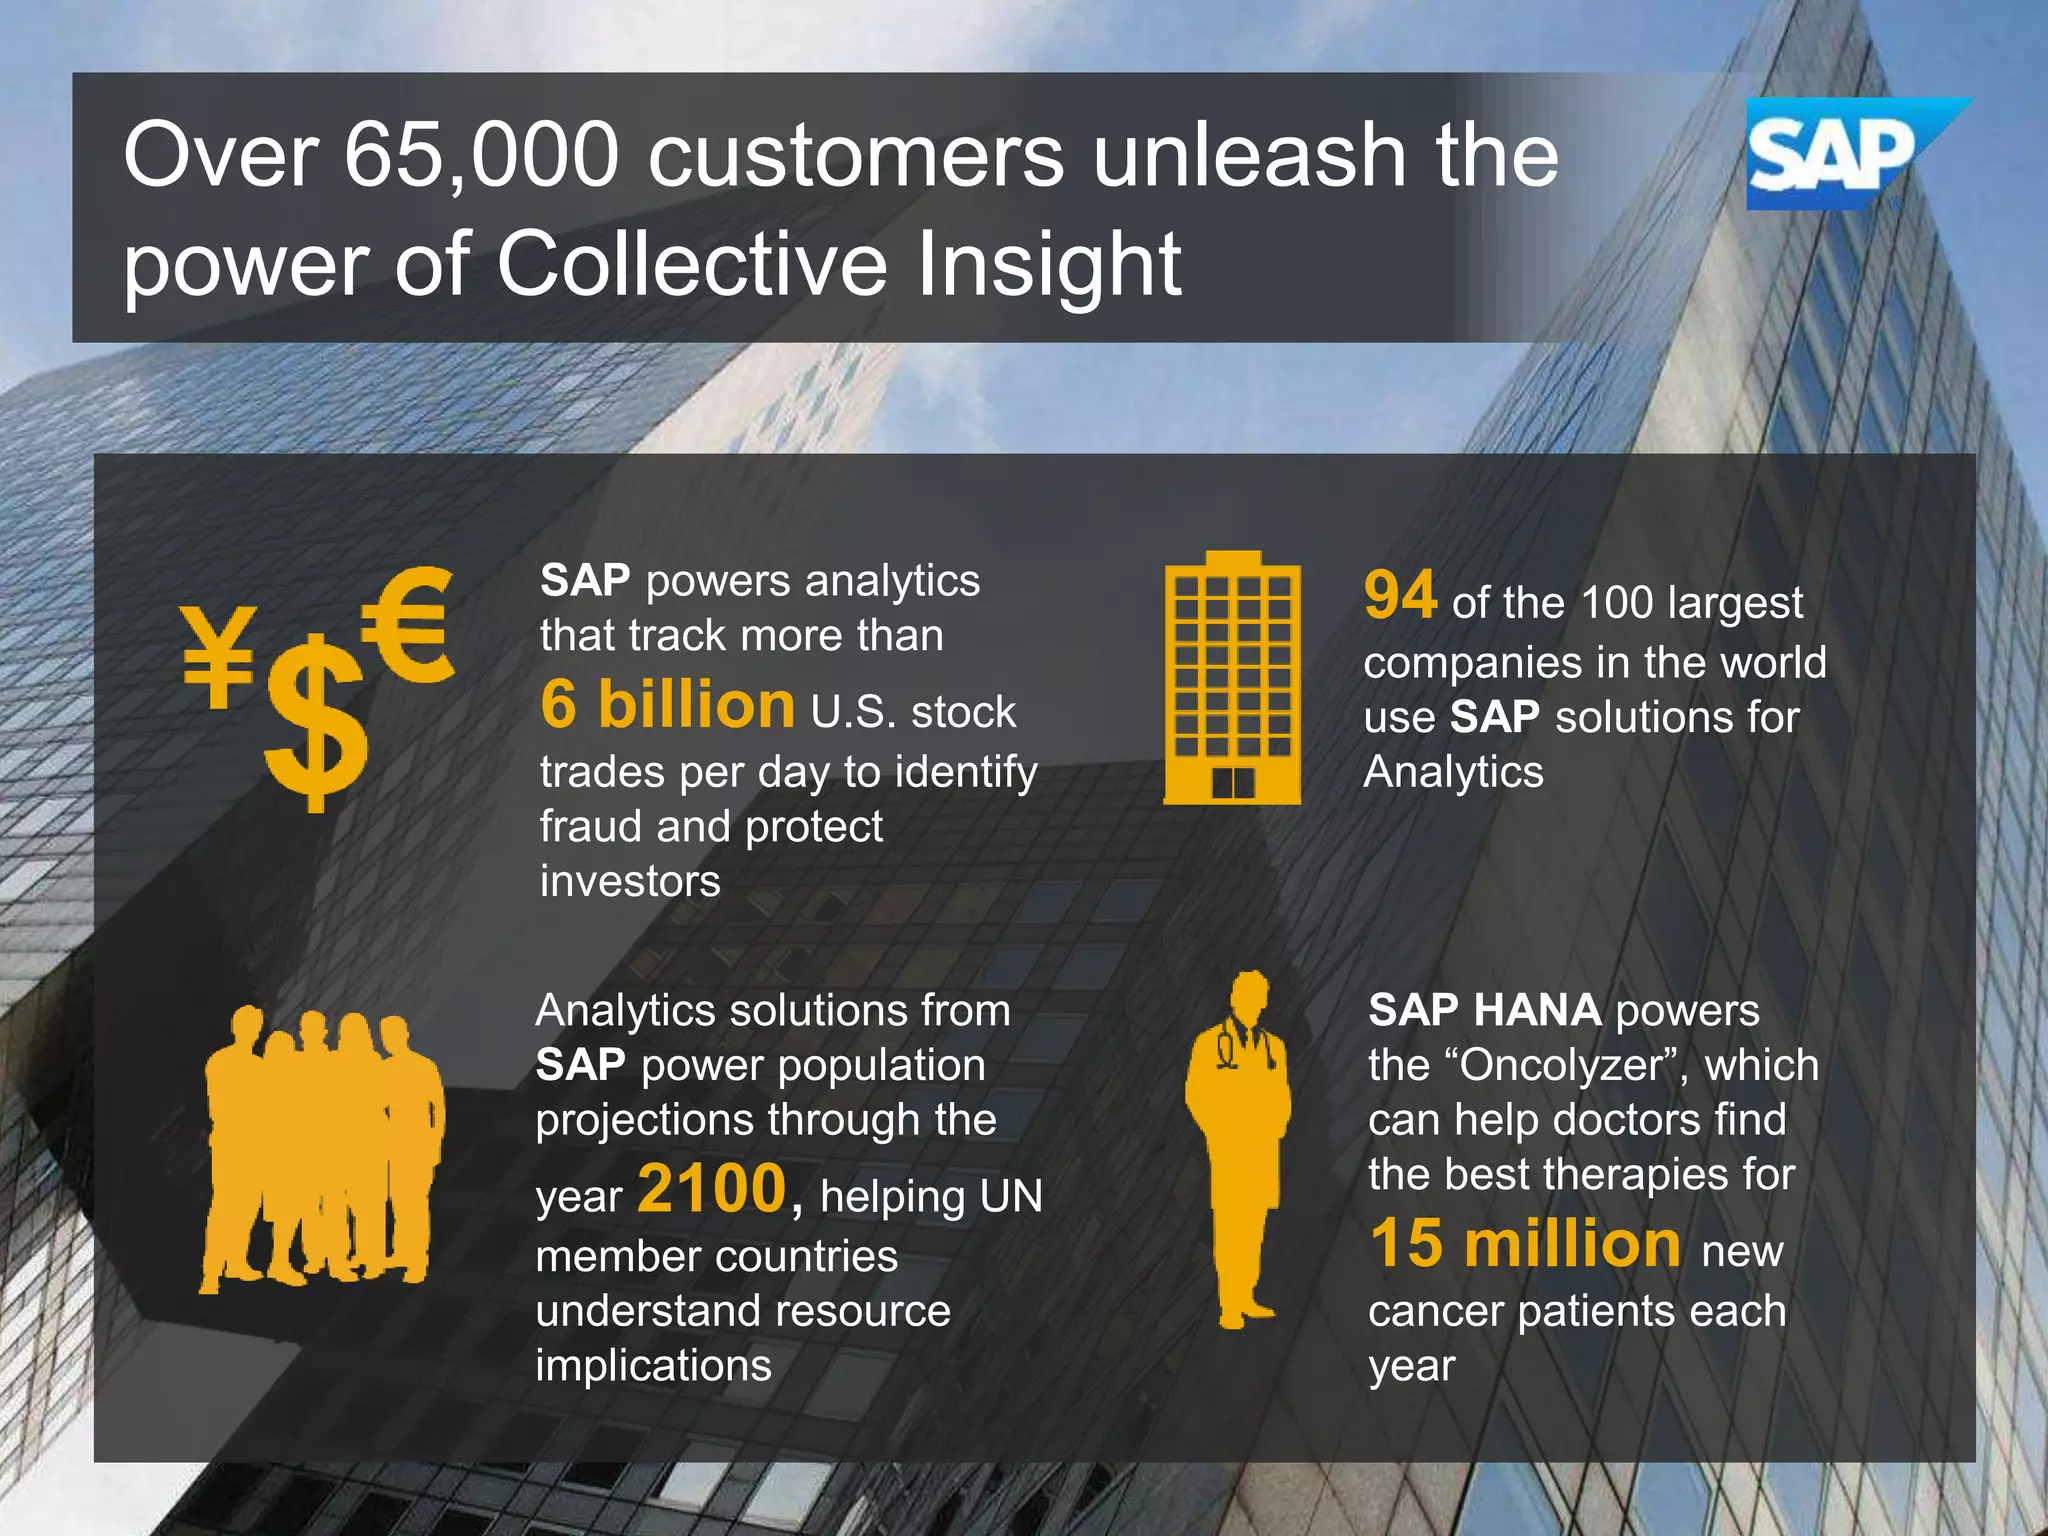


This document discusses how analytics solutions from Glintt & SAP can help organizations unlock insights from their data and leverage collective intelligence. It notes that while data is growing exponentially, most organizations are not utilizing all available information. The solutions presented aim to make analytics easy to adopt and implement, engage more users, and enable predictive capabilities to anticipate business trends in real-time. Visualizations, self-service tools, mobility, and cloud deployment are emphasized to democratize insights across organizations. Customer examples demonstrate increased efficiencies, cost savings, and competitive advantages realized through advanced analytics.


