Download as PDF, PPTX

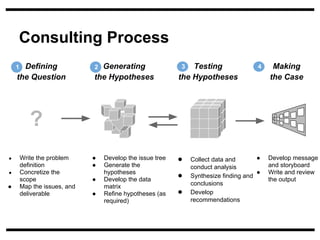
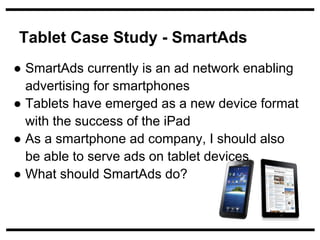
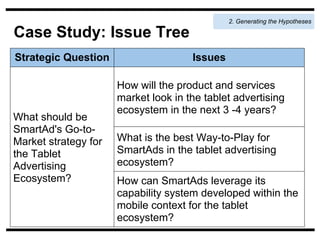
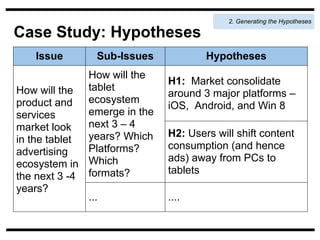
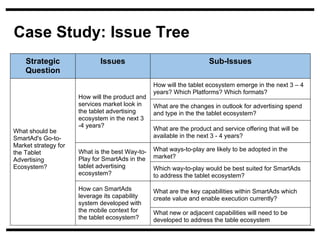
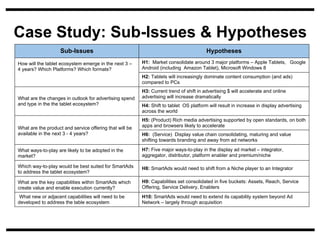
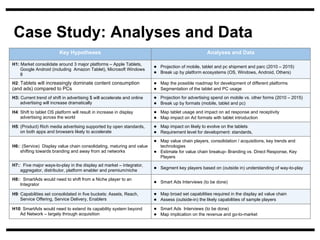

The document discusses a hypothesis-driven approach to consulting analytics, emphasizing the process of defining, generating, testing, and refining hypotheses to solve complex business problems. It includes a case study of Smartads, examining their strategic planning for tablet advertising and the changing landscape of the advertising ecosystem. Additionally, it outlines the importance of synthesizing data and developing recommendations that guide decision-making processes in consulting.