SlideShare a Scribd company logo
1 of 61
Anaerobic Treatment of
Industrial Wastewater
BioE 202 Iowa State University
Anaerobic Waste Treatment : An Overview
Historical development
Mainly used for reducing mass of high solids wastes, e.g. human waste
(nightsoil), animal manure, agricultural waste and sludge.
Early applications of anaerobic waste treatment include:
• Mouras automatic scavenger - cited in French journal Cosmos in 1881
• Septic tank- developed by Donald Cameron in 1895 (England)
• Imhoff tank: developed by Karl Imhoff in 1905 (Germany)
Popularity of anaerobic processes
Energy crisis in 70 and 80’s- a renewed interest in anaerobic process
0
200
400
600
800
1000
1200
1978
1981
1984
1987
1990
1993
1996
1999
No.
of
plants
Anaerobic treatment plants for industrial applications (Source: Franklin, 2001)
Anaerobic treatment within wastewater processing
Domestic wastewater (100)
Preliminary treatment
Bar screen, Comminutor
Grit chamber etc.
Primary sedimentation
(100)
Primary sludge
(35)
Aerobic treatment
(65)
e.g. Activated sludge,
Trickling filter, RBC
Secondary sedimentation
Oxidized to CO2 (30)
Converted to sludge (35)
Secondary sludge
(25)
Effluent (10)
Anaerobic digester
(60)
Anaerobic treatment of solids
How do we achieve high SRT in anaerobic treatment systems?
Anaerobic treatment of high solids such as animal manure, biological
sludge, nightsoil, etc. is commonly known as “anaerobic digestion” and
is carried out in airtight container known as an anaerobic digester (AD).
 AD is usually a continuous flow stirred tank
reactor (CFSTR) for which HRT ~ SRT
 Design based on volatile solids (VS) loading rate
 Anaerobic treatment of wastewaters requires a
long SRT to achieve better treatment efficiency
 The ratio of SRT/HRT ~ 10-100
 The high ratio allows the slow-growing methanogens to remain
in the reactor for a longer time
Anaerobic Waste Treatment
Anaerobic treatment is a biological process carried out in the absence
of O2 for the stabilization of organic materials by conversion to CH4
and inorganic end-products such as CO2 and NH3
Organic materials + Nutrients CH4 + CO2 +NH3 + Biomass
Anaerobic microbes
Anaerobic processes
Anaerobic fermentation Anaerobic respiration
Anaerobic fermentation
In anaerobic fermentation, there is no external electron acceptor.
The product generated during the process accepts the electrons
released during the breakdown of organic matter. Thus, organic
matter acts as both electron donor and acceptor. The process
releases less energy and the major portion of the energy is still
contained in the fermentative product such as ethanol.
Glucose Pyruvate
Energy
Electron
Ethanol
Anaerobic fermentation of glucose to ethanol
Anaerobic respiration
Anaerobic respiration on the other hand requires external electron
acceptor. The electron acceptors in this case could be SO4
2-, NO3
-
or CO2. The energy released under such a condition is higher
than anaerobic fermentation.
Glucose Pyruvate
Energy
Electron
CO2 + H2O
SO4
2-
CO2
NO3
-
H2S
CH4
N2
Anaerobic respiration of glucose, preference for electron acceptors
O2 > NO3
- > SO4
2- > CO2
Advantage of anaerobic processes
1. Less energy requirement as no aeration is needed
0.5-0.75 kWh energy is needed for every 1 kg of COD removal by aerobic processes
2. Energy generation in the form of methane gas
1.16 kWh energy is produced for every 1 kg of COD fermented in anaerobic process
3. Less biomass (sludge) generation
Anaerobic process produces only 20% of sludge compared with aerobic process
Soluble BOD
1 kg
Aerobic process
CO2 + H2O
0.5 kg
New biomass
0.5 kg
Biodegradable
COD
1 kg
Anaerobic process
CH4 gas
> 0.9 kg
New biomass
< 0.1 kg
4. Less nutrients (N & P) required
Lower biomass synthesis rate also implies less nutrients requirement : 20% of aerobic
5. Application of higher organic loading rate
Organic loading rates of 5-10 times higher than that of aerobic processes are possible
6. Space saving
Higher loading rates require smaller reactor volumes thereby saving on
disposal cost
7. Ability to transform several hazardous solvents
including chloroform, trichloroethylene and trichloroethane
to an easily degradable form
…Advantages of anaerobic processes
Limitations of anaerobic processes
1. Long start-up time
Because of lower biomass synthesis rate, it requires a longer start-up time
to attain a biomass concentration
2. Long recovery time
If an anaerobic system is subjected to disturbances either due to biomass
wash-out, toxic substances or shock loading, it may take longer time for the
system to return to normal operating conditions
3. Specific nutrients/trace metal requirements
Anaerobic microorganisms, especially methanogens, have specific nutrients
e.g. Fe, Ni, and Co requirement for optimum growth
4. More susceptible to changes in environmental conditions
Anaerobic microorganisms especially methanogens are prone to changes in
conditions such as temperature, pH, redox potential, etc.
5. Treatment of sulfate-rich wastewater
The presence of sulfate not only reduces the methane yield due to substrate
Competition, but also inhibits the methanogens due to sulfide production
6. Effluent quality of treated wastewater
The minimum substrate concentration (Smin) from which microorganisms are able
to generate energy for their growth and maintenance is much higher for
anaerobic treatment systems. Anaerobic processes may not be able to degrade
organic matter to the level to meet the discharge limits for ultimate disposal.
7. Treatment of high protein & nitrogen containing wastewater
The anaerobic degradation of proteins produces amines which are no longer be
degraded anaerobically. Similarly nitrogen remains unchanged during anaerobic
treatment. Recently, a process called ANAMMOX ( ANaerobic AMMonium OXididation)
has been developed to anaerobically oxidize NH4
+ to N2 in presence of nitrite.
NH4
+ + NO2
-  N2 + 2H2O
…Limitations of anaerobic processes
NH4
+ + 1.32 NO2
- + 0.066CO2 + 0.13H+  1.02 N2 + 0.26NO3
- + 0.066CH2O0.5N0.15
Comparison between anaerobic and aerobic processes
Anaerobic Aerobic
Organic loading rate
High loading rates:10-40 kg COD/m3-day Low loading rates:0.5-1.5 kg COD/m3-day
(for high rate reactors, e.g. AF,UASB, E/FBR) (for activated sludge process)
Biomass yield
Low biomass yield:0.05-0.15 kg VSS/kg COD High biomass yield:0.35-0.45 kg VSS/kg COD
(biomass yield is not constant but depends
on types of substrates metabolized)
(biomass yield is fairly constant irrespective
of types of substrates metabolized)
Specific substrate utilization rate
High rate: 0.75-1.5 kg COD/kg VSS-day Low rate: 0.15-0.75 kg COD/kg VSS-day
Start-up time
Long start-up: 1-2 months for mesophilic
: 2-3 months for thermophilic
Short start-up: 1-2 weeks
Anaerobic Aerobic
SRT
Longer SRT is essential to retain the slow
growing methanogens within the reactor
Microbiology
Anaerobic processes involve multi-step
chemical conversions and a diverse
group of microorganisms degrade the
organic matter in a sequential order
Aerobic process is mainly a one-
species phenomenon, except for
nutrient-removal processes
Environmental factors
The process is highly susceptible to
changes in environmental conditions
SRT of 4-10 days is enough for the
activated sludge process
The process is more robust to
changing environmental conditions
Comparison between anaerobic and aerobic processes
How much methane gas can be generated through
complete anaerobic degradation of 1 kg COD at STP ?
Step 2: Conversion of CH4 mass to equivalent volume
Based on the ideal gas law, 1 mole of any gas at STP (Standard Temperature
and Pressure) occupies a volume of 22.4 L
 1 Mole CH4 ~ 22.4 L CH4
 16 g CH4 ~ 22.4 L CH4
 1 g CH4 ~ 22.4/16 = 1.4 L CH4 ---------- (2)
Step 1: Calculation of COD equivalence of CH4
CH4 + 2O2  CO2 + 2H2O
16 g 64g
 16 g CH4 ~ 64 g O2 (COD)
 1 g CH4 ~ 64/16 = 4 g COD ------------ (1)
Step 3: CH4 generation rate per unit of COD removed
From eq. (1) and eq. (2), we have,
=> 1 g CH4 ~ 4 g COD ~ 1.4 L CH4
=> 4 g COD ~ 1.4 L CH4
=> 1 g COD ~ 1.4/4 = 0.35 LCH4
or 1 Kg COD ~ 0.35 m3 CH4 ----------- (3)
Complete anaerobic degradation of 1 kg COD
produces 0.35 m3 CH4 at STP
Methane
Carbon dioxide
COMPLEX ORGANIC MATTER
Proteins Carbohydrates Lipids
Amino Acids, Sugars Fatty Acids, Alcohols
hydrolysis
INTERMEDIARY PRODUCTS
(C>2; Propionate, Butyrate etc)
acidogenesis
Acetate Hydrogen, Carbon dioxide
acetogenesis
Organics Conversion in Anaerobic Systems
methanogenesis
72 28
Process Microbiology
The anaerobic degradation of complex organic matter is carried out by
a series of bacteria and archeae as indicated in the figure (with numbers).
There exists a coordinated interaction among these microbes.
The process may fail if a certain of these organisms are inhibited.
Fermentative bacteria (1)
This group of bacteria is responsible for the first stage of anaerobic
digestion - hydrolysis and acidogenesis. These bacteria are either
facultative or strict anaerobes.
The anaerobic species belonging to the family of Streptococcaceae and
Enterobacteriaceae and to the genera of Bacteroides, Clostridium,
Butyrivibrio, Eubacterium, Bifidobacterium and Lactobacillus are most
common.
Syntrophic association of acetogenic organisms with
methanogenic H2- consuming bacteria helps to lower the
concentration of H2 below inhibitory level so that propionate
degrading bacteria are not suppressed by excessive H2 level
H2 partial pressure 10-2 (100 ppm)
This group of bacteria metabolizes propionate and other
organic acids (>C-2), alcohols and certain aromatic
compounds (i.e. benzoate) into acetate and CO2
Hydrogen producing acetogenic bacteria (2)
CH3CH2COO -  CH3COO - + CO2 + H2
Homoacetogenes (3)
Homoacetogenesis has gained much attention in recent years
in anaerobic processes due to its final product: acetate, which
is the important precursor to methane generation.
The bacteria are, H2 and CO2 users. Clostridium aceticum and
Acetobacterium woodii are the two homoacetogenic bacteria
isolated from the sewage sludge.
Homoacetogenic bacteria have a high thermodynamic
efficiency; as a result there is no accumulation H2 and CO2
during growth on multi-carbon compounds.
CO2 + H2  CH3COOH + 2H2O
Methanogens (4 and 5)
Methanogens are unique domain of microbes classified as Archeae,
distinguished from Bacteria by a number of characteristics, including
the possession of membrane lipids, absence of the basic cellular
characteristics (e. g. peptidoglycan) and distinctive ribosomal RNA.
Methanogens are obligate anaerobes and considered as a rate-limiting
species in anaerobic treatment of wastewater. Moreover, methanogens
co-exist or compete with sulfate-reducing bacteria for the
substrates in anaerobic treatment of sulfate-laden wastewater.
Two classes of methanogens that metabolize acetate to methane are:
• Methanosaeta (old name Methanothrix): Rod shape, low Ks, high affinity
• Methanosarcina (also known as M. mazei): Spherical shape, high Ks,
low affinity
Methanosaeta Methanosarcina
Growth kinetics of Methanosaeta andMethanosarcina
Essential conditions for efficient anaerobic treatment
• Enough nutrients (N & P) and trace metals especially, Fe, Co, Ni, etc.
COD:N:P = 350:7:1 (for highly loaded system) 1000:7:1 (lightly
loaded system)
• Avoid excessive air/O2 exposure
• No toxic/inhibitory compounds present in the influent
• Maintain pH between 6.8 –7.2
• Sufficient alkalinity present (mainly bicarbonates)
• Low volatile fatty acids (VFAs)
• Temperature around mesophilic range (30-38 oC)
• SRT/HRT >>1 (use high rate anaerobic reactors)
Best industrial wastewaters for anaerobic treatment
• Alcohol production
• Brewery and Winery
• Sugar processing
• Starch (barley, corn, potato, wheat, tapioca) and desizing
waste from textile industry.
• Food processing
• Bakery plant
• Pulp and paper
• Dairy
• Slaughterhouse
• Petrochemical waste
Environmental factors
The successful operation of anaerobic reactor depends on maintaining
the environmental factors close to the comfort of the microorganisms
involved in the process.
Temperature
 Anaerobic processes like other biological processes
operate in certain temperature ranges
 In anaerobic systems: three optimal temperature ranges:
 Psychrophilic (5 - 15oC)
 Mesophilic (35 – 40 C)
 Thermophilic (50-55 oC)
Effect of temperature on anaerobic activity
Rule of thumb: Rate of a reaction doubles for every 10 oC
rise in temperature up to an optimum and then declines rapidly
pH
There exist two microbial domains in terms of pH optima namely
acidogens and methanogens. The best pH range for acidogens is 5.5 –
6.5 and for methanogens is 7.8 – 8.2. The operating pH for combined
cultures is 6.8-7.4 with neutral pH being the optimum. Since methano-
genesis is considered as a rate limiting step, it is necessary to maintain
the reactor pH close to neutral.
Low pH reduces the activity of methanogens causing accumulation of
VFA and H2. At higher partial pressure of H2, propionic acid degrading
bacteria will be severely inhibited thereby causing excessive accumulation
of higher molecular weight VFAs such as propionic and butyric acids and
the pH drops further. If the situation is left uncorrected, the process may
eventually fail. This condition is known as going “SOUR” or STUCK”.
Remedial measures: Reduce the loading rates and supplement
chemicals to adjust the pH: alkaline chemicals such as NaHCO3, NaOH,
Na2CO3, quick lime (CaO), slaked lime [Ca(OH)2], limestone (or
softening sludge) CaCO3, and NH3 can be used.
Cont..
Relative activity of methanogens to pH
0.0
0.3
0.5
0.8
1.0
1.3
3 4 5 6 7 8 9 10 11
pH
Activity
pH dependence of methanogens
An anaerobic treatment system has its own buffering capacity against
pH drop because of alkalinity produced during waste treatment: e.g.
the degradation of protein present in the waste releases NH3, which
reacts with CO2 forming ammonium carbonate as alkalinity.
NH3 + H2O + CO2  NH4HCO3
The degradation of salt of fatty acids may produce some alkalinity.
CH3COONa + H2O  CH4 + NaHCO3
Sulfate and sulfite reduction also generate alkalinity.
CH3COO - + SO4
2-  HS- + HCO3
- + 3H2O
When pH starts to drop due to VFA accumulation, the alkalinity
present within the system neutralizes the acid and prevents further
drop in pH. If the alkalinity is not enough to buffer the system pH,
we need external additions.
Cont..
Natural buffering
All microbial processes including anaerobic require macro (N, P and
S) and micro (trace metals) nutrients in sufficient concentration to
support biomass synthesis. Anaerobic micro-organisms, especially
methanogens, have specific requirements of trace metals such as
Ni, Co, Fe, Mo, Se etc. The nutrients and trace metals requirements
for anaerobic process are much lower as only 4 - 10% of the COD
removed is converted to biomass.
Nutrients and trace metals
Inhibition/Toxicity
The toxicity is caused by substances present in the influent waste
or byproducts of metabolic activities. Heavy metals, halogenated
compounds, and cyanide are examples of the former type whereas
sulfide and VFAs belong to latter . Ammonia from either group
Cont..
COD:N:P = 350:7:1 (for highly loaded system) 1000:7:1
(lightly loaded system)
Types of anaerobic reactors
Low-rate anaerobic reactors High-rate anaerobic reactors
Anaerobic pond
Septic tank
Standard rate
anaerobic digester
Imhoff tank
Slurry type bioreactor, temperature,
mixing, SRT or other environmental
conditions are not regulated.
Loading of 1-2 kg COD/m3-day
Anaerobic sequencing batch
reactor (ASBR)
Anaerobic contact process
Anaerobic filter (AF)
Upflow anaerobic sludge
blanket (UASB)
Fluidized bed reactor
Hybrid reactor: UASB/AF
Able to retain very high concentration of
active biomass in the reactor. Thus
extremely high SRT could be maintained
irrespective of HRT. Load 5-20 kg COD/m3-d
COD removal efficiency : 80-90%
Anaerobic contact process (ACP)
Influent Effluent
Waste sludge
Recycled sludge
Completely mixed
reactor
Biogas
Degassifier
Biogas
Settling tank
Anaerobic contact process is essentially an anaerobic activated
sludge process. It consists of a completely mixed reactor followed
by a settling tank. The settled biomass is recycled back to the
reactor. Hence ACP is able to maintain high concentration of
biomass in the reactor and thus high SRT irrespective of HRT.
Degasifier allows the removal of biogas bubbles (CO2, CH4)
attached to sludge which may otherwise float to the surface.
.
ACP was initially developed for the treatment of dilute
wastewater such as meat packing plant which had tendency
to form a settleable flocs. ACP is suitable for the treatment
of wastewater containing suspended solids which render
the microorganisms to attach and form settleable flocs.
The biomass concentration in the reactor ranges from 4-6 g/L
with maximum concentration as high as 25-30 g/L depending
on settleability of sludge. The loading rate ranges from 0.5 –
10 kg COD/m3-day. The required SRT could be maintained by
controlling the recycle rate similar to activated sludge process.
Cont..
…Anaerobic contact process (ACP)
Anaerobic filter
• Developed by Young and McCarty in the late 1960s to
treat dilute soluble organic wastes
• The filter was filled with rocks similar to the trickling filter
• Wastewater distributed across the bottom and the flow was
in the upward direction through a bed of rocks
• Whole filter submerged completely
• Anaerobic microorganisms accumulate within voids of media
(rocks or other plastic media)
• The media retain or hold the active biomass within the filter
• The non-attached biomass within the interstices forms bigger
flocs of granular shape due to rising gas bubble/liquid
• Non-attached biomass contributes significantly to waste treatment
• Attached biomass not be a major portion of total biomass
• 64% attached and 36% non-attached
Feeding
tank at 4oC
Biogas
Effluent
Peristaltic pump
Media
Perforated
Al plate Sampling
port
Heater
Constant temperature
recirculation line
Water bath
Peristaltic pump
Sludge wastage
Upflow Anaerobic Filter
Originally, rocks were employed as packing medium in
anaerobic filter. But due to very low void volume (40-50%),
serious clogging problems were witnessed. Now, many
synthetic packing media are made up of plastics; ceramic tiles
of different configuration have been used in anaerobic filters.
The void volume in these media ranges from 85-95 %.
Moreover, these media provide high specific surface area,
typically 100 m2/m3, or above, which enhances biofilm growth.
Cont..
Anaerobic Filter Packing
Downflow anaerobic filters are similar to a trickling filter in
operation. DAF is closer to fixed film reactor as loosely held
biomass/sludge within the void spaces is potentially washed
out of the reactor. The specific surface area of media is more
important in DAF than UAF.
There is less of a clogging problem and wastewater with some
SS concentration can be treated using DAF.
Downflow anaerobic filter (DAF)
Cont..
Since anaerobic filters are able to retain high biomass, a long
SRT can be maintained. Typically HRT varies from 0.5 – 4 days
and the loading rates vary from 5 - 15 kg COD/m3-day. Biomass
wastage is generally not needed and hydrodynamic conditions
play an important role in biomass retention within the void space.
Anaerobic Filters
Upflow Anaerobic Sludge Blanket (UASB)
UASB was developed in 1970s by Lettinga in the Netherlands.
UASB is essentially a suspended growth system in which proper
hydraulic and organic loading rate is maintained in order to
facilitate the dense biomass aggregation known as granulation.
The size of granules is about 1-3 mm diameter. Since granules
are bigger in size and heavier, they will settle down and be
retained within the reactor. The concentration of biomass in the
reactor may become as high as 50 g/L. Thus a very high SRT
can be achieved even at a very low HRT of 4 hours.
The granules consist of hydrolytic bacteria, acidogen/acetogens
and methanogens. Carbohydrate degrading granules show
layered structure with a surface layer of hydrolytic/fermentative
acidogens. A mid-layer comprising of syntrophic colonies and
an interior with acetogenic methanogens.
Effluent
Influent
biogas
UASB Reactor
Static granular bed reactor (SGBR)
• Simple in operation with
fewer moving parts
• Major issue: head loss due
to build-up of solids
• Developed at Iowa State University by Drs. Ellis and Kris Mach
• Just opposite to UASB; flow is from top to bottom and the bed
is static
• No need of three-phase separator or flow distributor
Effluent
When the waste contains sulfate, part of COD is diverted to
sulfate reduction and thus total COD available for methane
production would be reduced greatly.
Effect of sulfate on methane production
Sulfide will also impose toxicity on methanogens at a
concentration of 50 to 250 mg/L as free sulfide.
8e +8H+ + SO4
2-  S2- + 4H2O
• COD/SO4
2- ~ 0.67
8e +8H+ + 2O2  4H2O
2O2/ SO4
2- = 64/96 ~ 0.67
Theoretically, 1 g of COD is needed to reduce 1.5 g of sulfate
Stoichiometry of sulfate reduction
Example 2
A UASB reactor has been employed to treat food processing
wastewater at 20oC. The flow rate is 2 m3/day with a mean soluble
COD of 7,000 mg/L. Calculate the maximum CH4 generation rate in
m3/day. What would be the biogas generation rate at 85% COD
removal efficiency and 10% of the removed COD is utilized for biomass
synthesis. The mean CH4 content of biogas is 80%. If the wastewater
contains 2.0 g/L sulfate, theoretically how much CH4 could be
generated?
Solution:
Maximum CH4 generation rate:
The complete degradation of organic matter in the waste could
only lead to maximum methane generation and is also regarded
as theoretical methane generation rate.
(7000 x 10-6)
 Total COD removed = ----------------- x (2) kg/d
(10-3)
= 14 kg/d
From eq. (3) in example 1, we have
1 Kg COD produces 0.35 m3 CH4 at STP
14 Kg COD produces ~ 0.35 x 14 = 4.9 m3 CH4/d at STP
At 20C, the CH4 gas generation = 4.9 x(293/273)
= 5.3 m3/d
The maximum CH4 generation rate = 5.3 m3/d
Cont..
:
Cont..
Biogas generation rate
Not all COD (organic matter) is completely degraded. The fate of
COD during anaerobic treatment process can be viewed as
Residual COD (in effluent)
COD converted to CH4 gas
COD diverted to biomass synthesis
COD utilized for sulfate reduction (if sulfate is present)
(7000 x 10-6)
Total COD removed = ------------- x (2) x 0.85 kg/d
(10-3)
= 11.9 kg/d
:
Cont..
As 10% of the removed COD has been utilized for biomass synthesis
remaining 90% of the removed COD has thus been converted to CH4 gas.
COD utilized for CH4 generation = 11.9 x 0.9 kg/d
= 10.71 kg/d
From eq. (3) in example 1, we have:
1 Kg COD produces 0.35 m3 CH4 at STP
10.71 Kg COD produces ~ 0.35 x 10.71 = 3.75 m3 CH4/d at STP
At 20C, the CH4 gas generation = 3.75 x (293/273)
= 4.02 m3/d
The bio-gas generation rate is larger as it also contains CO2 and H2S4C.02/0.80
= 5.03 m3/d
When the waste contains sulfate, part of COD is diverted to
sulfate reduction and thus total COD available for methane
production would be reduced greatly.
Sulfate-reducing bacteria
Organic matter + Nutrients + SO4
2-  H2S + H2O + HCO3
- + New biomass
Theoretically, 1 g COD is required for reduction of 1.5 g sulfate.
In this problem, there is 2 g/L sulfate.
Total COD consumed in sulfate reduction = 1.33g = 1330 mg
COD available for methane production = (7000 –1330) mg/L
= 5670 mg/L
Methane generation rate when sulfate is present
Cont..
Cont..
(5666.67 x 10-6)
 Total COD available = ----------------- x (2) kg/d
for CH4 generation (10-3)
= 11.33 kg/d
From eq. (3) in example 1, we have:
1 kg COD produces 0.35 m3 CH4 at STP
11.33 kg COD produces ~ 0.35 x 11.33 = 3.97m3 CH4/d at STP
At 20C, the CH4 gas generation = 3.97 x(293/273)
= 4.3 m3/d
The CH4 generation rate when sulfate is present = 4.3 m3/d
Presence of sulfate reduces methane yield by about 19%
However, total biogas will now contain more H2S, adding volume
Cont..
Expanded bed reactor (EBR)
• Expanded bed reactor is an attached growth
system with some suspended biomass.
• The biomass gets attached on bio-carriers
such as sandman, pulverized polyvinyl
chloride, shredded tire beads.
• The bio-carriers are expanded by the upflow
velocity of influent wastewater and recirculated effluent.
• In the expanded bed reactor, sufficient upflow
velocity is maintained to expand the bed by 15-30%.
• The expanded bed reactor has less clogging
problems and better substrate diffusion within the
biofilm.
• The biocarriers are partly supported by fluid flow
and partly by contact with adjacent biocarriers, which
retain the same relative position within the bed.
Fluidized bed reactor (FBR)
• FBR is similar to EBR in terms of configuration.
But FBR is truly fixed film reactor as suspended
biomass is washed–out due to high upflow velocity.
• The bed expansion is 25-300% of the
settled bed volume, which requires much
higher upflow velocity (10-25 m/hr).
• The bio-carriers are supported entirely by
the upflow liquid velocity and therefore able
to move freely in the bed.
• The fluidized bed reactor is free from
clogging problem short-circuiting and better
substrate diffusion within the biofilm.
Hybrid system: UASB/AF
Hybrid system incorporates both
granular sludge blanket (bottom)
and anaerobic filter (top). Such
approach prevents wash-out of
biomass from the reactor. Further
additional treatment at the top bed
due to the retention of sludge
granules that escaped from the
bottom sludge bed.
UASB reactor facing a chronic sludge
wash-out problem can be retrofitted
using this approach.
Hybrid system may be any combi-
nation of two types of reactor
Biogas
Sludge
Anaerobic baffled reactor
In anaerobic baffled reactor, the wastewater passes over
and under the baffles. The biomass accumulates in
Between the baffles which may in fact form granules with
time. The baffles present the horizontal movement of
of biomass in the reactor. Hence a high concentration of
biomass can be maintained within the reactor.
SETTLE DECANT FEED REACT
SETTLED
BIOMASS
SUPERNATANT
DECANT
PORTS
BIOGAS RECYCLE
EFFLUENT FEED
BIOGAS
Anaerobic Sequential Bed Reactor
Anaerobic process design
Design based on volumetric organic
loading rate (VOLR)
So . Q
VOLR = ---------
V
VOLR : Volumetric organic loading rate
(kg COD/m3-day)
So : Wastewater biodegradable COD (mg/L)
Q : Wastewater flow rate (m3/day)
V : Bioreactor volume (m3)
So and Q can be measured easily and are
known upfront
VOLR can be selected!
How do we select VOLR?
 Conducting a pilot scale studies
 Find out removal efficiency at different VOLRs
 Select VOLR based on desired efficiency
VOLR
Efficiency,
%
Design based on hydraulic loading rate
V = a . Q
a . Q
A = --------
H
H : Reactor height (m)
a : Allowable hydraulic retention time (hr)
Q : Wastewater flow rate (m3/h)
A : Surface area of the reactor (m2)
Permissible superficial velocity (Va)
Va = H/ For dilute wastewater with
COD < 1,000 mg/L
Solids retention time (SRT)
An anaerobic digester is a completely mixed reactor for which solid
retention time(SRT) and hydraulic retention time (HRT) is the same.
V, m3
Influent flow rate
(Q), m3/day
HRT, days =
Volume V (m3)
= day
Flow rate Q (m3/day)
For a given SRT (HRT), the size of reactor can be
easily determined since flow rate (Q) is known to us
Digester volume, V (m3) = Flow rate (Q) x SRT (C )
Volatile solids loading rate
The size of an anaerobic digester can also be estimated based
on volatile solids loading rate expressed as kg VS/m3-day.
V, m3
Influent VS
kg/day
Volatile solids
loading rate,
(kg VS/m3- day)
Influent VS (kg/day)
Reactor volume (m3)
=
For a given volatile solids loading rate, the size of reactor can
be easily determined since influent VS (kg/day) is known to us.
Influent VS (kg/day)
Digester volume, V (m3) =
Volatile solids loading rate,(kg VS/m3- day)
Green cow power
Methane for power generation
The digester uses feeder cattle manure from Amana Farms and
industrial and food processing waste from such industries as
Genencor International, Cargill and International Paper’s Cedar
River Mill in Cedar Rapids.
The $4.9 million facility near
West Amana produces
methane biogas that powers
four electric generators.
The system produces about
2.6 MW of power or 15% of
Amana Service Co.’s base load
electricity in winter and 10% in
summer.
What happens to the left-overs?
Common misconceptions about anaerobic digesters include that anaerobic
digestion and the resulting biogas production will reduce the quantity of manure
and the amount of nutrients that remain for utilization or disposal. An anaerobic
digester DOES NOT MAKE MANURE DISAPPEAR! Often the volume of material
(effluent) handled from a digester increases because of required dilution water for
satisfactory pumping or digester operation. On average, only 4% of the influent
manure is converted to biogas. None of the water! The remaining 96% leaves the
digester as an effluent that is stable, rich in nutrients, free of weed seed, reduced
or free of pathogens, and nearly odorless. This means that a farm loading 1,000
gallons per day into a digester can expect to have 960 gallons of material
(effluent) to store and ultimately utilize. Depending on digester design and
operation, solids can also settle out in the bottom of the digester and/or form a
floating scum mat. Both the scum mat and the solids will eventually need to be
mechanically removed from the digester to assure desired performance. When
evaluating the actual performance and operation of a digester, it is important to
determine and account for the amount and type of material retained in the
digester and the cost of lost digester volume and ultimate cleaning.

More Related Content

What's hot

Microbial Biosensors
Microbial  BiosensorsMicrobial  Biosensors
Microbial BiosensorsLaleh Mehryar
 
Treatment of municipal waste and industrial effluents
Treatment of municipal waste and industrial effluentsTreatment of municipal waste and industrial effluents
Treatment of municipal waste and industrial effluentsDr. Naveen Gaurav srivastava
 
BIOREMEDIATION IN PAPER AND PULP INDUSTRY.pptx
BIOREMEDIATION IN PAPER AND PULP INDUSTRY.pptxBIOREMEDIATION IN PAPER AND PULP INDUSTRY.pptx
BIOREMEDIATION IN PAPER AND PULP INDUSTRY.pptxSujithra Chinnathambi
 
Acetic acid production
Acetic acid productionAcetic acid production
Acetic acid productionravi1505
 
Bioremediation
BioremediationBioremediation
BioremediationAnand M
 
BIODEGRADATION OF ORGANIC POLLUTANTS
BIODEGRADATION OF ORGANIC POLLUTANTSBIODEGRADATION OF ORGANIC POLLUTANTS
BIODEGRADATION OF ORGANIC POLLUTANTSAnchal Garg
 
waste water treatment through Algae and Cyanobacteria
 waste water treatment through Algae and Cyanobacteria waste water treatment through Algae and Cyanobacteria
waste water treatment through Algae and Cyanobacteriaiqraakbar8
 
Biosorption process for removal and recovery (1)
Biosorption process for removal and recovery (1)Biosorption process for removal and recovery (1)
Biosorption process for removal and recovery (1)sonumehta217
 
Bioleaching gold recovery
Bioleaching gold recoveryBioleaching gold recovery
Bioleaching gold recoveryDr. sreeremya S
 
BIOTRANSFORMATION OF HEAVY METALS metal impact of heavy metals
BIOTRANSFORMATION OF HEAVY METALS metal impact of heavy metalsBIOTRANSFORMATION OF HEAVY METALS metal impact of heavy metals
BIOTRANSFORMATION OF HEAVY METALS metal impact of heavy metalsKeerthana gopal
 
Microbial Biotransformation of xenobiotic compounds
Microbial Biotransformation of xenobiotic compoundsMicrobial Biotransformation of xenobiotic compounds
Microbial Biotransformation of xenobiotic compoundsPrashant Singam
 
Biodegradation of petroleum hydrocarbons
Biodegradation of petroleum hydrocarbonsBiodegradation of petroleum hydrocarbons
Biodegradation of petroleum hydrocarbonsHamza Shiekh
 
Use of biotechnology in the treatment of municipal wastes and hazardousindust...
Use of biotechnology in the treatment of municipal wastes and hazardousindust...Use of biotechnology in the treatment of municipal wastes and hazardousindust...
Use of biotechnology in the treatment of municipal wastes and hazardousindust...Sijo A
 

What's hot (20)

Microbial Biosensors
Microbial  BiosensorsMicrobial  Biosensors
Microbial Biosensors
 
Bioleaching
BioleachingBioleaching
Bioleaching
 
Treatment of municipal waste and industrial effluents
Treatment of municipal waste and industrial effluentsTreatment of municipal waste and industrial effluents
Treatment of municipal waste and industrial effluents
 
BIOREMEDIATION IN PAPER AND PULP INDUSTRY.pptx
BIOREMEDIATION IN PAPER AND PULP INDUSTRY.pptxBIOREMEDIATION IN PAPER AND PULP INDUSTRY.pptx
BIOREMEDIATION IN PAPER AND PULP INDUSTRY.pptx
 
Biodegradation of hydrocarbon
Biodegradation of hydrocarbonBiodegradation of hydrocarbon
Biodegradation of hydrocarbon
 
Acetic acid production
Acetic acid productionAcetic acid production
Acetic acid production
 
Bioremediation
BioremediationBioremediation
Bioremediation
 
BIODEGRADATION OF ORGANIC POLLUTANTS
BIODEGRADATION OF ORGANIC POLLUTANTSBIODEGRADATION OF ORGANIC POLLUTANTS
BIODEGRADATION OF ORGANIC POLLUTANTS
 
Bioreactors ppt atun
Bioreactors ppt atunBioreactors ppt atun
Bioreactors ppt atun
 
waste water treatment through Algae and Cyanobacteria
 waste water treatment through Algae and Cyanobacteria waste water treatment through Algae and Cyanobacteria
waste water treatment through Algae and Cyanobacteria
 
Biomineralization
BiomineralizationBiomineralization
Biomineralization
 
bio leaching
bio leachingbio leaching
bio leaching
 
Biosorption process for removal and recovery (1)
Biosorption process for removal and recovery (1)Biosorption process for removal and recovery (1)
Biosorption process for removal and recovery (1)
 
Bioleaching gold recovery
Bioleaching gold recoveryBioleaching gold recovery
Bioleaching gold recovery
 
Biosorption
BiosorptionBiosorption
Biosorption
 
BIOTRANSFORMATION OF HEAVY METALS metal impact of heavy metals
BIOTRANSFORMATION OF HEAVY METALS metal impact of heavy metalsBIOTRANSFORMATION OF HEAVY METALS metal impact of heavy metals
BIOTRANSFORMATION OF HEAVY METALS metal impact of heavy metals
 
Bioleaching
BioleachingBioleaching
Bioleaching
 
Microbial Biotransformation of xenobiotic compounds
Microbial Biotransformation of xenobiotic compoundsMicrobial Biotransformation of xenobiotic compounds
Microbial Biotransformation of xenobiotic compounds
 
Biodegradation of petroleum hydrocarbons
Biodegradation of petroleum hydrocarbonsBiodegradation of petroleum hydrocarbons
Biodegradation of petroleum hydrocarbons
 
Use of biotechnology in the treatment of municipal wastes and hazardousindust...
Use of biotechnology in the treatment of municipal wastes and hazardousindust...Use of biotechnology in the treatment of municipal wastes and hazardousindust...
Use of biotechnology in the treatment of municipal wastes and hazardousindust...
 

Similar to Anaerobic-treatment-and-biogas-sbozjj.ppt

CH-3. Anaerobic treatment of wastewater
CH-3. Anaerobic treatment of wastewaterCH-3. Anaerobic treatment of wastewater
CH-3. Anaerobic treatment of wastewaterTadviDevarshi
 
Uasb water treatment process
Uasb water treatment processUasb water treatment process
Uasb water treatment processSakil Ahmed
 
Biomethanation of organic waste, Anaerobic degradation,Degradation of organic...
Biomethanation of organic waste, Anaerobic degradation,Degradation of organic...Biomethanation of organic waste, Anaerobic degradation,Degradation of organic...
Biomethanation of organic waste, Anaerobic degradation,Degradation of organic...salinsasi
 
Biotechnology in Industrial Waste water Treatment
Biotechnology in Industrial Waste water TreatmentBiotechnology in Industrial Waste water Treatment
Biotechnology in Industrial Waste water Treatmentshuaibumusa2012
 
Biohydrogen production
Biohydrogen productionBiohydrogen production
Biohydrogen productionThulasiPadi
 
ABG_Anaerobic process_sludge and sewage-1.pptx
ABG_Anaerobic process_sludge and sewage-1.pptxABG_Anaerobic process_sludge and sewage-1.pptx
ABG_Anaerobic process_sludge and sewage-1.pptxssuser77047f
 
Factors affecting biogas production during anaerobic decomposition of brewery...
Factors affecting biogas production during anaerobic decomposition of brewery...Factors affecting biogas production during anaerobic decomposition of brewery...
Factors affecting biogas production during anaerobic decomposition of brewery...Alexander Decker
 
MECHANISM OF ANAEROBIC BIODEGRADATION new.pptx
MECHANISM OF ANAEROBIC BIODEGRADATION new.pptxMECHANISM OF ANAEROBIC BIODEGRADATION new.pptx
MECHANISM OF ANAEROBIC BIODEGRADATION new.pptxmuskanmahajan24
 
Biogas production.pptx
Biogas production.pptxBiogas production.pptx
Biogas production.pptxBangaluru
 
Fermentation ppt
Fermentation pptFermentation ppt
Fermentation pptpkdsshukla
 
Advanced Training Wastewater Treatment.ppt
Advanced Training Wastewater Treatment.pptAdvanced Training Wastewater Treatment.ppt
Advanced Training Wastewater Treatment.pptMohammedHassan901292
 
04 biological anaerobic system.pptx
04 biological anaerobic system.pptx04 biological anaerobic system.pptx
04 biological anaerobic system.pptxDinarodiana1
 
Anaerobic digestion (ad) of biomass renewable energy resources
Anaerobic digestion (ad) of biomass renewable energy resourcesAnaerobic digestion (ad) of biomass renewable energy resources
Anaerobic digestion (ad) of biomass renewable energy resourcesDrBilalAhmadZafarAmi
 
MEGPL-PWTP Plant
MEGPL-PWTP PlantMEGPL-PWTP Plant
MEGPL-PWTP PlantAnil Sawant
 
Sewage ppt new vijay2
Sewage ppt new vijay2Sewage ppt new vijay2
Sewage ppt new vijay2Vijay Karhale
 
Biological Basis of Wastewater Treatment.pptx
Biological Basis of Wastewater Treatment.pptxBiological Basis of Wastewater Treatment.pptx
Biological Basis of Wastewater Treatment.pptxNevinYagci1
 

Similar to Anaerobic-treatment-and-biogas-sbozjj.ppt (20)

CH-3. Anaerobic treatment of wastewater
CH-3. Anaerobic treatment of wastewaterCH-3. Anaerobic treatment of wastewater
CH-3. Anaerobic treatment of wastewater
 
Uasb water treatment process
Uasb water treatment processUasb water treatment process
Uasb water treatment process
 
Biomethanation of organic waste, Anaerobic degradation,Degradation of organic...
Biomethanation of organic waste, Anaerobic degradation,Degradation of organic...Biomethanation of organic waste, Anaerobic degradation,Degradation of organic...
Biomethanation of organic waste, Anaerobic degradation,Degradation of organic...
 
Biotechnology in Industrial Waste water Treatment
Biotechnology in Industrial Waste water TreatmentBiotechnology in Industrial Waste water Treatment
Biotechnology in Industrial Waste water Treatment
 
Biohydrogen production
Biohydrogen productionBiohydrogen production
Biohydrogen production
 
ABG_Anaerobic process_sludge and sewage-1.pptx
ABG_Anaerobic process_sludge and sewage-1.pptxABG_Anaerobic process_sludge and sewage-1.pptx
ABG_Anaerobic process_sludge and sewage-1.pptx
 
Factors affecting biogas production during anaerobic decomposition of brewery...
Factors affecting biogas production during anaerobic decomposition of brewery...Factors affecting biogas production during anaerobic decomposition of brewery...
Factors affecting biogas production during anaerobic decomposition of brewery...
 
MECHANISM OF ANAEROBIC BIODEGRADATION new.pptx
MECHANISM OF ANAEROBIC BIODEGRADATION new.pptxMECHANISM OF ANAEROBIC BIODEGRADATION new.pptx
MECHANISM OF ANAEROBIC BIODEGRADATION new.pptx
 
Biogas production.pptx
Biogas production.pptxBiogas production.pptx
Biogas production.pptx
 
Fermentation ppt
Fermentation pptFermentation ppt
Fermentation ppt
 
Advanced Training Wastewater Treatment.ppt
Advanced Training Wastewater Treatment.pptAdvanced Training Wastewater Treatment.ppt
Advanced Training Wastewater Treatment.ppt
 
04 biological anaerobic system.pptx
04 biological anaerobic system.pptx04 biological anaerobic system.pptx
04 biological anaerobic system.pptx
 
Anaerobic digestion (ad) of biomass renewable energy resources
Anaerobic digestion (ad) of biomass renewable energy resourcesAnaerobic digestion (ad) of biomass renewable energy resources
Anaerobic digestion (ad) of biomass renewable energy resources
 
MEGPL-PWTP Plant
MEGPL-PWTP PlantMEGPL-PWTP Plant
MEGPL-PWTP Plant
 
Rain and soil
Rain and soilRain and soil
Rain and soil
 
Traning material
Traning materialTraning material
Traning material
 
Sewage ppt new vijay2
Sewage ppt new vijay2Sewage ppt new vijay2
Sewage ppt new vijay2
 
Biological Basis of Wastewater Treatment.pptx
Biological Basis of Wastewater Treatment.pptxBiological Basis of Wastewater Treatment.pptx
Biological Basis of Wastewater Treatment.pptx
 
Biogas
BiogasBiogas
Biogas
 
_Biogas .pptx
_Biogas .pptx_Biogas .pptx
_Biogas .pptx
 

Recently uploaded

Cot curve, melting temperature, unique and repetitive DNA
Cot curve, melting temperature, unique and repetitive DNACot curve, melting temperature, unique and repetitive DNA
Cot curve, melting temperature, unique and repetitive DNACherry
 
CYTOGENETIC MAP................ ppt.pptx
CYTOGENETIC MAP................ ppt.pptxCYTOGENETIC MAP................ ppt.pptx
CYTOGENETIC MAP................ ppt.pptxCherry
 
CURRENT SCENARIO OF POULTRY PRODUCTION IN INDIA
CURRENT SCENARIO OF POULTRY PRODUCTION IN INDIACURRENT SCENARIO OF POULTRY PRODUCTION IN INDIA
CURRENT SCENARIO OF POULTRY PRODUCTION IN INDIADr. TATHAGAT KHOBRAGADE
 
GBSN - Biochemistry (Unit 3) Metabolism
GBSN - Biochemistry (Unit 3) MetabolismGBSN - Biochemistry (Unit 3) Metabolism
GBSN - Biochemistry (Unit 3) MetabolismAreesha Ahmad
 
Reboulia: features, anatomy, morphology etc.
Reboulia: features, anatomy, morphology etc.Reboulia: features, anatomy, morphology etc.
Reboulia: features, anatomy, morphology etc.Cherry
 
X-rays from a Central “Exhaust Vent” of the Galactic Center Chimney
X-rays from a Central “Exhaust Vent” of the Galactic Center ChimneyX-rays from a Central “Exhaust Vent” of the Galactic Center Chimney
X-rays from a Central “Exhaust Vent” of the Galactic Center ChimneySérgio Sacani
 
Site specific recombination and transposition.........pdf
Site specific recombination and transposition.........pdfSite specific recombination and transposition.........pdf
Site specific recombination and transposition.........pdfCherry
 
The Mariana Trench remarkable geological features on Earth.pptx
The Mariana Trench remarkable geological features on Earth.pptxThe Mariana Trench remarkable geological features on Earth.pptx
The Mariana Trench remarkable geological features on Earth.pptxseri bangash
 
Concept of gene and Complementation test.pdf
Concept of gene and Complementation test.pdfConcept of gene and Complementation test.pdf
Concept of gene and Complementation test.pdfCherry
 
Use of mutants in understanding seedling development.pptx
Use of mutants in understanding seedling development.pptxUse of mutants in understanding seedling development.pptx
Use of mutants in understanding seedling development.pptxRenuJangid3
 
Porella : features, morphology, anatomy, reproduction etc.
Porella : features, morphology, anatomy, reproduction etc.Porella : features, morphology, anatomy, reproduction etc.
Porella : features, morphology, anatomy, reproduction etc.Cherry
 
Genome Projects : Human, Rice,Wheat,E coli and Arabidopsis.
Genome Projects : Human, Rice,Wheat,E coli and Arabidopsis.Genome Projects : Human, Rice,Wheat,E coli and Arabidopsis.
Genome Projects : Human, Rice,Wheat,E coli and Arabidopsis.Cherry
 
Pteris : features, anatomy, morphology and lifecycle
Pteris : features, anatomy, morphology and lifecyclePteris : features, anatomy, morphology and lifecycle
Pteris : features, anatomy, morphology and lifecycleCherry
 
LUNULARIA -features, morphology, anatomy ,reproduction etc.
LUNULARIA -features, morphology, anatomy ,reproduction etc.LUNULARIA -features, morphology, anatomy ,reproduction etc.
LUNULARIA -features, morphology, anatomy ,reproduction etc.Cherry
 
Human genetics..........................pptx
Human genetics..........................pptxHuman genetics..........................pptx
Human genetics..........................pptxCherry
 
Cyanide resistant respiration pathway.pptx
Cyanide resistant respiration pathway.pptxCyanide resistant respiration pathway.pptx
Cyanide resistant respiration pathway.pptxCherry
 
Plasmid: types, structure and functions.
Plasmid: types, structure and functions.Plasmid: types, structure and functions.
Plasmid: types, structure and functions.Cherry
 
GBSN - Microbiology (Unit 3)Defense Mechanism of the body
GBSN - Microbiology (Unit 3)Defense Mechanism of the body GBSN - Microbiology (Unit 3)Defense Mechanism of the body
GBSN - Microbiology (Unit 3)Defense Mechanism of the body Areesha Ahmad
 
Human & Veterinary Respiratory Physilogy_DR.E.Muralinath_Associate Professor....
Human & Veterinary Respiratory Physilogy_DR.E.Muralinath_Associate Professor....Human & Veterinary Respiratory Physilogy_DR.E.Muralinath_Associate Professor....
Human & Veterinary Respiratory Physilogy_DR.E.Muralinath_Associate Professor....muralinath2
 

Recently uploaded (20)

Cot curve, melting temperature, unique and repetitive DNA
Cot curve, melting temperature, unique and repetitive DNACot curve, melting temperature, unique and repetitive DNA
Cot curve, melting temperature, unique and repetitive DNA
 
CYTOGENETIC MAP................ ppt.pptx
CYTOGENETIC MAP................ ppt.pptxCYTOGENETIC MAP................ ppt.pptx
CYTOGENETIC MAP................ ppt.pptx
 
CURRENT SCENARIO OF POULTRY PRODUCTION IN INDIA
CURRENT SCENARIO OF POULTRY PRODUCTION IN INDIACURRENT SCENARIO OF POULTRY PRODUCTION IN INDIA
CURRENT SCENARIO OF POULTRY PRODUCTION IN INDIA
 
ABHISHEK ANTIBIOTICS PPT MICROBIOLOGY // USES OF ANTIOBIOTICS TYPES OF ANTIB...
ABHISHEK ANTIBIOTICS PPT MICROBIOLOGY  // USES OF ANTIOBIOTICS TYPES OF ANTIB...ABHISHEK ANTIBIOTICS PPT MICROBIOLOGY  // USES OF ANTIOBIOTICS TYPES OF ANTIB...
ABHISHEK ANTIBIOTICS PPT MICROBIOLOGY // USES OF ANTIOBIOTICS TYPES OF ANTIB...
 
GBSN - Biochemistry (Unit 3) Metabolism
GBSN - Biochemistry (Unit 3) MetabolismGBSN - Biochemistry (Unit 3) Metabolism
GBSN - Biochemistry (Unit 3) Metabolism
 
Reboulia: features, anatomy, morphology etc.
Reboulia: features, anatomy, morphology etc.Reboulia: features, anatomy, morphology etc.
Reboulia: features, anatomy, morphology etc.
 
X-rays from a Central “Exhaust Vent” of the Galactic Center Chimney
X-rays from a Central “Exhaust Vent” of the Galactic Center ChimneyX-rays from a Central “Exhaust Vent” of the Galactic Center Chimney
X-rays from a Central “Exhaust Vent” of the Galactic Center Chimney
 
Site specific recombination and transposition.........pdf
Site specific recombination and transposition.........pdfSite specific recombination and transposition.........pdf
Site specific recombination and transposition.........pdf
 
The Mariana Trench remarkable geological features on Earth.pptx
The Mariana Trench remarkable geological features on Earth.pptxThe Mariana Trench remarkable geological features on Earth.pptx
The Mariana Trench remarkable geological features on Earth.pptx
 
Concept of gene and Complementation test.pdf
Concept of gene and Complementation test.pdfConcept of gene and Complementation test.pdf
Concept of gene and Complementation test.pdf
 
Use of mutants in understanding seedling development.pptx
Use of mutants in understanding seedling development.pptxUse of mutants in understanding seedling development.pptx
Use of mutants in understanding seedling development.pptx
 
Porella : features, morphology, anatomy, reproduction etc.
Porella : features, morphology, anatomy, reproduction etc.Porella : features, morphology, anatomy, reproduction etc.
Porella : features, morphology, anatomy, reproduction etc.
 
Genome Projects : Human, Rice,Wheat,E coli and Arabidopsis.
Genome Projects : Human, Rice,Wheat,E coli and Arabidopsis.Genome Projects : Human, Rice,Wheat,E coli and Arabidopsis.
Genome Projects : Human, Rice,Wheat,E coli and Arabidopsis.
 
Pteris : features, anatomy, morphology and lifecycle
Pteris : features, anatomy, morphology and lifecyclePteris : features, anatomy, morphology and lifecycle
Pteris : features, anatomy, morphology and lifecycle
 
LUNULARIA -features, morphology, anatomy ,reproduction etc.
LUNULARIA -features, morphology, anatomy ,reproduction etc.LUNULARIA -features, morphology, anatomy ,reproduction etc.
LUNULARIA -features, morphology, anatomy ,reproduction etc.
 
Human genetics..........................pptx
Human genetics..........................pptxHuman genetics..........................pptx
Human genetics..........................pptx
 
Cyanide resistant respiration pathway.pptx
Cyanide resistant respiration pathway.pptxCyanide resistant respiration pathway.pptx
Cyanide resistant respiration pathway.pptx
 
Plasmid: types, structure and functions.
Plasmid: types, structure and functions.Plasmid: types, structure and functions.
Plasmid: types, structure and functions.
 
GBSN - Microbiology (Unit 3)Defense Mechanism of the body
GBSN - Microbiology (Unit 3)Defense Mechanism of the body GBSN - Microbiology (Unit 3)Defense Mechanism of the body
GBSN - Microbiology (Unit 3)Defense Mechanism of the body
 
Human & Veterinary Respiratory Physilogy_DR.E.Muralinath_Associate Professor....
Human & Veterinary Respiratory Physilogy_DR.E.Muralinath_Associate Professor....Human & Veterinary Respiratory Physilogy_DR.E.Muralinath_Associate Professor....
Human & Veterinary Respiratory Physilogy_DR.E.Muralinath_Associate Professor....
 

Anaerobic-treatment-and-biogas-sbozjj.ppt

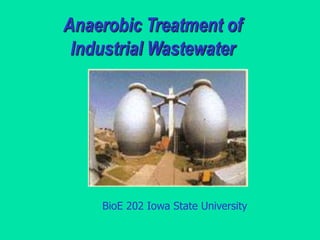
  • 1. Anaerobic Treatment of Industrial Wastewater BioE 202 Iowa State University
  • 2. Anaerobic Waste Treatment : An Overview Historical development Mainly used for reducing mass of high solids wastes, e.g. human waste (nightsoil), animal manure, agricultural waste and sludge. Early applications of anaerobic waste treatment include: • Mouras automatic scavenger - cited in French journal Cosmos in 1881 • Septic tank- developed by Donald Cameron in 1895 (England) • Imhoff tank: developed by Karl Imhoff in 1905 (Germany)
  • 3. Popularity of anaerobic processes Energy crisis in 70 and 80’s- a renewed interest in anaerobic process 0 200 400 600 800 1000 1200 1978 1981 1984 1987 1990 1993 1996 1999 No. of plants Anaerobic treatment plants for industrial applications (Source: Franklin, 2001)
  • 4. Anaerobic treatment within wastewater processing Domestic wastewater (100) Preliminary treatment Bar screen, Comminutor Grit chamber etc. Primary sedimentation (100) Primary sludge (35) Aerobic treatment (65) e.g. Activated sludge, Trickling filter, RBC Secondary sedimentation Oxidized to CO2 (30) Converted to sludge (35) Secondary sludge (25) Effluent (10) Anaerobic digester (60)
  • 5. Anaerobic treatment of solids How do we achieve high SRT in anaerobic treatment systems? Anaerobic treatment of high solids such as animal manure, biological sludge, nightsoil, etc. is commonly known as “anaerobic digestion” and is carried out in airtight container known as an anaerobic digester (AD).  AD is usually a continuous flow stirred tank reactor (CFSTR) for which HRT ~ SRT  Design based on volatile solids (VS) loading rate  Anaerobic treatment of wastewaters requires a long SRT to achieve better treatment efficiency  The ratio of SRT/HRT ~ 10-100  The high ratio allows the slow-growing methanogens to remain in the reactor for a longer time
  • 6. Anaerobic Waste Treatment Anaerobic treatment is a biological process carried out in the absence of O2 for the stabilization of organic materials by conversion to CH4 and inorganic end-products such as CO2 and NH3 Organic materials + Nutrients CH4 + CO2 +NH3 + Biomass Anaerobic microbes Anaerobic processes Anaerobic fermentation Anaerobic respiration
  • 7. Anaerobic fermentation In anaerobic fermentation, there is no external electron acceptor. The product generated during the process accepts the electrons released during the breakdown of organic matter. Thus, organic matter acts as both electron donor and acceptor. The process releases less energy and the major portion of the energy is still contained in the fermentative product such as ethanol. Glucose Pyruvate Energy Electron Ethanol Anaerobic fermentation of glucose to ethanol
  • 8. Anaerobic respiration Anaerobic respiration on the other hand requires external electron acceptor. The electron acceptors in this case could be SO4 2-, NO3 - or CO2. The energy released under such a condition is higher than anaerobic fermentation. Glucose Pyruvate Energy Electron CO2 + H2O SO4 2- CO2 NO3 - H2S CH4 N2 Anaerobic respiration of glucose, preference for electron acceptors O2 > NO3 - > SO4 2- > CO2
  • 9. Advantage of anaerobic processes 1. Less energy requirement as no aeration is needed 0.5-0.75 kWh energy is needed for every 1 kg of COD removal by aerobic processes 2. Energy generation in the form of methane gas 1.16 kWh energy is produced for every 1 kg of COD fermented in anaerobic process 3. Less biomass (sludge) generation Anaerobic process produces only 20% of sludge compared with aerobic process Soluble BOD 1 kg Aerobic process CO2 + H2O 0.5 kg New biomass 0.5 kg Biodegradable COD 1 kg Anaerobic process CH4 gas > 0.9 kg New biomass < 0.1 kg
  • 10. 4. Less nutrients (N & P) required Lower biomass synthesis rate also implies less nutrients requirement : 20% of aerobic 5. Application of higher organic loading rate Organic loading rates of 5-10 times higher than that of aerobic processes are possible 6. Space saving Higher loading rates require smaller reactor volumes thereby saving on disposal cost 7. Ability to transform several hazardous solvents including chloroform, trichloroethylene and trichloroethane to an easily degradable form …Advantages of anaerobic processes
  • 11. Limitations of anaerobic processes 1. Long start-up time Because of lower biomass synthesis rate, it requires a longer start-up time to attain a biomass concentration 2. Long recovery time If an anaerobic system is subjected to disturbances either due to biomass wash-out, toxic substances or shock loading, it may take longer time for the system to return to normal operating conditions 3. Specific nutrients/trace metal requirements Anaerobic microorganisms, especially methanogens, have specific nutrients e.g. Fe, Ni, and Co requirement for optimum growth 4. More susceptible to changes in environmental conditions Anaerobic microorganisms especially methanogens are prone to changes in conditions such as temperature, pH, redox potential, etc.
  • 12. 5. Treatment of sulfate-rich wastewater The presence of sulfate not only reduces the methane yield due to substrate Competition, but also inhibits the methanogens due to sulfide production 6. Effluent quality of treated wastewater The minimum substrate concentration (Smin) from which microorganisms are able to generate energy for their growth and maintenance is much higher for anaerobic treatment systems. Anaerobic processes may not be able to degrade organic matter to the level to meet the discharge limits for ultimate disposal. 7. Treatment of high protein & nitrogen containing wastewater The anaerobic degradation of proteins produces amines which are no longer be degraded anaerobically. Similarly nitrogen remains unchanged during anaerobic treatment. Recently, a process called ANAMMOX ( ANaerobic AMMonium OXididation) has been developed to anaerobically oxidize NH4 + to N2 in presence of nitrite. NH4 + + NO2 -  N2 + 2H2O …Limitations of anaerobic processes NH4 + + 1.32 NO2 - + 0.066CO2 + 0.13H+  1.02 N2 + 0.26NO3 - + 0.066CH2O0.5N0.15
  • 13. Comparison between anaerobic and aerobic processes Anaerobic Aerobic Organic loading rate High loading rates:10-40 kg COD/m3-day Low loading rates:0.5-1.5 kg COD/m3-day (for high rate reactors, e.g. AF,UASB, E/FBR) (for activated sludge process) Biomass yield Low biomass yield:0.05-0.15 kg VSS/kg COD High biomass yield:0.35-0.45 kg VSS/kg COD (biomass yield is not constant but depends on types of substrates metabolized) (biomass yield is fairly constant irrespective of types of substrates metabolized) Specific substrate utilization rate High rate: 0.75-1.5 kg COD/kg VSS-day Low rate: 0.15-0.75 kg COD/kg VSS-day Start-up time Long start-up: 1-2 months for mesophilic : 2-3 months for thermophilic Short start-up: 1-2 weeks
  • 14. Anaerobic Aerobic SRT Longer SRT is essential to retain the slow growing methanogens within the reactor Microbiology Anaerobic processes involve multi-step chemical conversions and a diverse group of microorganisms degrade the organic matter in a sequential order Aerobic process is mainly a one- species phenomenon, except for nutrient-removal processes Environmental factors The process is highly susceptible to changes in environmental conditions SRT of 4-10 days is enough for the activated sludge process The process is more robust to changing environmental conditions Comparison between anaerobic and aerobic processes
  • 15. How much methane gas can be generated through complete anaerobic degradation of 1 kg COD at STP ? Step 2: Conversion of CH4 mass to equivalent volume Based on the ideal gas law, 1 mole of any gas at STP (Standard Temperature and Pressure) occupies a volume of 22.4 L  1 Mole CH4 ~ 22.4 L CH4  16 g CH4 ~ 22.4 L CH4  1 g CH4 ~ 22.4/16 = 1.4 L CH4 ---------- (2) Step 1: Calculation of COD equivalence of CH4 CH4 + 2O2  CO2 + 2H2O 16 g 64g  16 g CH4 ~ 64 g O2 (COD)  1 g CH4 ~ 64/16 = 4 g COD ------------ (1)
  • 16. Step 3: CH4 generation rate per unit of COD removed From eq. (1) and eq. (2), we have, => 1 g CH4 ~ 4 g COD ~ 1.4 L CH4 => 4 g COD ~ 1.4 L CH4 => 1 g COD ~ 1.4/4 = 0.35 LCH4 or 1 Kg COD ~ 0.35 m3 CH4 ----------- (3) Complete anaerobic degradation of 1 kg COD produces 0.35 m3 CH4 at STP
  • 17. Methane Carbon dioxide COMPLEX ORGANIC MATTER Proteins Carbohydrates Lipids Amino Acids, Sugars Fatty Acids, Alcohols hydrolysis INTERMEDIARY PRODUCTS (C>2; Propionate, Butyrate etc) acidogenesis Acetate Hydrogen, Carbon dioxide acetogenesis Organics Conversion in Anaerobic Systems methanogenesis 72 28
  • 18. Process Microbiology The anaerobic degradation of complex organic matter is carried out by a series of bacteria and archeae as indicated in the figure (with numbers). There exists a coordinated interaction among these microbes. The process may fail if a certain of these organisms are inhibited. Fermentative bacteria (1) This group of bacteria is responsible for the first stage of anaerobic digestion - hydrolysis and acidogenesis. These bacteria are either facultative or strict anaerobes. The anaerobic species belonging to the family of Streptococcaceae and Enterobacteriaceae and to the genera of Bacteroides, Clostridium, Butyrivibrio, Eubacterium, Bifidobacterium and Lactobacillus are most common.
  • 19. Syntrophic association of acetogenic organisms with methanogenic H2- consuming bacteria helps to lower the concentration of H2 below inhibitory level so that propionate degrading bacteria are not suppressed by excessive H2 level H2 partial pressure 10-2 (100 ppm) This group of bacteria metabolizes propionate and other organic acids (>C-2), alcohols and certain aromatic compounds (i.e. benzoate) into acetate and CO2 Hydrogen producing acetogenic bacteria (2) CH3CH2COO -  CH3COO - + CO2 + H2
  • 20. Homoacetogenes (3) Homoacetogenesis has gained much attention in recent years in anaerobic processes due to its final product: acetate, which is the important precursor to methane generation. The bacteria are, H2 and CO2 users. Clostridium aceticum and Acetobacterium woodii are the two homoacetogenic bacteria isolated from the sewage sludge. Homoacetogenic bacteria have a high thermodynamic efficiency; as a result there is no accumulation H2 and CO2 during growth on multi-carbon compounds. CO2 + H2  CH3COOH + 2H2O
  • 21. Methanogens (4 and 5) Methanogens are unique domain of microbes classified as Archeae, distinguished from Bacteria by a number of characteristics, including the possession of membrane lipids, absence of the basic cellular characteristics (e. g. peptidoglycan) and distinctive ribosomal RNA. Methanogens are obligate anaerobes and considered as a rate-limiting species in anaerobic treatment of wastewater. Moreover, methanogens co-exist or compete with sulfate-reducing bacteria for the substrates in anaerobic treatment of sulfate-laden wastewater. Two classes of methanogens that metabolize acetate to methane are: • Methanosaeta (old name Methanothrix): Rod shape, low Ks, high affinity • Methanosarcina (also known as M. mazei): Spherical shape, high Ks, low affinity
  • 22. Methanosaeta Methanosarcina Growth kinetics of Methanosaeta andMethanosarcina
  • 23. Essential conditions for efficient anaerobic treatment • Enough nutrients (N & P) and trace metals especially, Fe, Co, Ni, etc. COD:N:P = 350:7:1 (for highly loaded system) 1000:7:1 (lightly loaded system) • Avoid excessive air/O2 exposure • No toxic/inhibitory compounds present in the influent • Maintain pH between 6.8 –7.2 • Sufficient alkalinity present (mainly bicarbonates) • Low volatile fatty acids (VFAs) • Temperature around mesophilic range (30-38 oC) • SRT/HRT >>1 (use high rate anaerobic reactors)
  • 24. Best industrial wastewaters for anaerobic treatment • Alcohol production • Brewery and Winery • Sugar processing • Starch (barley, corn, potato, wheat, tapioca) and desizing waste from textile industry. • Food processing • Bakery plant • Pulp and paper • Dairy • Slaughterhouse • Petrochemical waste
  • 25. Environmental factors The successful operation of anaerobic reactor depends on maintaining the environmental factors close to the comfort of the microorganisms involved in the process. Temperature  Anaerobic processes like other biological processes operate in certain temperature ranges  In anaerobic systems: three optimal temperature ranges:  Psychrophilic (5 - 15oC)  Mesophilic (35 – 40 C)  Thermophilic (50-55 oC)
  • 26. Effect of temperature on anaerobic activity Rule of thumb: Rate of a reaction doubles for every 10 oC rise in temperature up to an optimum and then declines rapidly
  • 27. pH There exist two microbial domains in terms of pH optima namely acidogens and methanogens. The best pH range for acidogens is 5.5 – 6.5 and for methanogens is 7.8 – 8.2. The operating pH for combined cultures is 6.8-7.4 with neutral pH being the optimum. Since methano- genesis is considered as a rate limiting step, it is necessary to maintain the reactor pH close to neutral. Low pH reduces the activity of methanogens causing accumulation of VFA and H2. At higher partial pressure of H2, propionic acid degrading bacteria will be severely inhibited thereby causing excessive accumulation of higher molecular weight VFAs such as propionic and butyric acids and the pH drops further. If the situation is left uncorrected, the process may eventually fail. This condition is known as going “SOUR” or STUCK”. Remedial measures: Reduce the loading rates and supplement chemicals to adjust the pH: alkaline chemicals such as NaHCO3, NaOH, Na2CO3, quick lime (CaO), slaked lime [Ca(OH)2], limestone (or softening sludge) CaCO3, and NH3 can be used.
  • 28. Cont.. Relative activity of methanogens to pH 0.0 0.3 0.5 0.8 1.0 1.3 3 4 5 6 7 8 9 10 11 pH Activity pH dependence of methanogens
  • 29. An anaerobic treatment system has its own buffering capacity against pH drop because of alkalinity produced during waste treatment: e.g. the degradation of protein present in the waste releases NH3, which reacts with CO2 forming ammonium carbonate as alkalinity. NH3 + H2O + CO2  NH4HCO3 The degradation of salt of fatty acids may produce some alkalinity. CH3COONa + H2O  CH4 + NaHCO3 Sulfate and sulfite reduction also generate alkalinity. CH3COO - + SO4 2-  HS- + HCO3 - + 3H2O When pH starts to drop due to VFA accumulation, the alkalinity present within the system neutralizes the acid and prevents further drop in pH. If the alkalinity is not enough to buffer the system pH, we need external additions. Cont.. Natural buffering
  • 30. All microbial processes including anaerobic require macro (N, P and S) and micro (trace metals) nutrients in sufficient concentration to support biomass synthesis. Anaerobic micro-organisms, especially methanogens, have specific requirements of trace metals such as Ni, Co, Fe, Mo, Se etc. The nutrients and trace metals requirements for anaerobic process are much lower as only 4 - 10% of the COD removed is converted to biomass. Nutrients and trace metals Inhibition/Toxicity The toxicity is caused by substances present in the influent waste or byproducts of metabolic activities. Heavy metals, halogenated compounds, and cyanide are examples of the former type whereas sulfide and VFAs belong to latter . Ammonia from either group Cont.. COD:N:P = 350:7:1 (for highly loaded system) 1000:7:1 (lightly loaded system)
  • 31. Types of anaerobic reactors Low-rate anaerobic reactors High-rate anaerobic reactors Anaerobic pond Septic tank Standard rate anaerobic digester Imhoff tank Slurry type bioreactor, temperature, mixing, SRT or other environmental conditions are not regulated. Loading of 1-2 kg COD/m3-day Anaerobic sequencing batch reactor (ASBR) Anaerobic contact process Anaerobic filter (AF) Upflow anaerobic sludge blanket (UASB) Fluidized bed reactor Hybrid reactor: UASB/AF Able to retain very high concentration of active biomass in the reactor. Thus extremely high SRT could be maintained irrespective of HRT. Load 5-20 kg COD/m3-d COD removal efficiency : 80-90%
  • 32. Anaerobic contact process (ACP) Influent Effluent Waste sludge Recycled sludge Completely mixed reactor Biogas Degassifier Biogas Settling tank Anaerobic contact process is essentially an anaerobic activated sludge process. It consists of a completely mixed reactor followed by a settling tank. The settled biomass is recycled back to the reactor. Hence ACP is able to maintain high concentration of biomass in the reactor and thus high SRT irrespective of HRT. Degasifier allows the removal of biogas bubbles (CO2, CH4) attached to sludge which may otherwise float to the surface. .
  • 33. ACP was initially developed for the treatment of dilute wastewater such as meat packing plant which had tendency to form a settleable flocs. ACP is suitable for the treatment of wastewater containing suspended solids which render the microorganisms to attach and form settleable flocs. The biomass concentration in the reactor ranges from 4-6 g/L with maximum concentration as high as 25-30 g/L depending on settleability of sludge. The loading rate ranges from 0.5 – 10 kg COD/m3-day. The required SRT could be maintained by controlling the recycle rate similar to activated sludge process. Cont.. …Anaerobic contact process (ACP)
  • 34. Anaerobic filter • Developed by Young and McCarty in the late 1960s to treat dilute soluble organic wastes • The filter was filled with rocks similar to the trickling filter • Wastewater distributed across the bottom and the flow was in the upward direction through a bed of rocks • Whole filter submerged completely • Anaerobic microorganisms accumulate within voids of media (rocks or other plastic media) • The media retain or hold the active biomass within the filter • The non-attached biomass within the interstices forms bigger flocs of granular shape due to rising gas bubble/liquid • Non-attached biomass contributes significantly to waste treatment • Attached biomass not be a major portion of total biomass • 64% attached and 36% non-attached
  • 35. Feeding tank at 4oC Biogas Effluent Peristaltic pump Media Perforated Al plate Sampling port Heater Constant temperature recirculation line Water bath Peristaltic pump Sludge wastage Upflow Anaerobic Filter
  • 36. Originally, rocks were employed as packing medium in anaerobic filter. But due to very low void volume (40-50%), serious clogging problems were witnessed. Now, many synthetic packing media are made up of plastics; ceramic tiles of different configuration have been used in anaerobic filters. The void volume in these media ranges from 85-95 %. Moreover, these media provide high specific surface area, typically 100 m2/m3, or above, which enhances biofilm growth. Cont.. Anaerobic Filter Packing
  • 37. Downflow anaerobic filters are similar to a trickling filter in operation. DAF is closer to fixed film reactor as loosely held biomass/sludge within the void spaces is potentially washed out of the reactor. The specific surface area of media is more important in DAF than UAF. There is less of a clogging problem and wastewater with some SS concentration can be treated using DAF. Downflow anaerobic filter (DAF) Cont.. Since anaerobic filters are able to retain high biomass, a long SRT can be maintained. Typically HRT varies from 0.5 – 4 days and the loading rates vary from 5 - 15 kg COD/m3-day. Biomass wastage is generally not needed and hydrodynamic conditions play an important role in biomass retention within the void space. Anaerobic Filters
  • 38. Upflow Anaerobic Sludge Blanket (UASB) UASB was developed in 1970s by Lettinga in the Netherlands. UASB is essentially a suspended growth system in which proper hydraulic and organic loading rate is maintained in order to facilitate the dense biomass aggregation known as granulation. The size of granules is about 1-3 mm diameter. Since granules are bigger in size and heavier, they will settle down and be retained within the reactor. The concentration of biomass in the reactor may become as high as 50 g/L. Thus a very high SRT can be achieved even at a very low HRT of 4 hours. The granules consist of hydrolytic bacteria, acidogen/acetogens and methanogens. Carbohydrate degrading granules show layered structure with a surface layer of hydrolytic/fermentative acidogens. A mid-layer comprising of syntrophic colonies and an interior with acetogenic methanogens.
  • 40. Static granular bed reactor (SGBR) • Simple in operation with fewer moving parts • Major issue: head loss due to build-up of solids • Developed at Iowa State University by Drs. Ellis and Kris Mach • Just opposite to UASB; flow is from top to bottom and the bed is static • No need of three-phase separator or flow distributor Effluent
  • 41. When the waste contains sulfate, part of COD is diverted to sulfate reduction and thus total COD available for methane production would be reduced greatly. Effect of sulfate on methane production Sulfide will also impose toxicity on methanogens at a concentration of 50 to 250 mg/L as free sulfide.
  • 42. 8e +8H+ + SO4 2-  S2- + 4H2O • COD/SO4 2- ~ 0.67 8e +8H+ + 2O2  4H2O 2O2/ SO4 2- = 64/96 ~ 0.67 Theoretically, 1 g of COD is needed to reduce 1.5 g of sulfate Stoichiometry of sulfate reduction
  • 43. Example 2 A UASB reactor has been employed to treat food processing wastewater at 20oC. The flow rate is 2 m3/day with a mean soluble COD of 7,000 mg/L. Calculate the maximum CH4 generation rate in m3/day. What would be the biogas generation rate at 85% COD removal efficiency and 10% of the removed COD is utilized for biomass synthesis. The mean CH4 content of biogas is 80%. If the wastewater contains 2.0 g/L sulfate, theoretically how much CH4 could be generated? Solution: Maximum CH4 generation rate: The complete degradation of organic matter in the waste could only lead to maximum methane generation and is also regarded as theoretical methane generation rate.
  • 44. (7000 x 10-6)  Total COD removed = ----------------- x (2) kg/d (10-3) = 14 kg/d From eq. (3) in example 1, we have 1 Kg COD produces 0.35 m3 CH4 at STP 14 Kg COD produces ~ 0.35 x 14 = 4.9 m3 CH4/d at STP At 20C, the CH4 gas generation = 4.9 x(293/273) = 5.3 m3/d The maximum CH4 generation rate = 5.3 m3/d Cont.. :
  • 45. Cont.. Biogas generation rate Not all COD (organic matter) is completely degraded. The fate of COD during anaerobic treatment process can be viewed as Residual COD (in effluent) COD converted to CH4 gas COD diverted to biomass synthesis COD utilized for sulfate reduction (if sulfate is present) (7000 x 10-6) Total COD removed = ------------- x (2) x 0.85 kg/d (10-3) = 11.9 kg/d :
  • 46. Cont.. As 10% of the removed COD has been utilized for biomass synthesis remaining 90% of the removed COD has thus been converted to CH4 gas. COD utilized for CH4 generation = 11.9 x 0.9 kg/d = 10.71 kg/d From eq. (3) in example 1, we have: 1 Kg COD produces 0.35 m3 CH4 at STP 10.71 Kg COD produces ~ 0.35 x 10.71 = 3.75 m3 CH4/d at STP At 20C, the CH4 gas generation = 3.75 x (293/273) = 4.02 m3/d The bio-gas generation rate is larger as it also contains CO2 and H2S4C.02/0.80 = 5.03 m3/d
  • 47. When the waste contains sulfate, part of COD is diverted to sulfate reduction and thus total COD available for methane production would be reduced greatly. Sulfate-reducing bacteria Organic matter + Nutrients + SO4 2-  H2S + H2O + HCO3 - + New biomass Theoretically, 1 g COD is required for reduction of 1.5 g sulfate. In this problem, there is 2 g/L sulfate. Total COD consumed in sulfate reduction = 1.33g = 1330 mg COD available for methane production = (7000 –1330) mg/L = 5670 mg/L Methane generation rate when sulfate is present Cont..
  • 48. Cont.. (5666.67 x 10-6)  Total COD available = ----------------- x (2) kg/d for CH4 generation (10-3) = 11.33 kg/d From eq. (3) in example 1, we have: 1 kg COD produces 0.35 m3 CH4 at STP 11.33 kg COD produces ~ 0.35 x 11.33 = 3.97m3 CH4/d at STP At 20C, the CH4 gas generation = 3.97 x(293/273) = 4.3 m3/d The CH4 generation rate when sulfate is present = 4.3 m3/d Presence of sulfate reduces methane yield by about 19% However, total biogas will now contain more H2S, adding volume Cont..
  • 49. Expanded bed reactor (EBR) • Expanded bed reactor is an attached growth system with some suspended biomass. • The biomass gets attached on bio-carriers such as sandman, pulverized polyvinyl chloride, shredded tire beads. • The bio-carriers are expanded by the upflow velocity of influent wastewater and recirculated effluent. • In the expanded bed reactor, sufficient upflow velocity is maintained to expand the bed by 15-30%. • The expanded bed reactor has less clogging problems and better substrate diffusion within the biofilm. • The biocarriers are partly supported by fluid flow and partly by contact with adjacent biocarriers, which retain the same relative position within the bed.
  • 50. Fluidized bed reactor (FBR) • FBR is similar to EBR in terms of configuration. But FBR is truly fixed film reactor as suspended biomass is washed–out due to high upflow velocity. • The bed expansion is 25-300% of the settled bed volume, which requires much higher upflow velocity (10-25 m/hr). • The bio-carriers are supported entirely by the upflow liquid velocity and therefore able to move freely in the bed. • The fluidized bed reactor is free from clogging problem short-circuiting and better substrate diffusion within the biofilm.
  • 51. Hybrid system: UASB/AF Hybrid system incorporates both granular sludge blanket (bottom) and anaerobic filter (top). Such approach prevents wash-out of biomass from the reactor. Further additional treatment at the top bed due to the retention of sludge granules that escaped from the bottom sludge bed. UASB reactor facing a chronic sludge wash-out problem can be retrofitted using this approach. Hybrid system may be any combi- nation of two types of reactor
  • 52. Biogas Sludge Anaerobic baffled reactor In anaerobic baffled reactor, the wastewater passes over and under the baffles. The biomass accumulates in Between the baffles which may in fact form granules with time. The baffles present the horizontal movement of of biomass in the reactor. Hence a high concentration of biomass can be maintained within the reactor.
  • 53. SETTLE DECANT FEED REACT SETTLED BIOMASS SUPERNATANT DECANT PORTS BIOGAS RECYCLE EFFLUENT FEED BIOGAS Anaerobic Sequential Bed Reactor
  • 54. Anaerobic process design Design based on volumetric organic loading rate (VOLR) So . Q VOLR = --------- V VOLR : Volumetric organic loading rate (kg COD/m3-day) So : Wastewater biodegradable COD (mg/L) Q : Wastewater flow rate (m3/day) V : Bioreactor volume (m3)
  • 55. So and Q can be measured easily and are known upfront VOLR can be selected! How do we select VOLR?  Conducting a pilot scale studies  Find out removal efficiency at different VOLRs  Select VOLR based on desired efficiency VOLR Efficiency, %
  • 56. Design based on hydraulic loading rate V = a . Q a . Q A = -------- H H : Reactor height (m) a : Allowable hydraulic retention time (hr) Q : Wastewater flow rate (m3/h) A : Surface area of the reactor (m2) Permissible superficial velocity (Va) Va = H/ For dilute wastewater with COD < 1,000 mg/L
  • 57. Solids retention time (SRT) An anaerobic digester is a completely mixed reactor for which solid retention time(SRT) and hydraulic retention time (HRT) is the same. V, m3 Influent flow rate (Q), m3/day HRT, days = Volume V (m3) = day Flow rate Q (m3/day) For a given SRT (HRT), the size of reactor can be easily determined since flow rate (Q) is known to us Digester volume, V (m3) = Flow rate (Q) x SRT (C )
  • 58. Volatile solids loading rate The size of an anaerobic digester can also be estimated based on volatile solids loading rate expressed as kg VS/m3-day. V, m3 Influent VS kg/day Volatile solids loading rate, (kg VS/m3- day) Influent VS (kg/day) Reactor volume (m3) = For a given volatile solids loading rate, the size of reactor can be easily determined since influent VS (kg/day) is known to us. Influent VS (kg/day) Digester volume, V (m3) = Volatile solids loading rate,(kg VS/m3- day)
  • 60. Methane for power generation The digester uses feeder cattle manure from Amana Farms and industrial and food processing waste from such industries as Genencor International, Cargill and International Paper’s Cedar River Mill in Cedar Rapids. The $4.9 million facility near West Amana produces methane biogas that powers four electric generators. The system produces about 2.6 MW of power or 15% of Amana Service Co.’s base load electricity in winter and 10% in summer.
  • 61. What happens to the left-overs? Common misconceptions about anaerobic digesters include that anaerobic digestion and the resulting biogas production will reduce the quantity of manure and the amount of nutrients that remain for utilization or disposal. An anaerobic digester DOES NOT MAKE MANURE DISAPPEAR! Often the volume of material (effluent) handled from a digester increases because of required dilution water for satisfactory pumping or digester operation. On average, only 4% of the influent manure is converted to biogas. None of the water! The remaining 96% leaves the digester as an effluent that is stable, rich in nutrients, free of weed seed, reduced or free of pathogens, and nearly odorless. This means that a farm loading 1,000 gallons per day into a digester can expect to have 960 gallons of material (effluent) to store and ultimately utilize. Depending on digester design and operation, solids can also settle out in the bottom of the digester and/or form a floating scum mat. Both the scum mat and the solids will eventually need to be mechanically removed from the digester to assure desired performance. When evaluating the actual performance and operation of a digester, it is important to determine and account for the amount and type of material retained in the digester and the cost of lost digester volume and ultimate cleaning.