1. 1 University of Oregon Investment Group
March 13th
, 2015
Technology
Covering Analysts: Gregg Anderson
Investment Thesis
Ambarella is currently the sole provider of semiconductors for GoPro and
Xiaomi wearable cameras. As this market continues to emerge, particularly
in China, Ambarella’s existing relationships with GoPro and Xiaomi will
provide strong and diversified exposure to the fast growing wearable
camera markets in the United States and China.
Leveraging a technological lead in low-power, high-definition video
solutions has made Ambarella the continued company of choice for top-
quality OEM drone manufacturers. As the commercial drone market
continues to grow, Ambarella will be in a prime position to benefit from
this emerging market.
Past and continued disputes between police officers and citizens has
resulted in a growing demand and trend towards police wearing body
cameras. Leveraging the technology already used in their wearables
segment will allow Ambarella to quickly capitalize on this market and
further diversify their revenue streams.
Combining a strong cash position with existing relationships with
prominent OEMs in the security market, Ambarella is a flexible and
aggressive company with the capacity to capitalize on emerging industry
trends.
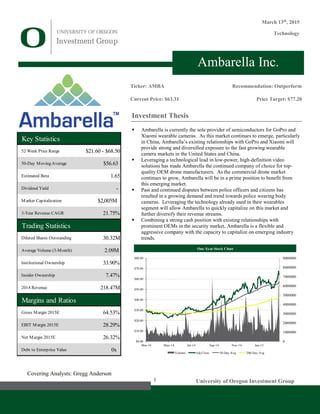
Ambarella Inc.
Ticker: AMBA
Current Price: $63.31
Recommendation: Outperform
Price Target: $77.20
Key Statistics
52 Week Price Range
50-Day Moving Average
Estimated Beta
Dividend Yield
Market Capitalization $2,005M
3-Year Revenue CAGR 21.75%
Trading Statistics
Diluted Shares Outstanding 30.32M
Average Volume (3-Month) 2.09M
Institutional Ownership 33.90%
Insider Ownership 7.47%
2014 Revenue 218.47M
Margins and Ratios
Gross Margin 2015E 64.53%
EBIT Margin 2015E 28.29%
Net Margin 2015E 26.32%
Debt to Enterprise Value 0x
$21.60 - $68.50
$56.63
1.65
-
One-Year Stock Chart
0
1000000
2000000
3000000
4000000
5000000
6000000
7000000
8000000
9000000
$0.00
$10.00
$20.00
$30.00
$40.00
$50.00
$60.00
$70.00
$80.00
Mar-14 May-14 Jul-14 Sep-14 Nov-14 Jan-15
Volume Adj Close 50-Day Avg 200-Day Avg
2. UOIG 2
University of Oregon Investment Group March 13th
, 2015
Business Overview
Founded in 2004, Ambarella is a semiconductor company that specializes in low-
power, high-definition solutions for a multitude of video-based devices. Upon
founding, the company originally specialized in broadcast infrastructure encoders
before expanding into consumer, sports, security, and automotive cameras.
Operating as a fabrication-less, or fabless, semiconductor company, Ambarella
outsources manufacturing to specialized manufacturers who use Ambarella’s
research and design specifications. Compared to non-fabless business model,
Ambarella enjoys a relatively low level of fixed costs and capital expenditures.
This allows Ambarella the freedom to allocate a significantly larger proportion of
their operating expenses to R&D and SG&A than firms with in-house
manufacturing facilities. With a higher emphasis on research and development,
Ambarella works closely with original equipment manufacturers (OEMs) to
produce specialized solutions for their end products.
As mentioned above, Ambarella creates infrastructure encoders as well as
consumer, wearable, security, and automotive cameras. The following section
will further describe the segments above.
Camera
The Camera segment can be broken down into four sub-segments: Security,
Wearables, Automotive, and Other.
Security
The security segment is comprised of two segments: professional and consumer.
Professional Security
The Professional Security segment is Ambarella’s largest segment by revenue and
serves as a strong growth segment for the company. Ambarella primarily serves
the surveillance camera market and is continuing to develop chips that allow for
180 and 360 degree vision with quality ranging from 720p to 4K/UHD. Other
specialty features include the ability to “dewarp” images that are captured within
the 180 and 360 degree lenses, creating a clearer image that allows for clearer
identification.
The Professional Security segment can be further broken down into three sub-
segments: premium, mid-range, and low-range. Due to Ambarella’s focus on top
quality video solutions, they primarily compete in the premium and mid-range
markets where margins are generally higher. The company has continued to move
away from the low-range segment as increased pricing competition from low-end
producers continues to grow. Going forward, Ambarella will continue to move
towards the mid-range and premium cameras.
Consumer Security
The Consumer Security segment is one of Ambarella’s smallest and newest
segments. Consumer Security is comprised of home security networks that allow
consumers to actively monitor their home via mobile and computer devices. Prior
to this most recent year, this space was largely defined by small technology
companies who created in-home security camera networks. Recently, cable and
internet service providers have actively moved into this space by buying out
smaller firms and bundling the security service with their other cable and internet
product offerings. Ambarella provides the semiconductors that allow these
cameras to operate at high resolution with low-power consumption. These two
traits are vital in this market as consumers desire a constant video stream with
high enough quality to allow for identification. Going forward, Ambarella will
40.32%
34.46%
14.08%
11.13%
Security Wearables Automotive Other
Figure 1: Segments as a % of 2014 Camera
Revenue
Source: UOIG Estimates
32.82%
61.46%
5.38%
4.29%
Premium Mid-Range Low-Range Consumer
Figure 2: Segments as a % of 2014 Security
Revenue
Source: UOIG Estimates
3. UOIG 3
University of Oregon Investment Group March 13th
, 2015
continue to see strong growth in this market as internet and cable service providers
continue to bundle the security network as part of a customer’s already existing
internet and cable package.
Professional and Consumer Security is estimated to account for 36.43% of total
camera revenue in 2014
Wearable Sports
The Wearable Sports segment is Ambarella’s second largest segment by revenue
and has seen very strong growth in recent years as new applications emerge for
cameras within extreme sports. Ambarella is the sole supplier of GoPro and
Xiaomi and there is currently no evidence to suggest that either company is
second-sourcing. The relationship between GoPro and Ambarella is currently
deemed to be healthy as Ambarella works directly with GoPro in order to create
semiconductors that are highly compatible with the GoPro platform. GoPro has
a formidable brand equity and is anticipated to continue to dominate this market.
This ongoing relationship between makes it extremely difficult for other
companies to compete with Ambarella in this space as Ambarella has been able
to specifically gear their research and development into advancing GoPro
capabilities.
Wearable Sports is estimated to account for 40.83% of total camera revenue in
2014.
Automotive
The Automotive segment is Ambarella’s third largest segment by revenue and has
grown relatively slower than other segments. Ambarella provides the
semiconductors used in dashboard or “dash” cameras that allow a driver to video
record while driving. This particular camera is primarily used by drivers as a
potential source of evidence in the event of an insurance claim as it allows the
driver to have record of what truly happened. The primary market for these
cameras is in China, Russia, South Korea, and Taiwan, where insurance and other
disputes are highly prevalent.
Automotive is estimated to account for 17.92% of total camera revenue in 2014.
Other
Handheld/Pocket Camera
The Handheld/Pocket Camera revenue segment is currently one of Ambarella’s
smallest segments and is considered to be dying. Five years ago, the handheld
camera market began to see strong decline as new camera forms, primarily mobile
phones such as the iPhone and Android, began to emerge. This emergence
significantly decreased the value of a separate, handheld camera, and thus this
market has been in decline since. Ambarella currently still carries a small supply
of semiconductors for this market but it is anticipated that they will discontinue
this line soon.
Drone/Unmanned Aerial Vehicle (UAV)
The UAV segment is a relatively small segment but is one of Ambarella’s fast
growing segments that only began to see revenue in the last four quarters.
Ambarella provides the semiconductors for UAV’s and drones that are used both
commercially and recreationally. Due to both the height and speed at which a
UAV operates, this segment requires a 4K, 60 frames per second, semiconductor
that allows high quality video while attached to a UAV. While this segment is
relatively small, it has an extremely high margin and a large potential as
applications for UAVs with cameras continues to grow. Some industries have
64%
27%
9%
Americas EMEA Asia and Pacific area countires
Source: Google Images
Figure 5: GoPro 2014 Geographic Revenue
Distribution
0.00%
20.00%
40.00%
60.00%
80.00%
100.00%
120.00%
140.00%
0
500
1000
1500
2000
2500
RevenueGrowth(%)
Revenue(inmillions)
Total Revenue ($) YoY Revenue Growth (%)
Source: FactSet
Figure 4: GoPro Total Revenue
Source: Google Images
Figure 3: GoPro Logo
4. UOIG 4
University of Oregon Investment Group March 13th
, 2015
already began to integrate this technology into their operations, including the
agricultural, real estate, and surveying sectors.
Police Camera
The Police Camera segment is another relatively small but fast growing segment
that has emerged in the last five quarters. Ambarella provides low-power
consumption semiconductors that allows a police officer to wear a body camera
while on duty. The primary market for this camera has been in China and other
parts of Asia as corruption is extremely high in these areas. Until recent incidents,
including the controversial shooting of Michael Brown at Ferguson, there has
been an extremely small market in the United States. The United States market
will be addressed further on in this report.
The Pocket Camera, UAV, and Police Camera is estimated to account for 4.81%
of total camera revenue in 2014.
Infrastructure
The Infrastructure segment consists largely of video encoding solutions that can
be used in broadcasting and transmission. This segment was once Ambarella’s
largest segment but has been in decline for the past several years.
As of 2014, the Infrastructure segment accounted for 6.07% of total revenue.
Industry
Overview
The sector of the video solutions semiconductor industry that Ambarella competes
in is a relatively new and fast growing space that is comprised of very few players.
While there are large and vertically integrated companies that exist within the
space, the majority of players are small to medium sized firms that are either
private or primarily financed through equity. These smaller firms generally
outsource manufacturing in what is called a fabrication-less, or fabless, business
model. The fabless business model is primarily a result of how specialized this
particular industry is. By sparing the fixed costs associated with manufacturing,
firms are able to allocate a larger portion of their revenues to research and
development. Recent trends show that the presence and demand for high-
definition video has been growing in the last decade and this trend will continue.
As this prevalence continues, the video solutions industry is expected to show
rapid growth.
The primary way that firms generate revenue in this industry is by developing
close relationships with OEMs to develop a video solution that is specifically
catered for the OEM’s end product. When successful, this process results in a
design win and results in the semiconductor being implemented into the end
product. Design wins are absolutely crucial within this industry as they not only
generate revenues from the initial version of the end product but place the
semiconductor firm in an incumbent position for future versions of the end
product. Furthermore, design wins often result in a semiconductor company
working directly with the OEM in the future. This interaction provides direct
insight into the OEM’s industry and allows for better allocation of research and
development.
Geographically, a majority of this industry operates within China, Taiwan, and
Korea where many prominent electronics manufacturers hold their operations.
This trend is expected to continue in the coming years.
Figure 6: Wearable Police Cameras
Source: Google Images
0.0%
5.0%
10.0%
15.0%
20.0%
25.0%
30.0%
0.0
5.0
10.0
15.0
20.0
25.0
30.0
2010 2011 2012 2013 2014
RevenueinMillions
Infrastructure Revenue % of Total Revenue
Source: UOIG Spreads
Figure 7: Infrastructure Revenue
0.00%
5.00%
10.00%
15.00%
20.00%
25.00%
30.00%
35.00%
40.00%
45.00%
2009 2010 2011 2012 2013 2014
Research and Development SG&A
Source: UOIG Spreads
Figure 8: AMBA Operating Costs as % of
Revenue
5. UOIG 5
University of Oregon Investment Group March 13th
, 2015
Macro-factors
Demand for Police-Citizen Transparency
Interactions between police and citizens, particularly in the United States, Europe,
and Asia have received growing media and public attention. In Asia, there is a
high rate of corruption within law enforcement and as a result some governments
have mandated that officers are to be equipped with cameras while on duty. In
the United States, several recent controversial events between police and citizens
have fueled public demand that all officers be equipped with body cameras.
Recently, the United States Justice Department has laid out guidelines for their
use and it is expected that more police departments will begin to adopt the
technology in the coming years as policy becomes better defined and their use is
normalized. As this trend develops, Ambarella is an extremely strong position to
capture this growth as they have and will continue to leverage their current
technological advantage in wearables to secure a first movers advantage.
Advancement and Regulation of Drones
Two years ago, the use of the word “drone” in the United States would be largely
associated with military drones that conduct controversial airstrikes overseas.
However, in the past year this working definition has effectively changed as
Amazon and other companies have attempted to commercialize drones to expand
their business operations. The influx of research and development into
commercial drones has led to advancements in the technology and capabilities of
the drones. While commercial drones have seen rapid expansion in the past year,
the current regulatory environment, particularly in the United States, will be a
major factor in how quickly commercial drones are adopted. As the
implementation of drones grow, Ambarella will be the company of choice to
provide the high-frame and lower power consumption semiconductors that enable
cameras to be effective in advancing business operations.
Analog to Digital
A major trend within video is the transition from analog to digital. Where analog
was once the most cost-efficient method, advances in digital technology coupled
with converging prices has made digital a more attractive investment. This trend
is particularly strong in the security camera segment as users begin to transition
their entire network system from analog to digital. Considering that Ambarella
exclusively produces digital solutions with high resolution and low-power
consumption, the company is very well positioned to experience strong growth as
the digital transition continues.
Consumer Discretionary Spending
A significant amount of video solutions are used within consumer electronics that
are considered to be non-essential or even luxury goods. An economic slowdown
with a major economy would have a detrimental effect to consumer electronics at
the retail level. This particular risk is particularly prevalent to Ambarella’s
wearable segment, which primarily offers a high-end, non-essential camera.
Growing Middle Class in China
A major trend that will continue to benefit Ambarella and consumer electronics
in general is China’s large and growing middle class. This particular trend is
especially important for Ambarella’s automotive and wearable camera segments.
The automotive market will benefit from this transition as more automobiles are
expected to be purchase. Considering that China is one of the largest end market
for automotive cameras, Ambarella will benefit. In terms of wearables,
Ambarella has just recently announced that their semiconductor will be featured
in all of Xiaomi’s new wearable market. Xiaomi is a massive power-house in the
consumer electronics industry in China. This new exposure to Chinese markets
is a major point of growth for Ambarella.
Figure 9: Riots in Ferguson
Source: Wall Street Journal Images
0
1000
2000
3000
4000
5000
6000
7000
2014E 2015E 2016E 2017E 2018E
Revenue(inmillions,USD)
Europe United States China
Figure 10: Revenue Related to Security
Equipment
Source: Vision Gain Research
0.00%
2.00%
4.00%
6.00%
8.00%
10.00%
12.00%
14.00%
16.00%
PercentGrowth
Figure 11: Chinese Annual GDP Growth
Source: World Bank
6. UOIG 6
University of Oregon Investment Group March 13th
, 2015
Competition
Ambarella has continued to diversify their product offerings in the past years and
as a result does not exist in just one space. The following discussion will describe
the competitive factors that exist within each space Ambarella operates in.
Wearables
In the wearables segment, Ambarella has essentially monopolized this industry
and has established themselves as the premier supplier of chips that enable the
functions that wearable cameras demand. As noted with GoPro and Xiaomi,
Ambarella is the sole supplier of these chips. While there are vertically integrated
firms like Sony that have attempted to enter the wearables end market, none of
these companies have managed to make a significant breakthrough or gain market
share.
GoPro has been extremely successful in this space by having cameras that have
high definition, high frames per second, low-power consumption, and the
durability to be used in sports. The specifications that enable GoPro’s
revolutionary ability is provided by Ambarella, who has specifically geared their
research and development to provide a combination of high definition and lower
power consumption. The combination has allowed Ambarella to a forge a brand
equity and reputation that is currently unparalleled in the market and is very
unlikely to be matched in the near future.
Security
In the security segment, Ambarella competes primarily with many small,
specialized Chinese firms. Where Ambarella largely competes on quality, many
of these smaller firms, most notably HiSilicon Technologies, compete almost
entirely on price at the expense of quality. Ambarella’s solutions are continuing
to be adopted by OEMs as the primary need for security cameras—
identification—is not met by the lower quality firms. Going forward, Ambarella’s
strong reputation and existing relationships with some of the largest and fasting
growing provides—such as Hikvision and Dahua—will allow the company to
stake out a large market.
Automotive
The automotive market is a relatively small market that is comprised of a few,
very small players including Sunplus Technologies, Novatek, and Core Logic.
Going forward, there is opportunity for this market to grow with the middle class
emergence in China and Russia. More so, technology advancements and price
declines will continue to make the automotive dashboard camera an attractive
investment in non-traditional markets such as the United States and Europe.
UAV and Police Cameras
Similar to the wearable cameras market, in order for a camera to be successful on
a police officer or a UAV, the semiconductor must allow for high-definition, low-
power consumption, and the ability to withstand rugged conditions. This market
is currently emerging and the size and speed at which it will grow is currently
unknown. Leveraging already existing technology in the wearable segment with
continued focus on research and development on low-power consumption,
Ambarella is strongly positioning themselves to intercept potential growth in this
segment.
Figure 12: Xiaomi’s Wearable Camera
Source: Google Images
Figure 13: HiSilicon Logo
Source: Google Images
Figure 14: SunPlus Technology
Source: Google Images
7. UOIG 7
University of Oregon Investment Group March 13th
, 2015
Strategic Positioning
Low-Power Consumption, High-Definition Video
The current markets that Ambarella serves—wearables, security, and automotive
cameras—all require a combination of high-definition video and low-power
consumption. As a result, Ambarella has geared a majority of their research and
development towards creating a video solution that combines high definition with
a long-lasting battery life. This combination has proven to be and will continue
to be a major asset that Ambarella will be able to leverage when attempting to
move into new markets such as the UAV and Police cameras.
System-on-a-Chip (SoC)
Ambarella uses a System-on-a-Chip semiconductor that allows the company to
combine high-definition video, image, and audio processing as well as
programmable functions—all on a single chip. The System-on-a-Chip allows
Ambarella to leverage their patented and existing chip architecture into new and
existing markets, reducing costs and allowing Ambarella to focus on improving a
single chip’s architecture. Most importantly, Ambarella has designed their chip’s
architecture specifically to optimize power consumption—a trait that
distinguishes Ambarella from a majority of their competitors.
Furthermore, the System-on-a-Chip is an extremely important component in
maintaining and growing relationships with OEMs. With key customers,
Ambarella provides software that allows the OEM to alter certain specifications
for different models and make necessary adjustments in order to ensure smooth
integration into the product design. Going forward, Ambarella will continue to
leverage their System-on-a-Chip to win new customers and extend current
relationships.
Ability to Transition to New Opportunities
Prior to the advancement of picture and video capabilities on mobile devices,
handheld pocket cameras were major sources of revenue. As this revenue
declined, Ambarella was able to leverage their current technologies and move into
new markets such as security and wearables. Going forward, Ambarella has
stated that they will continue to look for new opportunities—particularly in data
analytics, which is discussed below. As end market preferences evolve,
Ambarella has maintained a large cash position that management is prepared to
deploy in order to penetrate new markets. Combining this with Ambarella’s
existing technology, brand equity, and System-on-a-Chip, Ambarella has
positioned themselves as a flexible company that is ready to exploit new markets.
Business Growth Strategies
Considering Ambarella’s consistent dedication to research and development,
existing relationships with large OEM’s, and an extremely strong reputation as
the top provider of low-power, high definition video solutions, Ambarella has a
multitude of opportunities to continue to grow and diversify their reputation and
revenues.
Existing Relationships with ODMs and OEMS
Currently, Ambarella has several strong relationships with prominent ODMs and
OEMs across each segment. The company works directly with ODMs and OEMs
to design a semiconductor that fits the operating specifications of the product and
enables functionality.
Figure 15: Ambarella’s Strategic Positioning
Source: AMBA Filings
Figure 16: SG&A Costs
0.00%
2.00%
4.00%
6.00%
8.00%
10.00%
12.00%
14.00%
16.00%
18.00%
0.00
50,000.00
100,000.00
150,000.00
200,000.00
250,000.00
2011
2012
2013
2014
2015E
2016E
2017E
2018E
2019E
2020E
2021E
2022E
2023E
Total SG&A (in thousands)
Percent of Total Revenue
Source: UOIG Spreads
8. UOIG 8
University of Oregon Investment Group March 13th
, 2015
Working directly with producers, Ambarella is able to gain insights into industry
trends that allow for more focused and catered R&D and SG&A. These insights
ultimately yield crucial information that will allow Ambarella to remain
competitive in the industry and design compatible products. More so, the
established relationship between Ambarella and the ODM/OEM allows
Ambarella an incumbent advantage in the next generation of the ODM/OEMs
products. As successful relationships are developed, as with GoPro and Xiaomi,
Ambarella will continue to win future designs and maintain steady sources of
revenue.
Police Cameras
Throughout Asia, Europe, and the United States, there is a growing public and
government demand that police officers be equipped with body cameras. Body
cameras can serve as a source of evidence in a controversial interaction between
a police officer and a citizen and have ultimately shown to have a beneficial effect
in law enforcement.
In Asian countries, there is a high degree of police corruption and some
governments have mandated that their police officers wear a body camera. In the
United States, recent events such as Ferguson have fueled public demand for
police cameras. While this market has seen considerable pickup in recent
quarters, the growth potential worldwide is massive. There are currently 800,000
sworn officers in the United States.
Considering Ambarella’s strategic position and market leadership in low-power
consumption, high-definition semiconductors, the company is in an extremely
attractive position to capitalize on this fast developing market. Arguably no
competitors exist in this space as police cameras require a long battery life and
high quality—a combination that Ambarella undoubtedly dominates. Ambarella
has recognized this potential market and has recently developed a semiconductor,
the A12, which is specifically designed for this market.
Unmanned Aircraft Vehicle (UAV) Cameras
Commonly referred to as drones, commercial UAVs have seen extremely large
growth in the past year as industry research and development has rapidly
advanced the necessary technology and prices have continuously decline.
Furthermore, industries including agriculture, real estate and energy have
continued to find new ways in which a drone can expand their business. For
example, a large scale farmer can survey his crops for blights, a real estate
company can capture a breath-taking aerial image of a property, and an energy
company can survey potential oil fields. While drones have grown, the common
denominator in many of their uses is an attached camera that provides picture and
video.
Due to the height and speed at which UAVs operate, commercial users will
demand a camera that has the ability to operate within these conditions while also
producing high quality images. Ambarella has supplied high quality, 4K-30/60
frame per second chips to leading producers and has established a strong
reputation within the market. Current relationships with leading UAV producers,
including DJI, will undoubtedly lead to future collaboration as well as a continued
insight into industry design needs. As UAV industry research and development
continues and prices decline, the market will continue to grow as industries will
continue to find ways in which UAVs with cameras can enhance their operations.
Figure 18: DJI Phantom Quadcopter with GoPro
Source: UOIG Spreads
Figure 17: Projected Police and UAV Revenues
Source: UOIG Spreads
0
20000
40000
60000
80000
100000
120000
140000
160000
Revenue(inthousands)
Estimated Police Revenues Estimate Drone Revenues
9. UOIG 9
University of Oregon Investment Group March 13th
, 2015
Security Cameras
Until very recently, analog CCTV has been the standard within the security and
surveillance camera world as analog CCTV was considered to be the most cost-
effective and established system. However, advancements in technology and a
steadily decreasing prices have made digital security networks more optimal than
analog CCTV. As a result, digital cameras have become increasingly prominent
in the surveillance world as they unlock a higher image quality and more efficient
energy usage than analog cameras.
As OEM’s continue to transition from producing analog to digital cameras,
Ambarella is well positioned to continue to dominate this market as purchasers of
cameras are looking for cameras that have low consumption with high definition
capabilities that allow for certain identification. Ambarella has aggressively
pursued this space by continuing to develop cameras that match the needs of users,
including cameras with 180/360 degree angles and enhanced imaging quality. As
users continue to switch from analog to digital, Ambarella’s catered technology
will continue to be the primary choice with fast growing OEM’s including
Hikvision and Dahua.
Automotive Cameras
Automotive cameras, also known as dashboard cameras, are a common car
accessory used in China, Taiwan, Korea and Russia where traffic accidents and
controversial police interactions are very high. The use of a video clip can serve
as a key piece of evidence in an insurance or corruption claim. However, use in
the United States and Europe has been relatively low as previously low
functionality, high prices and lower controversial traffic incidents have deemed
them as mostly unnecessary. However, continuous improvements in technology
and declining prices make automotive cameras a globally attractive product.
Currently, Ambarella has and is continuing to develop semiconductors that allow
for improved battery life, multiple channel streams, 180/360 degree angles, and
the ability to withstand and continue to operate in the event of a crash. The major
opportunity for growth in this segment is in China as a continuously growing
middle class will result in more automobiles and automobile cameras.
Wearable Cameras
Wearable cameras have emerged as a significant portion of revenue, which largely
corresponds with the rise of GoPro wearable cameras. While this market has seen
extremely strong growth in recent years, there is still large growth potential in
coming years. As mentioned above, Ambarella is currently GoPro’s exclusive
source for low-power, high definition video that has made the durable camera
such a hit with sports enthusiasts worldwide. Currently, Ambarella has a healthy
relationship with GoPro and there is no indication that they are second-sourcing
their chips. This exclusive relationship is emblematic of Ambarella’s market and
technology domination and will allow Ambarella a defensible margin within this
particular segment.
Furthermore, Ambarella’s growth in this segment is not limited to GoPro as
recently Xiaomi, a prominent Chinese electronics producer, has just released a
direct competitor to GoPro that features the same definition, with twice the frame
rate at half the price of the cheapest GoPro model. Like GoPro, Xiaomi’s new
product features Ambarella’s semiconductor. Xiaomi offers Ambarella deep
access into a vast and growing Chinese market, something GoPro has little
exposure to. The Xiaomi relationship will greatly expand Ambarella’s market
and will provide a new surge in the wearables segment.
0.00%
10.00%
20.00%
30.00%
40.00%
50.00%
60.00%
70.00%
80.00%
90.00%
0
2000
4000
6000
8000
10000
12000
14000
16000
RevenueGrowth(%)
Revenue(inmillions)
Total Revenue (in Chinese Yuan)
YoY Revenue Growth (%)
Figure 19: Dahua Technology Revenue
Source: FactSet
Source: FactSet
Figure 20: Hikvision Digital Revenue
0.00%
10.00%
20.00%
30.00%
40.00%
50.00%
60.00%
70.00%
80.00%
0
5000
10000
15000
20000
25000
30000
35000
40000
RevenueGrowth(%)
Revenue(inmillions)
Total Revenue (in Chinese Yuan)
YoY Revenue Growth (%)
10. UOIG 10
University of Oregon Investment Group March 13th
, 2015
Data Analytics—The “Smart” Camera
Ambarella’s management has stated that they have a long-term goal to create a
new camera market that incorporates data analytics. Essentially, the cameras used
today can capture high quality images at high frame rates but they do not interact
with the data that they are collecting. This particular development will lead to
huge growth opportunities in the security and automotive markets. Specifically
in the security camera market, there is potential for a camera to trigger certain
features upon motion. For example, motion could trigger an alarm or activate
certain features that would otherwise be dormant. While this is a relatively new
concept that Ambarella has been working towards, management has stated that
they are looking to deploy their cash stockpile in the near future to begin
advancements in this field. This opportunity and market creation makes
Ambarella an attractive long-term growth play as they are well-positioned to lead
the technology advancement.
Management and Employee Relations
Fermi Wang—Chairman, President, and CEO
Fermi Wang founded Ambarella in 2004 and has served in his respective roles
since. Before founding the company, Dr. Wang served as the CEO of a small
semiconductor company, Afara WebSystems, for two years before the company
was bought by Sun Microsystems in 2002. Dr. Wang holds a PhD and Masters in
electrical engineering from Columbia University. Mr. Wang helped take
Ambarella public in 2012.
Dr. Wang’s 2014 compensation stands at $2,342,000, comprised of a base salary
of $340,000, RSAs of $1,747,200 and non-equity compensation of $255,000.
George Laplante—CFO and Secretary
George Laplante joined Ambarella as Chief Operating Officer in 2011. Mr.
Laplante transitioned from a career as a management consultant and the CFO of
two small technology companies. Mr. Laplante holds degrees in accounting and
economics from Bowling Green State and Southern Connecticut State College,
respectively. Mr. Laplante helped take Ambarella public in 2012.
Mr. Laplante’s 2014 compensation stands at $1,313,600, comprised of a base
salary of $320,000, RSAs of $873,600 and non-equity compensation of $120,000.
Management Guidance
Ambarella’s management provides guidance for the next quarter and year as a
whole. Specifically, estimated sales, gross margin, and net income are provided.
Management guidance has consistently been beaten by actual results. As stated
by the CFO, estimates are often used as a base case of steady segment results and
does not factor in smaller segments that have the potential for rapid growth
Ambarella does not explicitly break out revenue beyond two segments: Camera
and Infrastructure. However, management does provide a lengthy conversation
on how each sub-segment of camera (i.e. automotive and security) did for the
quarter while also providing relative and qualitative guidance on the coming
quarter and year. Through extrapolation and comparisons, rough percentages can
be ascertained and used in financial analysis.
0
500
1000
1500
2000
2500
Fermi Wang,
CEO
George
Laplante, CFO
Leslie Kohn,
CTO
TotalCompensation(inthousands,USD)
2013 2014
Figure 22: Management Compensation
Source: AMBA Filings
0
10
20
30
40
50
60
70
Revenue(inmillions,USD)
Low High Actual
Figure 23: Management Guidance vs Actual
Revenue
Source: FactSet
0
5
10
15
20
25
NetIncome(inmillions,USD)
Low High Actual
Figure 24: Management Guidance vs Actual
Earnings
Source: FactSet
11. UOIG 11
University of Oregon Investment Group March 13th
, 2015
Portfolio Strategy
Ambarella is currently not held in any of the UOIG portfolios. Ambarella is an
extremely attractive small cap technology company that offers both near and long
term upside. Near term upside will be unlocked from new markets within the
wearables, security, drone, and police segments. Long-term potential is unlocked
via Ambarella’s technological advantage over their competitors and strong
relationships with prominent OEMs. Furthermore, Tall Firs is currently
underweight technology and Svigals is underweight both technology and small
cap.
Recent News
“Ambarella Goes Beyond GoPro”—Barron’s
March 5th
, 2015
The release of Xiaomi’s cameras, which uses Ambarella semiconductor, is
marked as a new market opportunity for the company. Furthermore, as the
company continues to win contracts with OEMs, revenues are finding new
sources and increasing diversification. The release prompted a small appreciation
in the price of Ambarella’s stock price and generates excitement among investors
who are looking for exposure to the wearable camera market but want to avoid
the volatility of GoPro.
“Ambarella, Inc. Announces Fourth Quarter and Fiscal 2015
Financial Results”—Ambarella Investor Relations
March 3th
, 2015
After providing revenue guidance between $57-59 million and earnings guidance
between $15-$17 million, Ambarella reported fourth quarter results topping both
expectations with $64.1 million in revenue and $17.7 million in earnings. Strong
fourth quarter results were attributed to strong growth across all markets and
continued design wins with OEMs. Particularly strong segments were the
professional and consumer security and wearable sports.
Catalysts
Upside
Unrestrictive and favorable commercial drone regulation in the United
States could spur commercial advancements in this area which would
directly benefit Ambarella.
Higher than anticipated response for Xiaomi’s wearable camera product
in China could massively boost Ambarella’s revenues and reputation as
the premier video solutions company
Another high-profile, controversial interaction between a police officer
and a citizen in the United States could result in or lead to government
legislation that mandates that police use body cameras
A terrorist attack comparable to the Boston bombing or 9/11 would
further reinforce the desire and need for security cameras that provide
both safety and identification.
14.40%
18.81%
19.39%
27.66%
19.50%
13.18%
17.48%
20.46%
29.63%
19.27%
0.00%
5.00%
10.00%
15.00%
20.00%
25.00%
30.00%
35.00%
Healthcare Technology Financials IME Con. Goods
Svigals' Portfolio
Benchmark
Figure 25: Svigal’s Sector Allocation
Source: UOIG
Figure 26: Tall Firs Sector Allocation
Source: UOIG
Figure 27: DADCO Equity Allocation
Source: UOIG
12. UOIG 12
University of Oregon Investment Group March 13th
, 2015
Downside
A major OEM such as GoPro or Xiaomi could second-source or in-house
produce the semiconductors used within their product, ultimately
damaging current and future revenue streams for Ambarella.
As a supplier of semiconductors for OEMs who sell consumer
electronics at the retail level, lackluster demand for OEM’s end products
will adversely affect Ambarella’s current and future sales.
Overly restrictive commercial drone regulations from world
governments could effectively slow or stop the development of the
commercial drone market which would result in a major loss of a
potential new market for Ambarella.
Slower than anticipated adoption of police cameras in the United States
could result in over-allocated research and development and slower or
less than expected cash flows.
Comparable Analysis
Ambarella is a high-growth company that is currently dominating an emerging
video solutions semiconductor space. As a result, there were very few
qualitatively and quantitatively similar comparables within the space. Therefore,
comparable companies were screened throughout the semiconductor space. The
philosophy of this comparable analysis was to find other small/mid-cap, high-
growth companies that operate in the broad semiconductor universe.
Comparable companies were screen on a multitude of metrics, including similar
market capitalization, capital structure, business models, revenue growth, and
margins. According to analysts, EV/Unlevered Free Cash Flow and EV/Revenue
are the primary metrics that Ambarella trades off. The following comparables
and metrics reflect next twelve months.
Inphi Corporation (IPHI) – 25%
“Inphi Corporation provides high-speed analog and mixed signal semiconductor
solutions for the communications, datacenter, and computing markets worldwide.
Its analog and mixed signal semiconductor solutions offer high signal integrity at
data speeds while reducing system power consumption. The company’s
semiconductor solutions are designed to address bandwidth bottlenecks in
networks, maximize throughput and minimize latency in computing
environments, and enable the rollout of next generation communications,
datacenter, and computing infrastructures.”—Yahoo! Finance
Inphi Corporation (IPHI) is used as a comparable as it is a fabless semiconductor
company with a strong focus on R&D. Inphi competes with Ambarella in the
Infrastructure space and has very similar gross margins and revenue growth in the
next 24 months. As a result of comparable growth profiles, margins, and business
models, Inphi is weighted 25%.
Mellanox Technologies (MLNX) – 25%
“Mellanox Technologies, Ltd., a fabless semiconductor company, designs,
manufactures, and sells interconnect products and solutions. The company’s
products are used for computing, storage, and communications applications in the
high-performance computing, Web 2.0, storage, financial services, enterprise data
center, and cloud markets. Its products facilitate data transmission between
Figure 28: Inphi Logo
Source: Google Images
Figure 29: INPI One Year Stock Chart
Source: Yahoo! Finance
Figure 30: Mellanox Logo
Source: Google Images
13. UOIG 13
University of Oregon Investment Group March 13th
, 2015
servers, storage systems, communications infrastructure equipment, and other
embedded systems.”—Yahoo! Finance
Mellanox Technologies (MLNX) is used as a comparable company due to similar
market capitalization, revenue growth, and margins. Furthermore, Mellanox
operates as a fabless business model and is a small competitor of Ambarella in the
Infrastructure space. As a result, Mellanox is weighted 25%
Cavium Incorporated (CAVM) – 25%
“Cavium, Inc. designs, develops, and markets semiconductor processors for
intelligent and secure networks. The company operates through Semiconductor
Products, and Software and Services segments. The company’s products also
include a suite of embedded security protocols that enable unified threat
management, secure connectivity, network perimeter protection, deep packet
inspection, network virtualization, broadband gateways, third generation/fourth
generation wireless infrastructure, storage systems, wireless high-definition
multimedia interface, cable replacement, and embedded video applications” —
Yahoo!Finance
Cavium is used as a comparable as it a fabless semiconductor company that
provides network, data, and security solutions. While Cavium does not
specifically focus on video solutions, their exposure to the segment as a whole
subjects them to similar factors that Ambarella faces. Furthermore, Cavium’s
business model, revenue growth, margins, capital structure, and market
capitalization make it an attractive comparable to Ambarella. As a result, Cavium
is weighted 25%.
GoPro (GPRO) – 25%
“GoPro, Inc. develops hardware and software solutions to alleviate consumer pain
points associated with capturing, managing, sharing, and enjoying engaging
content. The company offers HERO line of capture devices, such as cameras;
premium accessories, including battery BacPac, smart remote, and LCD touch
BacPac accessories; and mounts comprising equipment-based mounts consisting
of helmet, handlebar, roll bar, and grip and tripod mounts that enable consumers
to capture content while engaged in a range of activities, as well as mounts that
enable customers to wear the mount on their bodies, such as wrist housings, chest
harnesses, and head straps.”—Yahoo! Finance
GoPro is used as a comparable company to as Ambarella because both companies
are have similar exposure to the wearable sports market and have comparable
growth profiles. Considering that GoPro and Ambarella have an existing
relationship, investors who are looking to gain exposure to the wearable sports
market compare these two companies. As a result, GoPro is weighted 25%.
Discounted Cash Flow Analysis
Revenue Model
Ambarella currently only reports on two segments: Camera and Infrastructure.
Considering that the Camera segment accounts for roughly 95% of total revenue,
individual sub-segments were broken down and estimated in order to provide a
more accurate and deliberate way to project future revenues. Estimates were
gathered through financial statements, earning calls, investor presentations, and
Figure 31: MLNX One Year Stock Price
Source: Yahoo! Finance
Figure 32: CAVM One Year Stock Price
Source: Yahoo! Finance
Figure 33: GPRO One Year Stock Price
Source: Yahoo! Finance
14. UOIG 14
University of Oregon Investment Group March 13th
, 2015
the use of professional analyst estimates. The following estimates are meant to
reflect a conservative
Infrastructure
Infrastructure revenue was primarily projected on historical results and
management guidance. Until the most recent quarter, this segment was in decline.
However, Ambarella released a new product that management anticipates will
start pick up in the next few quarters as broadcasting companies begin to adopt
4K. Beyond 2018E, revenue is projected to slow as management and company
actions seem to be shifting more towards Camera and away from this particular
segment.
Camera
Security
Ambarella has stated that its two largest customers in the Security segment are
Hikvision Digital Technology and Dahua Technology. Therefore, in order to
project growth rates for this segment, I used a weighted average of the two
company’s projected sales for the next two years, which yielded a growth that was
applied for the Security segment as a whole. This weighted average was used as
a baseline. Considering that a majority of security cameras being sold are now
digital—which Ambarella specializes in—I added a premium to reflect other sales
not reflected in the baseline. Mid-range and Premium are the two largest sub-
segments for Ambarella and are projected to continue to each maintain 45% of
this segment going into the terminal year. Ambarella’s low-range segment, which
consistently declined in past quarters, is projected to continue to decrease into the
terminal year. The consumer sub-segment is projected to continue to grow on a
strong year over year basis (please note the base year is relatively small) as home
security technology becomes more accessible as prices decline and internet
providers begin to bundle the service.
Wearable
In order to project wearable revenues, future sales revenue for GoPro the next
three available years were used. This percentage is meant to reflect a minimum
baseline and a conservative premium was added on to reflect other growth not
reflected with GoPro. In particular, Xiaomi has just released a direct GoPro
competitor that is utilizing Ambarella’s chip. Considering that GoPro has
minimal exposure to China, there is potentially a massive and unrealized Chinese
market. A conservative premium, smaller than the baseline provided by GoPro,
was added onto the GoPro baseline to reflect the growth of the Chinese market. I
believe this estimate to be extremely conservative as it suggests that the Chinese
market be substantially smaller than the American market.
Automotive and Other
This particular segment, which includes UAV and Police cameras, was extremely
difficult to project as little data or certainty exists in these industries. Projections
were determined by estimating historical growth rates and applying an extremely
conservative estimate that is meant to reflect a baseline case as management has
consistently stated that they anticipate these two particular segments could be the
next segments to drive revenue growth.
0.00%
10.00%
20.00%
30.00%
40.00%
50.00%
60.00%
70.00%
2016E2017E2018E2019E2020E2021E2022E2023E
PercentofTotalSecurityRevenue
Security Wearable Automotive Other
Figure 35: Camera Revenue Projections by
Segment
Source: UOIG Spreads
0%
10%
20%
30%
40%
50%
60%
2016E 2017E 2018E 2019E 2020E 2021E 2022E 2023E
PercentofTotalSecurityRevenue
Professional: Premium-Range Professional: Mid-Range
Profesional: Low-Range Consumer Home Security
Figure 36: Security Revenue Projections by
Segment
Source: UOIG Spreads
15. UOIG 15
University of Oregon Investment Group March 13th
, 2015
Cost of Goods Sold
Cost of Goods sold was projected as a percentage of revenue and slowly decreases
through 2018 before slowly trending up towards the terminal year. Cost of Goods
Sold has remained relatively stable from a historical perspective and projections
incorporate Ambarella’s supplier power that allows them to defend against
dilution. The downward trend towards 2018 reflects both introductions of new,
higher margin products as well as a product mix that features higher margin
segments such as premium security, UAV, and automotive cameras.
Research and Development
Research and Development is projected to slightly decline in 2015E compared to
2014A but increase by approximately $28 million. Going into the terminal year,
R&D is projected at 26% of revenue. From a historical perspective, this particular
percentage of revenue might seem low; however, on a year over year basis R&D
is growing at a substantially faster rate than ever.
SG&A
Sales, General & Administrative expenses are forecasted to slightly trend down
in the next two years as Ambarella has secured several large design wins with key
OEMs, including GoPro and Xiaomi. However, beyond this year and into the
terminal year, SG&A is set to trend upwards in order to reflect larger marketing
efforts to win future designs.
Depreciation
Ambarella uses straight-line depreciation and historical averages were used to
project out future expense.
Capital Expenditures
Ambarella’s capital expenditures are primarily composed of equipment used in
research and development and encoding capital equipment. Capital expenditures
were projected using 2014’s percentage of revenue. Capital expenditures are
largely geared towards the infrastructure segment and as Ambarella’s percentage
of revenue in infrastructure decreases so too will capital expenditures.
Net Working Capital
Net Working Capital was primarily calculated using historical averages and
management targets in the terminal year and trending up or down accordingly. A
notable downtrend is seen with both inventory and accounts payable projected
forward. Management has stated that the current year they expect to hold
significantly larger levels of inventory to provide flexibility for upcoming product
offerings. This trend is not expected to continue.
Tax Rate
A heavy reliance on management guidance was used to determine tax rates going
forward. Ambarella has continued to move away from U.S. customers, which
yield a substantially higher tax rate than other countries. There is a chance that
the tax rate could decrease as business moves away from the United States but to
be safe a consistent tax rate is used.
0.00%
5.00%
10.00%
15.00%
20.00%
25.00%
30.00%
35.00%
40.00%
45.00%
63.50
64.00
64.50
65.00
65.50
66.00
66.50
Gross Margin
Drones and Premium Cameras as % of Revenue
Figure 37: Drone Revenue and Cost of Goods
Sold Projections
Source: UOIG Spreads
0.00%
5.00%
10.00%
15.00%
20.00%
25.00%
30.00%
35.00%
40.00%
45.00%
2009A
2010A
2011A
2012A
2013A
2014A
2015E
2016E
2017E
2018E
2019E
2020E
2021E
2022E
2023E
R&D as % of Revenue SG&A as Percent of Revenue
Figure 38: R&D and SG&A Projections
Source: UOIG Spreads
16. UOIG 16
University of Oregon Investment Group March 13th
, 2015
Beta
Beta was calculated by taking a weighted average of 2-year daily, 2-year weekly,
2-year monthly regressions as well as a 2-year weekly ETF vasicek and a 3-year
daily Hamada. Referring to Figure XX, the standard errors were very high for all
regressions. In order to combat this, weights were distributed throughout to
represent a more accurate and holistic beta.
The use of a terminal beta was also implemented to combat the large amount of
noise and errors in the beta described above. Terminal beta was calculated using
an average of the projected year beta and an Industry ETF beta. The terminal beta
represents a more accurate projection of what beta for this growing company will
be going forward as it matures.
Recommendation
Ambarella is a fast-growing technology company that has both near-term and
long-term upside. Near term growth will be driven by the emerging segments that
they operate in while long-term growth will be driven by the diversification of
their revenue streams and ability to carve out markets. I strong recommend that
this company be bought for all three portfolios.
Beta SE Weighting
1-Year Daily 2.09 0.26 0.00%
2-Year Daily 2.06 0.21 25.00%
1-Year Weekly 1.91 0.57 0.00%
2-Year Weekly 1.84 0.44 20.00%
2-Year Weekly Vasicek 1.11 - 15.00%
2-Year Monthly 1.73 0.15 25.00%
Hamaada ETF 1.09 - 15.00%
Ambarella Inc Beta 1.65
Terminal Year Beta Weighting
Amberalla Beta 50.00%
ETF Beta 50.00%
Terminal Year Beta
1.25
1.45
Beta
1.65
Figure 39: Calculation of Beta
Source: UOIG Spreads
Method Implied Price Weight
Discounted Cash Flow 74.94 85%
Forward Comparables 70.19 15%
Implied Price 74.23
Current Price 66.31
Undervalued 11.94%
Figure 40: DCF Assumptions
Source: UOIG Spreads