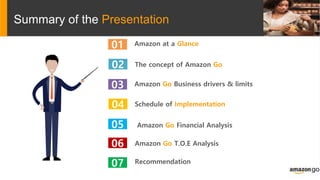
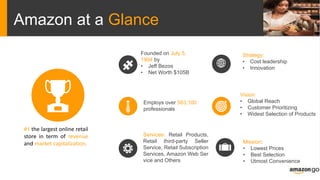
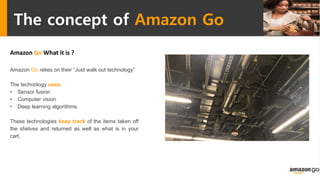
Presented by:
Ammine Ait Abdeslam
Chantelle Walsh
David Calton
Feasibility Study of Amazon Go
Summary of the Presentation
01
02
03
Amazon at a Glance
04
The concept of Amazon Go
Amazon Go Business drivers & limits
Schedule of Implementation
06 Amazon Go T.O.E Analysis
05 Amazon Go Financial Analysis
07 Recommendation
Amazon at a Glance
#1 the largest online retail
store in term of revenue
and market capitalization.
Founded on July 5,
1994 by
• Jeff Bezos
• Net Worth $105B
Employs over 563,100
professionals
Vision:
• Global Reach
• Customer Prioritizing
• Widest Selection of Products
Strategy:
• Cost leadership
• Innovation
Mission:
• Lowest Prices
• Best Selection
• Utmost Convenience
Services: Retail Products,
Retail third-party Seller
Service, Retail Subscription
Services, Amazon Web Ser
vice and Others
The concept of Amazon Go
Amazon Go What it is ?
Amazon Go relies on their “Just walk out technology”
The technology uses:
• Sensor fusion
• Computer vision
• Deep learning algorithms.
These technologies keep track of the items taken off
the shelves and returned as well as what is in your
cart.
The concept of Amazon Go
Amazon Go how it works
Amazon Go in Live Action
Amazon Go Business Drivers & Limits
Amazon Go Business Drivers
1- Data Analysis for better services:
Place to gather data with the aim to increase the Customer Satisfaction and Retention
2- Synergy with other Amazon services:
The strategy of Amazon is providing Amazon Go as a complement to AWS for and
marketplace platform analytics
3- Customer healthiness and wellness:
The Amazon Go store provides only healthy fresh food in kits and ready to eat snacks
mainly provided by Whole Food
4- Increase the profit margin of the grocery sector:
The Grocery Market has a unique financial characteristic to be not strongly profitable
with an average of 1.7% of profit. Amazon Go technology will impact directly and
indirectly the operating costs of a store for a better Profitability.
Amazon Go Business drivers & limits
Amazon Go Business Limits
1- Cost / Benefit of the project:
Amazon Go is a costly project estimated at $1.69 Billion for the company
that it will takes years to be profitable with the adequate strategy.
2- Competitors reaction:
The actual competitors such as Microsoft and Alibaba are developing a
similar technology by using the Radio Frequency Identification (RFID)
technology for payments that could help Walmart to compete with
Amazon
3- Workforce and Regulation:
Amazon Go is targeting principally the 2.3 Million cashier jobs in the
United-States estimated to be $37 Billion in potentially lost income
nationwide. Amazon should anticipate any law suit from Unions such as
United Food and Commercial Workers (UFCW)
Amazon Go Business drivers & limits
Amazon Go Porter Analysis
- Technological and
Financial Barriers
- The new entrants
need to be innovative
- Amazon used its
technology and Whole
food to enter the
market
- Customers have a great
power due to the
availability of the stores
- Amazon has to provide
cheap/quality product
with an outstanding
purchase experience
- Great pressure from
the competitor such as
Walmart and Costco
- Amazon should
create a niche by
targeting first the
professional people
- Existing technology
Self-checkout or
traditional checkout
“Cashier”
- According to National
Grocery Association,
90% of stores
Managers, do not want
to use the technology
JWO
- Amazon-Whole Food
merger was to integrate
a major supplier within
the supply chain by
offering the 360 brand
product
Schedule of Implementation
Acquisition of SnapTeel.
“Image Recognition Tech”
2013 2014 2017 2018 20252009
#1 Patent:
Detecting item interaction
and movement
#2 Patent:
Transitioning items from the
materials handling facility
Launching the 1st
JWO store in Seattle
1- Acquisition of Whole Food
2- Beta Test of the store
Strategical Plan for opening
2,000 stores in the U.S.
Amazon Go Financial Analysis
Financial feasibility of Amazon Go
- Financial Strategy:
Financial Ability of Amazon to develop technology and making them
ready to use
- Forecasting Analysis:
Forecasting the financial contribution of Amazon go with the actual
strategy of the group
- Alternative financial stream:
Suggesting a new stream of revenue that will position Amazon at a
safer place
Amazon Go Financial Analysis
1- Financial Strategy
A) Amazon financial investment
Cash Conversion Cycle Capital Budget for CAPEX and R&D
Amazon Go Financial Analysis
1- Financial Strategy
B) Financial Benchmark of the Grocery Market
- The potential size of sector:
This sector considered one of the safest areas to invest due to its estimated size in 2016 of $1.4 Trillion in the United States,
which 1% of this sector represents 10% of Amazon revenue.
- Financial indicators:
Weekly Sales per store: Average $305,105 and Ranges from $30,600 to $1,641,000
Average annual sales per square foot: $1,725 per sq. ft. weekly sales
Weekly Transaction per store: Average 11,211 and Ranges from 2,147 to 29,477
Sales and transaction by checkout: Weekly store sales by checkout $29,194 and Weekly transaction by checkout 1,241
The gross margin: it is virtually flat at 56.48%
The net profit: 1.65% for Publicly Traded companies and 4.01% for Profit leaders
Amazon Go Financial Analysis
B) Financial Benchmark of the Grocery Market
COGS 55%
Labor 34%
Rent 1.87%
Shrinkage 1.44%
Supplies 1.32%
Depreciation 0.9%
R & M 0.85%
Interest 0.32%
Other 3.69%
COGS 55%
Labor 20%
Rent 1.87%
Shrinkage0.96%
Supplies 1.32%
Depreciation 4%
R & M 2%
Interest 0.32%
Others 3.69
Component of the Total Cost in %
Current market Total Cost in % Impact of Amazon Go on the Total Cost in %
Comments:
Net profit: Increase from 1.69% to 12%
Positive impact
- Labor costs: decrease from 34% to 20%
- Shrinkage: decrease from 1.44% to 0.96%
Negative impact:
- Depreciation: Increase from 0.9% to 4%
- R & M: increase from 0.85% to 2%
Amazon Go Financial Analysis
2- Forecasting Analysis
Financial Elements % Seattle Strategy
Average Sales 100% 3,142,500$ 6,285,000,000$
Cost Of Good Sold 55% (1,728,375)$ (3,456,750,000)$
Gross Margin 45% 1,414,125$ 2,828,250,000$
Labor and Benefits 20% (628,500)$ 1,257,000,000$
Rent 2% (58,765)$ 117,529,500$
Utilities 1.48% (46,509)$ 93,018,000$
Inventory Shrinkage 0.48% (15,084)$ 30,168,000$
Supplies 1.32% (41,481)$ 82,962,000$
Advertising 1.24% (38,967)$ 77,934,000$
Depreciation 4.00% (125,700)$ 251,400,000$
Repair and maintenance2.00% (62,850)$ 125,700,000$
Interest 0.32% (10,056)$ 20,112,000$
Total Operating Costs 33% (1,027,912)$ 2,055,823,500$
Net Profit 12% 386,213$ 4,884,073,500$
Annual Cash Flow
Amazon Go Financial Analysis
2- Forecasting Analysis
Net Present Value (NPV)
Negative Scenario by using Amazon’s Market Discount (CAPM)
Prior 2018 2018 2019 2020 2021 2022 2023 2024 2025
Number of stores 1 8 50 150 280 380 480 651
Cumulative # of stores 1 9 59 209 489 869 1349 2000
Discount 12.34%
Cash-Flow 511,913$ 4,095,306$ 25,595,663$ 76,786,988$ 143,335,710$ 194,527,035$ 245,718,360$ 333,255,526$
Cumulative CF 511,913$ 4,607,219$ 30,202,882$ 106,989,869$ 250,325,579$ 444,852,614$ 690,570,974$ 1,023,826,500$
Discounted CF 2,271,575,175$ 455,682$ 4,101,139$ 26,885,243$ 95,237,555$ 222,828,538$ 395,987,729$ 614,715,128$ 911,364,162$
Investment
Technology (50,000)$ (400,000)$ (2,500,000)$ (7,500,000)$ (14,000,000)$ (19,000,000)$ (24,000,000)$ (32,550,000)$
Store equipment (320,000.00)$ (2,560,000.00)$ (16,000,000)$ (48,000,000)$ (89,600,000)$ (121,600,000)$ (153,600,000)$ (208,320,000)$
Total additional Investment (370,000)$ (2,960,000)$ (18,500,000)$ (55,500,000)$ (103,600,000)$ (140,600,000)$ (177,600,000)$ (240,870,000)$
Discounted Additional Investment (658,714,616)$ (329,357)$ (2,634,858)$ (16,467,865)$ (49,403,596)$ (92,220,046)$ (125,155,777)$ (158,091,508)$ (214,411,608)$
R&D + CAPEX (1,620,000,000.00)$
Total Investment (2,278,714,616)$
Net Present Value (7,139,442)$
Amazon Go Financial Analysis
2- Forecasting Analysis
Net Present Value (NPV)
Positive Scenario by using Amazon’s Weighted Average Cost of Capital (WACC)
Prior 2018 2018 2019 2020 2021 2022 2023 2024 2025
Number of stores 1 8 50 150 280 380 480 651
Cumulative # of stores 1 9 59 209 489 869 1349 2000
Discount 8.74%
Cash-Flow 511,913$ 4,095,306$ 25,595,663$ 76,786,988$ 143,335,710$ 194,527,035$ 245,718,360$ 333,255,526$
Cumulative CF 511,913$ 4,607,219$ 30,202,882$ 106,989,869$ 250,325,579$ 444,852,614$ 690,570,974$ 1,023,826,500$
Discounted CF 2,346,779,061$ 470,768$ 4,236,913$ 27,775,319$ 98,390,536$ 230,205,609$ 409,097,493$ 635,066,189$ 941,536,233$
Investment
Technology (50,000)$ (400,000)$ (2,500,000)$ (7,500,000)$ (14,000,000)$ (19,000,000)$ (24,000,000)$ (32,550,000)$
Store equipment (320,000.00)$ (2,560,000.00)$ (16,000,000)$ (48,000,000)$ (89,600,000)$ (121,600,000)$ (153,600,000)$ (208,320,000)$
Total additional Investment (370,000)$ (2,960,000)$ (18,500,000)$ (55,500,000)$ (103,600,000)$ (140,600,000)$ (177,600,000)$ (240,870,000)$
Discounted Additional Investment (680,522,347)$ (340,261)$ (2,722,089)$ (17,013,059)$ (51,039,176)$ (95,273,129)$ (129,299,246)$ (163,325,363)$ (221,510,024)$
R&D + CAPEX (1,620,000,000.00)$
Total Investment (2,300,522,347)$
Net Present Value 46,256,714$
Amazon Go Financial Analysis
2- Forecasting Analysis
Conclusion:
The grocery retailing market is risky for the company due to the following elements:
• The market has a small average net profit
• Difficulties to switch costs from a traditional grocery retail benchmark
• Sensitivity of the project regarding the discount
• The obligation of the company to open 2,000 stores within 7 years
• Therefore, Amazon needs for an Alternative Financial Stream to reduce the
financial risk
Amazon Go Financial Analysis
3- Alternative Financial Stream
• Amazon should sell the technology to other retail stores
• Market size of 38,441 groceries stores in the U.S worth $50 billion according to Loup
Ventures
• With 5% of shares, Amazon can make an annual sales of $240 Million and an annual
profit of $60M
• This will reduce the financial risk of the actual corporate strategy of Amazon
Amazon Go T.O.E Analysis
1) Technical Considerations
• Hold two patents to protect their innovations & licensing possibility
• Error rate of technology, missed items, lost sales
• Competing technology being developed by Microsoft, Wal-Mart, Costco, Alibaba
• Technology creates “exclusive” access environment
• Customer information could be used to enhance experience on other platforms
Amazon Go T.O.E Analysis
1) Operational Considerations
• Savings from less staff, allows focus on merchandising & customer services
• Continuing fresh product creation on site verses centralizing production
• Partnering Whole Foods to take advantage of systems and expertise
• Stocking Amazon Go with items produced or stocked by Whole Foods
• Customers purchasing age restricted products
Amazon Go T.O.E Analysis
3) Economic Considerations
• Technology and operations costs verses revenue generated by store
• Estimating 900k per store in annual sales
• Choosing high volume locations with appeal to key demographics
• Retail network role out cost verses licencing technology to others
• Competing against retailers already operating in retail store space
• Retail Industry profit margin of 1-2%
Amazon Go T.O.E Analysis
Risks
• Competitors creating their own versions of Amazon Go’s technology
• Downtime & closure caused by technology issues
• Hacking and privacy concerns
• Competing against established retailers in the retail space
• Low net profit margins (1-2%) leave small margin for error
• Negative impact of putting people out of work in the retail industry
• Large number of stores needed to breakeven (estimated 2000 stores)
Recommendations
• Hybrid approach of developing own store network and licensing technology to non
competing retailers
• Should grow store network to 2000 stores by 2025
• Make a subsidiary of Whole Foods to take advantage of systems & expertise
• Centralise fresh food production to enhance operating results
• Make concept less exclusive to increase viability of stores and potential store sites
Thank You

Amazon go feasibility study

  • 1.
    Presented by: Ammine AitAbdeslam Chantelle Walsh David Calton Feasibility Study of Amazon Go
  • 2.
    Summary of thePresentation 01 02 03 Amazon at a Glance 04 The concept of Amazon Go Amazon Go Business drivers & limits Schedule of Implementation 06 Amazon Go T.O.E Analysis 05 Amazon Go Financial Analysis 07 Recommendation
  • 3.
    Amazon at aGlance #1 the largest online retail store in term of revenue and market capitalization. Founded on July 5, 1994 by • Jeff Bezos • Net Worth $105B Employs over 563,100 professionals Vision: • Global Reach • Customer Prioritizing • Widest Selection of Products Strategy: • Cost leadership • Innovation Mission: • Lowest Prices • Best Selection • Utmost Convenience Services: Retail Products, Retail third-party Seller Service, Retail Subscription Services, Amazon Web Ser vice and Others
  • 4.
    The concept ofAmazon Go Amazon Go What it is ? Amazon Go relies on their “Just walk out technology” The technology uses: • Sensor fusion • Computer vision • Deep learning algorithms. These technologies keep track of the items taken off the shelves and returned as well as what is in your cart.
  • 5.
    The concept ofAmazon Go Amazon Go how it works
  • 6.
    Amazon Go inLive Action
  • 7.
    Amazon Go BusinessDrivers & Limits Amazon Go Business Drivers 1- Data Analysis for better services: Place to gather data with the aim to increase the Customer Satisfaction and Retention 2- Synergy with other Amazon services: The strategy of Amazon is providing Amazon Go as a complement to AWS for and marketplace platform analytics 3- Customer healthiness and wellness: The Amazon Go store provides only healthy fresh food in kits and ready to eat snacks mainly provided by Whole Food 4- Increase the profit margin of the grocery sector: The Grocery Market has a unique financial characteristic to be not strongly profitable with an average of 1.7% of profit. Amazon Go technology will impact directly and indirectly the operating costs of a store for a better Profitability.
  • 8.
    Amazon Go Businessdrivers & limits Amazon Go Business Limits 1- Cost / Benefit of the project: Amazon Go is a costly project estimated at $1.69 Billion for the company that it will takes years to be profitable with the adequate strategy. 2- Competitors reaction: The actual competitors such as Microsoft and Alibaba are developing a similar technology by using the Radio Frequency Identification (RFID) technology for payments that could help Walmart to compete with Amazon 3- Workforce and Regulation: Amazon Go is targeting principally the 2.3 Million cashier jobs in the United-States estimated to be $37 Billion in potentially lost income nationwide. Amazon should anticipate any law suit from Unions such as United Food and Commercial Workers (UFCW)
  • 9.
    Amazon Go Businessdrivers & limits Amazon Go Porter Analysis - Technological and Financial Barriers - The new entrants need to be innovative - Amazon used its technology and Whole food to enter the market - Customers have a great power due to the availability of the stores - Amazon has to provide cheap/quality product with an outstanding purchase experience - Great pressure from the competitor such as Walmart and Costco - Amazon should create a niche by targeting first the professional people - Existing technology Self-checkout or traditional checkout “Cashier” - According to National Grocery Association, 90% of stores Managers, do not want to use the technology JWO - Amazon-Whole Food merger was to integrate a major supplier within the supply chain by offering the 360 brand product
  • 10.
    Schedule of Implementation Acquisitionof SnapTeel. “Image Recognition Tech” 2013 2014 2017 2018 20252009 #1 Patent: Detecting item interaction and movement #2 Patent: Transitioning items from the materials handling facility Launching the 1st JWO store in Seattle 1- Acquisition of Whole Food 2- Beta Test of the store Strategical Plan for opening 2,000 stores in the U.S.
  • 11.
    Amazon Go FinancialAnalysis Financial feasibility of Amazon Go - Financial Strategy: Financial Ability of Amazon to develop technology and making them ready to use - Forecasting Analysis: Forecasting the financial contribution of Amazon go with the actual strategy of the group - Alternative financial stream: Suggesting a new stream of revenue that will position Amazon at a safer place
  • 12.
    Amazon Go FinancialAnalysis 1- Financial Strategy A) Amazon financial investment Cash Conversion Cycle Capital Budget for CAPEX and R&D
  • 13.
    Amazon Go FinancialAnalysis 1- Financial Strategy B) Financial Benchmark of the Grocery Market - The potential size of sector: This sector considered one of the safest areas to invest due to its estimated size in 2016 of $1.4 Trillion in the United States, which 1% of this sector represents 10% of Amazon revenue. - Financial indicators: Weekly Sales per store: Average $305,105 and Ranges from $30,600 to $1,641,000 Average annual sales per square foot: $1,725 per sq. ft. weekly sales Weekly Transaction per store: Average 11,211 and Ranges from 2,147 to 29,477 Sales and transaction by checkout: Weekly store sales by checkout $29,194 and Weekly transaction by checkout 1,241 The gross margin: it is virtually flat at 56.48% The net profit: 1.65% for Publicly Traded companies and 4.01% for Profit leaders
  • 14.
    Amazon Go FinancialAnalysis B) Financial Benchmark of the Grocery Market COGS 55% Labor 34% Rent 1.87% Shrinkage 1.44% Supplies 1.32% Depreciation 0.9% R & M 0.85% Interest 0.32% Other 3.69% COGS 55% Labor 20% Rent 1.87% Shrinkage0.96% Supplies 1.32% Depreciation 4% R & M 2% Interest 0.32% Others 3.69 Component of the Total Cost in % Current market Total Cost in % Impact of Amazon Go on the Total Cost in % Comments: Net profit: Increase from 1.69% to 12% Positive impact - Labor costs: decrease from 34% to 20% - Shrinkage: decrease from 1.44% to 0.96% Negative impact: - Depreciation: Increase from 0.9% to 4% - R & M: increase from 0.85% to 2%
  • 15.
    Amazon Go FinancialAnalysis 2- Forecasting Analysis Financial Elements % Seattle Strategy Average Sales 100% 3,142,500$ 6,285,000,000$ Cost Of Good Sold 55% (1,728,375)$ (3,456,750,000)$ Gross Margin 45% 1,414,125$ 2,828,250,000$ Labor and Benefits 20% (628,500)$ 1,257,000,000$ Rent 2% (58,765)$ 117,529,500$ Utilities 1.48% (46,509)$ 93,018,000$ Inventory Shrinkage 0.48% (15,084)$ 30,168,000$ Supplies 1.32% (41,481)$ 82,962,000$ Advertising 1.24% (38,967)$ 77,934,000$ Depreciation 4.00% (125,700)$ 251,400,000$ Repair and maintenance2.00% (62,850)$ 125,700,000$ Interest 0.32% (10,056)$ 20,112,000$ Total Operating Costs 33% (1,027,912)$ 2,055,823,500$ Net Profit 12% 386,213$ 4,884,073,500$ Annual Cash Flow
  • 16.
    Amazon Go FinancialAnalysis 2- Forecasting Analysis Net Present Value (NPV) Negative Scenario by using Amazon’s Market Discount (CAPM) Prior 2018 2018 2019 2020 2021 2022 2023 2024 2025 Number of stores 1 8 50 150 280 380 480 651 Cumulative # of stores 1 9 59 209 489 869 1349 2000 Discount 12.34% Cash-Flow 511,913$ 4,095,306$ 25,595,663$ 76,786,988$ 143,335,710$ 194,527,035$ 245,718,360$ 333,255,526$ Cumulative CF 511,913$ 4,607,219$ 30,202,882$ 106,989,869$ 250,325,579$ 444,852,614$ 690,570,974$ 1,023,826,500$ Discounted CF 2,271,575,175$ 455,682$ 4,101,139$ 26,885,243$ 95,237,555$ 222,828,538$ 395,987,729$ 614,715,128$ 911,364,162$ Investment Technology (50,000)$ (400,000)$ (2,500,000)$ (7,500,000)$ (14,000,000)$ (19,000,000)$ (24,000,000)$ (32,550,000)$ Store equipment (320,000.00)$ (2,560,000.00)$ (16,000,000)$ (48,000,000)$ (89,600,000)$ (121,600,000)$ (153,600,000)$ (208,320,000)$ Total additional Investment (370,000)$ (2,960,000)$ (18,500,000)$ (55,500,000)$ (103,600,000)$ (140,600,000)$ (177,600,000)$ (240,870,000)$ Discounted Additional Investment (658,714,616)$ (329,357)$ (2,634,858)$ (16,467,865)$ (49,403,596)$ (92,220,046)$ (125,155,777)$ (158,091,508)$ (214,411,608)$ R&D + CAPEX (1,620,000,000.00)$ Total Investment (2,278,714,616)$ Net Present Value (7,139,442)$
  • 17.
    Amazon Go FinancialAnalysis 2- Forecasting Analysis Net Present Value (NPV) Positive Scenario by using Amazon’s Weighted Average Cost of Capital (WACC) Prior 2018 2018 2019 2020 2021 2022 2023 2024 2025 Number of stores 1 8 50 150 280 380 480 651 Cumulative # of stores 1 9 59 209 489 869 1349 2000 Discount 8.74% Cash-Flow 511,913$ 4,095,306$ 25,595,663$ 76,786,988$ 143,335,710$ 194,527,035$ 245,718,360$ 333,255,526$ Cumulative CF 511,913$ 4,607,219$ 30,202,882$ 106,989,869$ 250,325,579$ 444,852,614$ 690,570,974$ 1,023,826,500$ Discounted CF 2,346,779,061$ 470,768$ 4,236,913$ 27,775,319$ 98,390,536$ 230,205,609$ 409,097,493$ 635,066,189$ 941,536,233$ Investment Technology (50,000)$ (400,000)$ (2,500,000)$ (7,500,000)$ (14,000,000)$ (19,000,000)$ (24,000,000)$ (32,550,000)$ Store equipment (320,000.00)$ (2,560,000.00)$ (16,000,000)$ (48,000,000)$ (89,600,000)$ (121,600,000)$ (153,600,000)$ (208,320,000)$ Total additional Investment (370,000)$ (2,960,000)$ (18,500,000)$ (55,500,000)$ (103,600,000)$ (140,600,000)$ (177,600,000)$ (240,870,000)$ Discounted Additional Investment (680,522,347)$ (340,261)$ (2,722,089)$ (17,013,059)$ (51,039,176)$ (95,273,129)$ (129,299,246)$ (163,325,363)$ (221,510,024)$ R&D + CAPEX (1,620,000,000.00)$ Total Investment (2,300,522,347)$ Net Present Value 46,256,714$
  • 18.
    Amazon Go FinancialAnalysis 2- Forecasting Analysis Conclusion: The grocery retailing market is risky for the company due to the following elements: • The market has a small average net profit • Difficulties to switch costs from a traditional grocery retail benchmark • Sensitivity of the project regarding the discount • The obligation of the company to open 2,000 stores within 7 years • Therefore, Amazon needs for an Alternative Financial Stream to reduce the financial risk
  • 19.
    Amazon Go FinancialAnalysis 3- Alternative Financial Stream • Amazon should sell the technology to other retail stores • Market size of 38,441 groceries stores in the U.S worth $50 billion according to Loup Ventures • With 5% of shares, Amazon can make an annual sales of $240 Million and an annual profit of $60M • This will reduce the financial risk of the actual corporate strategy of Amazon
  • 20.
    Amazon Go T.O.EAnalysis 1) Technical Considerations • Hold two patents to protect their innovations & licensing possibility • Error rate of technology, missed items, lost sales • Competing technology being developed by Microsoft, Wal-Mart, Costco, Alibaba • Technology creates “exclusive” access environment • Customer information could be used to enhance experience on other platforms
  • 21.
    Amazon Go T.O.EAnalysis 1) Operational Considerations • Savings from less staff, allows focus on merchandising & customer services • Continuing fresh product creation on site verses centralizing production • Partnering Whole Foods to take advantage of systems and expertise • Stocking Amazon Go with items produced or stocked by Whole Foods • Customers purchasing age restricted products
  • 22.
    Amazon Go T.O.EAnalysis 3) Economic Considerations • Technology and operations costs verses revenue generated by store • Estimating 900k per store in annual sales • Choosing high volume locations with appeal to key demographics • Retail network role out cost verses licencing technology to others • Competing against retailers already operating in retail store space • Retail Industry profit margin of 1-2%
  • 23.
    Amazon Go T.O.EAnalysis Risks • Competitors creating their own versions of Amazon Go’s technology • Downtime & closure caused by technology issues • Hacking and privacy concerns • Competing against established retailers in the retail space • Low net profit margins (1-2%) leave small margin for error • Negative impact of putting people out of work in the retail industry • Large number of stores needed to breakeven (estimated 2000 stores)
  • 24.
    Recommendations • Hybrid approachof developing own store network and licensing technology to non competing retailers • Should grow store network to 2000 stores by 2025 • Make a subsidiary of Whole Foods to take advantage of systems & expertise • Centralise fresh food production to enhance operating results • Make concept less exclusive to increase viability of stores and potential store sites
  • 25.

Editor's Notes

  • #4 Amazon’s vision statement is “To be Earth’s most customer-centric company, where customers can find and discover anything they might want to buy online.” Amazon’s mission statement is “We strive to offer our customers the lowest possible prices, the best available selection, and the utmost convenience.”
  • #7 https://www.youtube.com/watch?v=NrmMk1Myrxc&t=37s
  • #13 Cash estimated quarterly of $22Billion
  • #15 Shrinkage: Annual loss of $50 billion
  • #21 Amazon developed the technology in house and hold patents that protect their it meaning that the costs of the technology is limited to installation and maintenance. Lower variable costs from not having to hire cashiers. Issues with the technology include lost sales from the purchase of items not being recorded although the error rate is small and improvements are being made to system continuously. Some other considerations include the costs of rolling the technology out of the as Amazon Go expands and the high up front costs of setting up the technology in each store. The major risk in this area is the competing technology standards being created by competitors.
  • #22 Major operational considerations include the allowing staff to focus on merchandising and customers service instead of processing transactions and loss prevention as well as the potential benefits of having a centralized facility to make fresh products that can then be shipped out to stores instead of having staff in each store creating fresh products and the logistics involved. Other more general considerations include setting the retail management, administration and ordering systems and the potential costs savings from using Whole Foods current management, support and ordering systems.
  • #23 Major economic considerations are the technology and operating costs for each store compared to the amount revenue generated and the payback period on the initial investment in the technology required to run the store. Revenue per store was estimated at 900K per store in annual sales by one analyst and whether it is possible to be profitable at that level. Other considerations include choosing location that locations with large numbers of young technologically savvy potential customers and whether it makes more sense to role out the technology internally or license it to retailers that are already in place. The major risk of rolling out a store network involves potential competition from other retailers in the convenience store space.