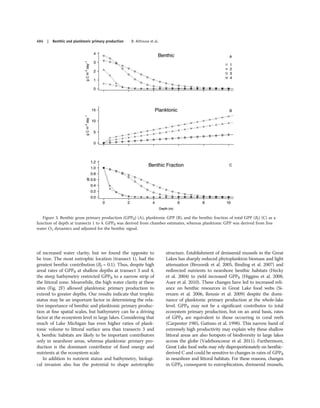
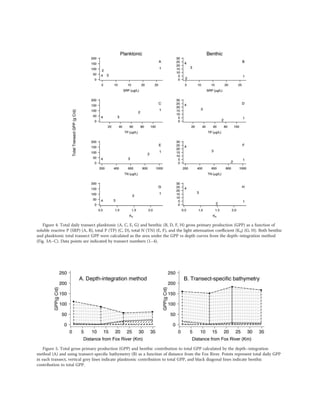
- Researchers measured benthic and planktonic primary production along a nutrient gradient in Green Bay, Lake Michigan.
- Benthic production decreased with increasing nutrients, while planktonic production increased with nutrients.
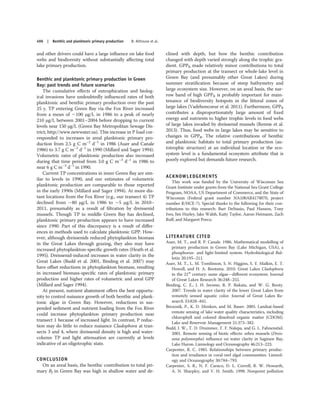
- Near the Fox River mouth, planktonic production dominated (95%), but farther away production was split between benthic and planktonic (40% benthic).
- Autotrophic structure, or the balance between benthic and planktonic production, varied significantly based on nutrient levels and bathymetry across Green Bay.