Black magic specialist in Saudi Arabia (Kala jadu expert in UK) Bangali Amil ...
alltel 4q05highlights
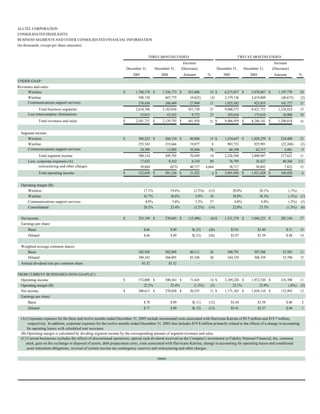
1. ALLTEL CORPORATION
CONSOLIDATED HIGHLIGHTS
BUSINESS SEGMENTS AND OTHER CONSOLIDATED FINANCIAL INFORMATION
(In thousands, except per share amounts)
THREE MONTHS ENDED TWELVE MONTHS ENDED
Increase Increase
December 31, December 31, (Decrease) December 31, December 31, (Decrease)
2005 2004 Amount % 2005 2004 Amount %
UNDER GAAP:
Revenues and sales:
Wireless $ 1,760,178 $ 1,326,772 $ 433,406 33 $ 6,275,857 $ 5,078,087 $ 1,197,770 24
Wireline 598,150 607,775 (9,625) (2) 2,379,136 2,419,809 (40,673) (2)
Communications support services 276,438 248,489 27,949 11 1,025,582 923,855 101,727 11
Total business segments 2,634,766 2,183,036 451,730 21 9,680,575 8,421,751 1,258,824 15
Less intercompany eliminations 53,015 43,243 9,772 23 193,616 175,610 18,006 10
Total revenues and sales $ 2,581,751 $ 2,139,793 $ 441,958 21 $ 9,486,959 $ 8,246,141 $ 1,240,818 15
Segment income:
Wireless $ 300,222 $ 260,154 $ 40,068 15 $ 1,254,647 $ 1,020,239 $ 234,408 23
Wireline 255,543 235,666 19,877 8 903,723 925,991 (22,268) (2)
Communications support services 24,389 13,885 10,504 76 68,198 62,717 5,481 9
Total segment income 580,154 509,705 70,449 14 2,226,568 2,008,947 217,621 11
Less: corporate expenses (A) 17,652 9,342 8,310 89 76,795 36,427 40,368 111
restructuring and other charges 39,844 (873) 40,717 4,664 58,717 50,892 7,825 15
Total operating income $ 522,658 $ 501,236 $ 21,422 4$ 2,091,056 $ 1,921,628 $ 169,428 9
Operating margin (B):
Wireless 17.1% 19.6% (2.5%) (13) 20.0% 20.1% (.1%) -
Wireline 42.7% 38.8% 3.9% 10 38.0% 38.3% (.3%) (1)
Communications support services 8.8% 5.6% 3.2% 57 6.6% 6.8% (.2%) (3)
Consolidated 20.2% 23.4% (3.2%) (14) 22.0% 23.3% (1.3%) (6)
Net income $ 255,149 $ 270,645 $ (15,496) (6) $ 1,331,379 $ 1,046,235 $ 285,144 27
Earnings per share:
Basic $.66 $.89 $(.23) (26) $3.91 $3.40 $.51 15
Diluted $.66 $.89 $(.23) (26) $3.87 $3.39 $.48 14
Weighted average common shares:
Basic 382,920 302,809 80,111 26 340,791 307,288 33,503 11
Diluted 389,343 304,095 85,248 28 344,129 308,339 35,790 12
Annual dividend rate per common share $1.52 $1.52 - -
FROM CURRENT BUSINESSES (NON-GAAP) (C):
Operating income $ 572,008 $ 500,363 $ 71,645 14 $ 2,189,228 $ 1,972,520 $ 216,708 11
Operating margin (B) 22.2% 23.4% (1.2%) (5) 23.1% 23.9% (.8%) (3)
Net income $ 300,613 $ 270,058 $ 30,555 11 $ 1,171,103 $ 1,038,110 $ 132,993 13
Earnings per share:
Basic $.78 $.89 $(.11) (12) $3.44 $3.38 $.06 2
Diluted $.77 $.89 $(.12) (13) $3.41 $3.37 $.04 1
(A) Corporate expenses for the three and twelve months ended December 31, 2005 include incremental costs associated with Hurricane Katrina of $9.5 million and $19.7 million,
respectively. In addition, corporate expenses for the twelve months ended December 31, 2005 also includes $19.8 million primarily related to the effects of a change in accounting
for operating leases with scheduled rent increases.
(B) Operating margin is calculated by dividing segment income by the corresponding amount of segment revenues and sales.
(C) Current businesses excludes the effects of discontinued operations, special cash dividend received on the Company's investment in Fidelity National Financial, Inc. common
stock, gain on the exchange or disposal of assets, debt prepayment costs, costs associated with Hurricane Katrina, change in accounting for operating leases and conditional
asset retirement obligations, reversal of certain income tax contingency reserves and restructuring and other charges.
-more-
2. ALLTEL CORPORATION
CONSOLIDATED STATEMENTS OF INCOME UNDER GAAP-Page 2
(In thousands, except per share amounts)
THREE MONTHS ENDED TWELVE MONTHS ENDED
December 31, December 31, December 31, December 31,
2005 2004 2005 2004
Revenues and sales:
Service revenues $ 2,263,605 $ 1,897,402 $ 8,380,501 $ 7,374,279
Product sales 318,146 242,391 1,106,458 871,862
Total revenues and sales 2,581,751 2,139,793 9,486,959 8,246,141
Costs and expenses:
Cost of services 736,857 604,818 2,743,745 2,374,220
Cost of products sold 381,764 299,603 1,315,320 1,075,545
Selling, general, administrative and other 496,549 402,489 1,795,516 1,524,165
Depreciation and amortization 404,079 332,520 1,482,605 1,299,691
Restructuring and other charges 39,844 (873) 58,717 50,892
Total costs and expenses 2,059,093 1,638,557 7,395,903 6,324,513
Operating income 522,658 501,236 2,091,056 1,921,628
Equity earnings in unconsolidated partnerships 6,992 14,970 43,383 68,486
Minority interest in consolidated partnerships (11,267) (19,227) (69,105) (80,096)
Other income, net 2,752 11,360 158,788 34,500
Interest expense (86,134) (87,512) (332,588) (352,490)
Gain on exchange or disposal of assets and other - - 218,830 -
Income from continuing operations before income taxes 435,001 420,827 2,110,364 1,592,028
Income taxes 176,681 150,182 801,836 565,331
Income from continuing operations 258,320 270,645 1,308,528 1,026,697
Income from discontinued operations (net of income taxes) 4,270 - 30,292 19,538
Income before cumulative effect of accounting change 262,590 270,645 1,338,820 1,046,235
Cumulative effect of accounting change (net of income taxes) (7,441) - (7,441) -
Net income 255,149 270,645 1,331,379 1,046,235
Preferred dividends 21 25 93 103
Net income applicable to common shares $ 255,128 $ 270,620 $ 1,331,286 $ 1,046,132
Basic earnings per share:
Income from continuing operations $.67 $.89 $3.84 $3.34
Income from discontinued operations .01 - .09 .06
Cumulative effect of accounting change (.02) (.02)
- -
Net income $.66 $.89 $3.91 $3.40
Diluted earnings per share:
Income from continuing operations $.67 $.89 $3.80 $3.33
Income from discontinued operations .01 - .09 .06
Cumulative effect of accounting change (.02) (.02)
- -
Net income $.66 $.89 $3.87 $3.39
-more-
3. ALLTEL CORPORATION
RECONCILIATION OF RESULTS OF OPERATIONS UNDER GAAP TO RESULTS OF OPERATIONS FROM CURRENT BUSINESSES (NON-GAAP)-Page 3
for the three months ended December 31, 2005
(In thousands, except per share amounts)
Corporate
Results of Items Results of Segment Information Operations
Operations Excluded from Operations Communications and
Under Current from Current Support Intercompany
GAAP Businesses Businesses Wireless Wireline Services Eliminations
Revenues and sales:
Service revenues $ 2,263,605 $ - $ 2,263,605 $ 1,643,195 $ 588,349 $ 82,323 $ (50,262)
Product sales 318,146 - 318,146 116,983 9,801 194,115 (2,753)
Total revenues and sales 2,581,751 - 2,581,751 1,760,178 598,150 276,438 (53,015)
Costs and expenses:
Cost of services 736,857 (9,506) (A) 727,351 543,352 165,116 58,077 (39,194)
Cost of products sold 381,764 - 381,764 218,678 6,899 168,545 (12,358)
Selling, general, administrative and other 496,549 - 496,549 411,139 63,637 16,874 4,899
Depreciation and amortization 404,079 - 404,079 286,787 106,955 8,553 1,784
Restructuring and other charges 39,844 (39,844) (B)(C) - - - - -
Total costs and expenses 2,059,093 (49,350) 2,009,743 1,459,956 342,607 252,049 (44,869)
Operating income 572,008 $ 300,222 $ 255,543 $ 24,389 $ (8,146)
522,658 49,350
Equity earnings in unconsolidated partnerships 6,992 - 6,992
Minority interest in consolidated partnerships (11,267) - (11,267)
Other income, net 2,752 - 2,752
Interest expense (86,134) - (86,134)
Gain on exchange or disposal of assets and other - - -
Income from continuing operations before income taxes 435,001 49,350 484,351
Income taxes 176,681 7,057 (K) 183,738
Income from continuing operations 258,320 42,293 300,613
Income from discontinued operations (net of income taxes) 4,270 (4,270) (M) -
Income before cumulative effect of accounting change 262,590 38,023 300,613
Cumulative effect of accounting change (net of income taxes) (7,441) 7,441 (N) -
Net income 255,149 45,464 300,613
Preferred dividends 21 - 21
Net income applicable to common shares $ 255,128 $ 45,464 $ 300,592
Basic earnings per share:
Income from continuing operations $.67 $.11 $.78
Income from discontinued operations .01 (.01) -
Cumulative effect of accounting change (.02) .02 -
Net income $.66 $.12 $ .78
Diluted earnings per share:
Income from continuing operations $.67 $.10 $.77
Income from discontinued operations .01 (.01) -
Cumulative effect of accounting change (.02) .02 -
Net income $.66 $.11 $.77
See notes on pages 7 and 8 for a description of the line items marked (A) - (N).
-more-
4. ALLTEL CORPORATION
RECONCILIATION OF RESULTS OF OPERATIONS UNDER GAAP TO RESULTS OF OPERATIONS FROM CURRENT BUSINESSES (NON-GAAP)-Page 4
for the three months ended December 31, 2004
(In thousands, except per share amounts)
Corporate
Results of Items Results of Segment Information Operations
Operations Excluded from Operations Communications and
Under Current from Current Support Intercompany
GAAP Businesses Businesses Wireless Wireline Services Eliminations
Revenues and sales:
Service revenues $ 1,897,402 $ - $ 1,897,402 $ 1,252,773 $ 597,315 $ 81,462 $ (34,148)
Product sales 242,391 - 242,391 73,999 10,460 167,027 (9,095)
Total revenues and sales 2,139,793 - 2,139,793 1,326,772 607,775 248,489 (43,243)
Costs and expenses:
Cost of services 604,818 - 604,818 399,114 173,146 64,297 (31,739)
Cost of products sold 299,603 - 299,603 154,747 8,576 146,997 (10,717)
Selling, general, administrative and other 402,489 - 402,489 318,968 62,466 14,856 6,199
Depreciation and amortization 332,520 - 332,520 193,789 127,921 8,454 2,356
Restructuring and other charges (873) 873 (I) - - - - -
Total costs and expenses 1,638,557 873 1,639,430 1,066,618 372,109 234,604 (33,901)
Operating income 500,363 $ 260,154 $ 235,666 $ 13,885 $ (9,342)
501,236 (873)
Equity earnings in unconsolidated partnerships 14,970 - 14,970
Minority interest in consolidated partnerships (19,227) - (19,227)
Other income, net 11,360 - 11,360
Interest expense (87,512) - (87,512)
Gain on exchange or disposal of assets and other - - -
Income from continuing operations before income taxes 420,827 (873) 419,954
Income taxes 150,182 (286) (K) 149,896
Income from continuing operations 270,645 (587) 270,058
Income from discontinued operations (net of income taxes) - - -
Income before cumulative effect of accounting change 270,645 (587) 270,058
Cumulative effect of accounting change (net of income taxes) - - -
Net income 270,645 (587) 270,058
Preferred dividends 25 - 25
Net income applicable to common shares $ 270,620 $ (587) $ 270,033
Basic earnings per share:
Income from continuing operations $.89 $- $.89
Income from discontinued operations - - -
Cumulative effect of accounting change - - -
Net income $.89 $- $.89
Diluted earnings per share:
Income from continuing operations $.89 $- $.89
Income from discontinued operations - - -
Cumulative effect of accounting change - - -
Net income $.89 $- $.89
See notes on pages 7 and 8 for a description of the line items marked (A) - (N).
-more-
5. ALLTEL CORPORATION
RECONCILIATION OF RESULTS OF OPERATIONS UNDER GAAP TO RESULTS OF OPERATIONS FROM CURRENT BUSINESSES (NON-GAAP)-Page 5
for the twelve months ended December 31, 2005
(In thousands, except per share amounts)
Corporate
Results of Items Results of Segment Information Operations
Operations Excluded from Operations Communications and
Under Current from Current Support Intercompany
GAAP Businesses Businesses Wireless Wireline Services Eliminations
Revenues and sales:
Service revenues $ 8,380,501 $ - $ 8,380,501 $ 5,895,143 $ 2,336,741 $ 322,665 $ (174,048)
Product sales 1,106,458 - 1,106,458 380,714 42,395 702,917 (19,568)
Total revenues and sales 9,486,959 - 9,486,959 6,275,857 2,379,136 1,025,582 (193,616)
Costs and expenses:
Cost of services 2,743,745 (37,557) (D)(E) 2,706,188 1,917,754 705,506 236,160 (153,232)
Cost of products sold 1,315,320 - 1,315,320 697,593 32,919 621,864 (37,056)
Selling, general, administrative and other 1,795,516 (1,898) (D) 1,793,618 1,445,165 256,259 65,494 26,700
Depreciation and amortization 1,482,605 - 1,482,605 960,698 480,729 33,866 7,312
Restructuring and other charges 58,717 (58,717) (C)(F) - - - - -
Total costs and expenses 7,395,903 (98,172) 7,297,731 5,021,210 1,475,413 957,384 (156,276)
Operating income 2,189,228 $ 1,254,647 $ 903,723 $ 68,198 $ (37,340)
2,091,056 98,172
Equity earnings in unconsolidated partnerships 43,383 - 43,383
Minority interest in consolidated partnerships (69,105) - (69,105)
Other income, net 158,788 (116,036) (D)(G) 42,752
Interest expense (332,588) - (332,588)
Gain on exchange or disposal of assets and other 218,830 (218,830) (H) -
Income from continuing operations before income taxes 2,110,364 (236,694) 1,873,670
Income taxes 801,836 (99,269) (K) 702,567
Income from continuing operations 1,308,528 (137,425) 1,171,103
Income from discontinued operations (net of income taxes) 30,292 (30,292) (M) -
Income before cumulative effect of accounting change 1,338,820 (167,717) 1,171,103
Cumulative effect of accounting change (net of income taxes) (7,441) 7,441 (N) -
Net income 1,331,379 (160,276) 1,171,103
Preferred dividends 93 - 93
Net income applicable to common shares $ 1,331,286 $ (160,276) $ 1,171,010
Basic earnings per share:
Income from continuing operations $3.84 $(.40) $3.44
Income from discontinued operations .09 (.09) -
Cumulative effect of accounting change (.02) .02 -
Net income $3.91 $(.47) $3.44
Diluted earnings per share:
Income from continuing operations $3.80 $(.39) $3.41
Income from discontinued operations .09 (.09) -
Cumulative effect of accounting change (.02) .02 -
Net income $3.87 $(.46) $3.41
See notes on pages 7 and 8 for a description of the line items marked (A) - (N).
-more-
6. ALLTEL CORPORATION
RECONCILIATION OF RESULTS OF OPERATIONS UNDER GAAP TO RESULTS OF OPERATIONS FROM CURRENT BUSINESSES (NON-GAAP)-Page 6
for the twelve months ended December 31, 2004
(In thousands, except per share amounts)
Corporate
Results of Items Results of Segment Information Operations
Operations Excluded from Operations Communications and
Under Current from Current Support Intercompany
GAAP Businesses Businesses Wireless Wireline Services Eliminations
Revenues and sales:
Service revenues $ 7,374,279 $ - $ 7,374,279 $ 4,791,235 $ 2,380,788 $ 346,662 $ (144,406)
Product sales 871,862 - 871,862 286,852 39,021 577,193 (31,204)
Total revenues and sales 8,246,141 - 8,246,141 5,078,087 2,419,809 923,855 (175,610)
Costs and expenses:
Cost of services 2,374,220 - 2,374,220 1,543,576 704,335 257,845 (131,536)
Cost of products sold 1,075,545 - 1,075,545 573,646 28,711 514,239 (41,051)
Selling, general, administrative and other 1,524,165 - 1,524,165 1,201,789 244,327 54,729 23,320
Depreciation and amortization 1,299,691 - 1,299,691 738,837 516,445 34,325 10,084
Restructuring and other charges 50,892 (50,892) (I)(J) - - - - -
Total costs and expenses 6,324,513 (50,892) 6,273,621 4,057,848 1,493,818 861,138 (139,183)
Operating income 1,972,520 $ 1,020,239 $ 925,991 $ 62,717 $ (36,427)
1,921,628 50,892
Equity earnings in unconsolidated partnerships 68,486 - 68,486
Minority interest in consolidated partnerships (80,096) - (80,096)
Other income, net 34,500 - 34,500
Interest expense (352,490) - (352,490)
Gain on exchange or disposal of assets and other - - -
Income from continuing operations before income taxes 1,592,028 50,892 1,642,920
Income taxes 565,331 39,479 (K)(L) 604,810
Income from continuing operations 1,026,697 11,413 1,038,110
Income from discontinued operations (net of income taxes) 19,538 (19,538) (L) -
Income before cumulative effect of accounting change 1,046,235 (8,125) 1,038,110
Cumulative effect of accounting change (net of income taxes) - - -
Net income 1,046,235 (8,125) 1,038,110
Preferred dividends 103 - 103
Net income applicable to common shares $ 1,046,132 $ (8,125) $ 1,038,007
Basic earnings per share:
Income from continuing operations $3.34 $.04 $3.38
Income from discontinued operations .06 (.06) -
Cumulative effect of accounting change - - -
Net income $3.40 $(.02) $3.38
Diluted earnings per share:
Income from continuing operations $3.33 $.04 $3.37
Income from discontinued operations .06 (.06) -
Cumulative effect of accounting change - - -
Net income $3.39 $(.02) $3.37
See notes on pages 7 and 8 for a description of the line items marked (A) - (N).
-more-
7. ALLTEL CORPORATION
NOTES TO RECONCILIATIONS OF RESULTS OF OPERATIONS UNDER GAAP TO RESULTS OF OPERATIONS FROM CURRENT BUSINESSES (NON-GAAP)-Page 7
As disclosed in the ALLTEL Corporation (quot;Alltelquot; or the quot;Companyquot;) Form 8-K filed on January 20, 2006, Alltel has presented in this earnings release results of operations from
current businesses which exclude the effects of discontinued operations, a special cash dividend received on the Company's investment in Fidelity National Financial, Inc.
(quot;Fidelity Nationalquot;) common stock, gain on exchange or disposal of assets, termination fees associated with the early retirement of long-term debt, costs associated with
Hurricane Katrina, a change in accounting for certain operating leases and conditional asset retirement obligations, reversal of certain income tax contingency reserves and
restructuring and other charges. Alltel’s purpose for excluding items from the current business measures is to focus on Alltel’s true earnings capacity associated with providing
telecommunication services. Management believes the items excluded from the current business measures are related to strategic activities or other events, specific to the time
and opportunity available, and, accordingly, should be excluded when evaluating the trends of the Company’s operations.
Alltel believes that presenting the current business measures assists investors in assessing the true business performance of the Company by clarifying for investors the effects
that certain items such as asset sales, restructuring expenses and other business consolidation costs arising from past acquisition and restructuring activities had on the
Company’s GAAP consolidated results of operations. The Company uses results from current businesses as management’s primary measure of the performance of its business
segments. Alltel's management, including the chief operating decision-maker, uses the current business measures consistently for all purposes, including internal reporting
purposes, the evaluation of business objectives, opportunities and performance and the determination of management compensation.
As the Company evaluates segment performance based on segment income, which is computed as revenues and sales less operating expenses, the special cash dividend, gain
on the exchange or disposal of assets, early termination of debt, costs associated with Hurricane Katrina, the effects of the change in accounting for operating leases and
conditional asset retirement obligations and restructuring and other charges have not been allocated to the business segments. In addition, none of the non-operating items
such as equity earnings in unconsolidated partnerships, minority interest expense, other income, net, interest expense and income taxes have been allocated to the segments.
(A) Alltel incurred $9.5 million of incremental costs related to Hurricane Katrina consisting of increased system maintenance costs to restore network facilities and additional losses
from bad debts. (See Note D).
(B) The Company incurred $2.1 million of integration expenses related to its acquisition completed on August 1, 2005 of Western Wireless Corporation (“Western Wireless”). These
expenses primarily consisted of system conversion costs. In addition, Alltel incurred $5.0 million of integration expenses related to the exchange of certain wireless assets with
Cingular Wireless LLC (“Cingular”) completed during the second and third quarters of 2005. The Company also incurred $1.6 million of integration expenses related to its
acquisition of Public Service Cellular Inc. (“PS Cellular”) completed on February 28, 2005. The integration expenses related to the Cingular and PS Cellular acquisitions consisted
of handset subsidies incurred to migrate the acquired customer base to CDMA handsets. The Company also recorded a $0.2 million reduction in the liabilities associated with the
wireline restructuring activities initiated during the third quarter of 2005. (See Note F).
(C) On December 9, 2005, Alltel announced that it would spin off its wireline telecommunications business to its stockholders and merge it with Valor Communications Group, Inc. In
connection with the spin-off and merger, Alltel incurred $31.3 million of incremental costs principally consisting of investment banker, audit and legal fees.
(D) Alltel incurred $19.7 million of incremental costs related to Hurricane Katrina consisting of increased long distance and roaming expenses due to providing these services to
affected customers at no charge, system maintenance costs to restore network facilities and additional losses from bad debts. These incremental costs also included Company
donations to support the hurricane relief efforts. These incremental expenses were partially offset by $5.0 million of insurance proceeds received by Alltel.
(E) Effective January 1, 2005, Alltel changed its accounting for operating leases with scheduled rent increases. Certain of the Company's operating lease agreements for cell sites and
for office and retail locations include scheduled rent escalations during the initial lease term and/or during succeeding optional renewal periods. Previously, the Company had
not recognized the scheduled increases in rent expense on a straight-line basis in accordance with the provisions of Statement of Financial Accounting Standards (quot;SFASquot;) No.
13, quot;Accounting for Leasesquot; and Financial Accounting Standards Board (quot;FASBquot;) Technical Bulletin No. 85-3, quot;Accounting for Operating Leases with Scheduled Rent
Increasesquot;. The effects of this change, which are included in corporate expenses, were not material to the Company's previously reported consolidated results of operations,
financial position or cash flows.
(F) The Company incurred $4.5 million of integration expenses related to its acquisition of Western Wireless. These expenses primarily consisted of system conversion costs and
relocation expenses. In addition, Alltel incurred $16.9 million of integration expenses related to the exchange of certain wireless assets with Cingular and incurred $1.6 million of
integration expenses related to its acquisition of PS Cellular. These integration expenses consisted of handset subsidies incurred to migrate the acquired customer base to
CDMA handsets. The Company also incurred $4.4 million in restructuring charges related to a planned workforce reduction in its wireline operations.
-more-
8. ALLTEL CORPORATION
NOTES TO RECONCILIATIONS OF RESULTS OF OPERATIONS UNDER GAAP TO RESULTS OF OPERATIONS FROM CURRENT BUSINESSES (NON-GAAP)-Page 8
(G) On March 9, 2005, Fidelity National declared a special $10 per share cash dividend to Fidelity National stockholders. The special cash dividend was received by Alltel on March
28, 2005.
(H) On April 15, 2005, Alltel and Cingular completed the exchange of certain wireless assets. In connection with this transaction, Alltel recorded a pretax gain of $158.0 million. On
April 6, 2005, Alltel recorded a pretax gain of $75.8 million from the sale of all of its shares of Fidelity National common stock. In addition, on April 8, 2005, Alltel retired all of its
issued and outstanding 7.50 percent senior notes due March 1, 2006, representing an aggregate principal amount of $450.0 million. Concurrent with the debt redemption, Alltel also
terminated the related pay variable/receive fixed, interest rate swap agreement that had been designated as a fair value hedge against the $450.0 million senior notes. In connection
with the early termination of the debt and interest rate swap agreement, Alltel incurred net pretax termination fees of approximately $15.0 million.
(I) The Company recorded a $0.9 million reduction in the liabilities associated with the restructuring efforts initiated in the first quarter of 2004 (see Note J), consisting of $0.7 million
in employee relocated expenses and $0.2 million in severance and employee benefit costs.
(J) The Company announced its plans to reorganize its operating structure and exit its competitive local exchange carrier operations in the Jacksonville, Florida market. In connection
with these activities, the Company recorded a restructuring charge of $29.3 million consisting of severance and employee benefit costs related to a planned workforce reduction,
employee relocation costs, lease termination and other restructuring-related costs. The Company also recorded a $2.3 million reduction in the liabilities associated with various
restructuring activities initiated prior to 2003. In addition, the Company recorded a write-down of $24.8 million in the carrying value of certain corporate and regional facilities to fair
value in conjunction with the proposed leasing or sale of those facilities.
(K) Tax-related effect of the items discussed in Notes A - J above.
(L) During the third quarter of 2004, the Internal Revenue Service (“IRS”) completed its fieldwork related to the audits of the Company’s consolidated federal income tax returns for the
fiscal years 1997 through 2001. As a result of the IRS completing this phase of their audits, Alltel reassessed its income tax contingency reserves related to the periods under
examination. Based upon this reassessment, Alltel recorded a $129.3 million reduction in its income tax contingency reserves. The corresponding effects of the reversal of these tax
contingencies resulted in a reduction in goodwill of $94.5 million and a reduction in income tax expense associated with continuing operations of $19.7 million. In addition, $15.1
million of the income tax contingency reserves reversed related to the financial services division that was sold to Fidelity National on April 1, 2003. Pursuant to the terms of the
sale agreement, Alltel retained, as of the date of sale, all income tax liabilities related to the sold operations and agreed to indemnify Fidelity National from any future tax liability
imposed on the financial services division for periods prior to the date of sale. The adjustment of the tax contingency reserves related to the disposed financial services division
has been reported as discontinued operations in the Company’s consolidated financial statements for the twelve months ended December 31, 2004. Discontinued operations for
the twelve months ended December 31, 2004 also included a tax benefit of $4.4 million attributable to a foreign tax credit carryback recognized as a result of the IRS audits.
(M) Eliminates the effects of discontinued operations. On August 1, 2005, Alltel completed its acquisition of Western Wireless. As a condition of receiving approval for the acquisition
from the Department of Justice and the Federal Communications Commission, Alltel agreed to divest certain wireless operations of Western Wireless in 16 markets in Arkansas,
Kansas and Nebraska. In December 2005, Alltel completed an exchange of wireless properties with United States Cellular Corporation that included a substantial portion of the
divestiture requirements related to the merger. During the third and fourth quarters of 2005, Alltel completed the sale of international operations in Georgia, Ghana and Ireland
acquired from Western Wireless. Alltel also has pending definitive agreements to sell the international operations in Austria, Bolivia and Haiti and is actively pursuing the
disposition of the remaining international operations acquired from Western Wireless. As a result, the acquired international operations and interests of Western Wireless and the
16 markets to be divested in Arkansas, Kansas and Nebraska have been classified as discontinued operations and assets held for sale in the accompanying consolidated financial
statements.
(N) Represents the cumulative effect of the change in accounting principle resulting from the Company's adoption of FASB Interpretation No. 47, “Accounting for Conditional Asset
Retirement Obligationsquot; (“FIN 47”). The Company evaluated the effects of FIN 47 on its operations and determined that, for certain buildings containing asbestos, Alltel is legally
obligated to remediate the asbestos if the Company were to abandon, sell or otherwise dispose of the buildings. In addition, for its acquired Kentucky and Nebraska wireline
operations not subject to SFAS No. 71, “Accounting for the Effects of Certain Types of Regulationquot;, the Company is legally obligated to properly dispose of its chemically-treated
telephone poles at the time they are removed from service. In accordance with federal and state regulations, depreciation expense for the Company’s wireline operations that
follow the accounting prescribed by SFAS No. 71 have historically included an additional provision for cost of removal, and accordingly, the adoption of FIN 47 had no impact to
these operations.
-more-
9. ALLTEL CORPORATION
SUPPLEMENTAL OPERATING INFORMATION-Page 9
(Dollars in thousands, except per customer amounts)
THREE MONTHS ENDED TWELVE MONTHS ENDED
Increase Increase
December 31, December 31, (Decrease) December 31, December 31, (Decrease)
2005 2004 Amount 2005 2004 Amount %
%
Wireless:
Controlled POPs 75,907,644 62,313,192 13,594,452 22
Customers 10,662,324 8,626,487 2,035,837 24
Penetration rate 14.0% 13.8% .2% 1
Average customers 10,507,806 8,481,561 2,026,245 24 9,550,829 8,295,939 1,254,890 15
Gross customer additions:
Internal 837,712 690,811 146,901 21 2,830,079 2,720,339 109,740 4
Acquired 90,356 92,345 (1,989) (2) 1,693,162 92,345 1,600,817 1,734
Total 928,068 783,156 144,912 19 4,523,241 2,812,684 1,710,557 61
Net customer additions:
Internal 147,258 139,415 7,843 6 342,675 510,717 (168,042) (33)
Acquired 90,356 92,345 (1,989) (2) 1,693,162 92,345 1,600,817 1,734
Total 237,614 231,760 5,854 3 2,035,837 603,062 1,432,775 238
Customer acquisition costs:
Cost of products sold $ 104,735 $ 80,557 $ 24,178 30 $ 320,769 $ 322,737 $ (1,968) (1)
Selling and marketing expenses 254,720 198,572 56,148 28 870,536 743,889 126,647 17
Less product sales 67,746 50,530 17,216 34 230,262 209,874 20,388 10
Total $ 291,709 $ 228,599 $ 63,110 28 $ 961,043 $ 856,752 $ 104,291 12
Cost to acquire a new customer (A) $348 $331 $17 5 $340 $315 $25 8
Cash costs:
Cost of services $ 543,352 $ 399,114 $ 144,238 36 $ 1,917,754 $ 1,543,576 $ 374,178 24
Cost of products sold 218,678 154,747 63,931 41 697,593 573,646 123,947 22
Selling, general, administrative and other 411,139 318,968 92,171 29 1,445,165 1,201,789 243,376 20
Less product sales 116,983 73,999 42,984 58 380,714 286,852 93,862 33
Total 1,056,186 798,830 257,356 32 3,679,798 3,032,159 647,639 21
Less customer acquisition costs 291,709 228,599 63,110 28 961,043 856,752 104,291 12
Total $ 764,477 $ 570,231 $ 194,246 34 $ 2,718,755 $ 2,175,407 $ 543,348 25
Cash cost per unit per month, excluding
customer acquisition costs (B) $24.25 $22.41 $1.84 8 $23.72 $21.85 $1.87 9
Revenues:
Service revenues $ 1,643,195 $ 1,252,773 $ 390,422 31 $ 5,895,143 $ 4,791,235 $ 1,103,908 23
Less wholesale revenues 171,595 94,748 76,847 81 545,109 372,446 172,663 46
Retail revenues $ 1,471,600 $ 1,158,025 $ 313,575 27 $ 5,350,034 $ 4,418,789 $ 931,245 21
Average revenue per customer per month (C) $52.13 $49.24 $2.89 6 $51.44 $48.13 $3.31 7
Retail revenue per customer per month (D) $46.68 $45.51 $1.17 3 $46.68 $44.39 $2.29 5
Retail minutes of use per customer per month (E) 626 534 92 17 597 494 103 21
Postpay churn 1.83% 1.68% .15% 9 1.77% 1.74% .03% 2
Total churn 2.20% 2.17% .03% 1 2.17% 2.23% (.06%) (3)
Service revenue operating margin (F) 18.3% 20.8% (2.5%) (12) 21.3% 21.3% - -
Capital expenditures (G) $ 271,440 $ 270,236 $ 1,204 -$ 978,970 $ 797,106 $ 181,864 23
(A) Cost to acquire a new customer is calculated by dividing the sum of the GAAP reported cost of products sold and sales and marketing expenses (included within Selling, general,
administrative and otherquot;) less product sales, as reported in the Consolidated Statements of Income, by the number of internal gross customer additions in the period. Customer
acquisition costs exclude amounts related to the Company's customer retention efforts.
(B) Cash cost per unit per month, excluding customer acquisition costs, is calculated by dividing the sum of the GAAP reported cost of services, cost of products sold, selling,
general, administrative and other expenses less product sales, as reported in the Consolidated Statements of Income, less customer acquisition costs, by the number of average
customers for the period.
(C) Average revenue per customer per month is calculated by dividing wireless service revenues by average customers for the period.
(D) Retail revenue per customer per month is calculated by dividing wireless retail revenues (service revenues less wholesale revenues) by average customers for the period.
(E) Retail minutes of use per customer per month represents the average monthly minutes that Alltel's customers use on both the Company's network and while roaming on other
carriers' networks.
(F) Service revenue operating margin is calculated by dividing wireless segment income by wireless service revenues.
(G) Includes capitalized software development costs.
-more-
10. ALLTEL CORPORATION
SUPPLEMENTAL OPERATING INFORMATION-Page 10
(Dollars in thousands, except per customer amounts)
THREE MONTHS ENDED TWELVE MONTHS ENDED
Increase Increase
December 31, December 31, (Decrease) December 31, December 31, (Decrease)
2005 2004 Amount 2005 2004 Amount
% %
Wireline:
Customers 2,885,673 3,009,388 (123,715) (4)
Average customers 2,901,310 3,024,635 (123,325) (4) 2,950,022 3,061,529 (111,507) (4)
Broadband customers 397,696 243,325 154,371 63
Net broadband additions 37,721 26,440 11,281 43 154,371 90,297 64,074 71
Average revenue per customer per month (H) $68.72 $66.98 $1.74 3 $67.21 $65.87 $1.34 2
Capital expenditures (G) $ 119,342 $ 100,730 $ 18,612 18 $ 355,938 $ 336,498 $ 19,440 6
Communications support services:
Long-distance customers 1,750,762 1,770,852 (20,090) (1)
Capital expenditures (G) $ 3,819 $ 5,738 $ (1,919) (33) $ 13,646 $ 15,150 $ (1,504) (10)
Consolidated:
Equity free cash flow (I) $ 309,498 $ 225,693 $ 83,805 37 $ 1,304,052 $ 1,180,072 $ 123,980 11
Capital expenditures (G) $ 395,194 $ 376,885 $ 18,309 5 $ 1,349,656 $ 1,157,729 $ 191,927 17
Total assets $ 24,013,481 $ 16,603,736 $ 7,409,745 45
(G) Includes capitalized software development costs.
(H) Average revenue per customer per month is calculated by dividing total wireline revenues by average customers for the period.
(I) Equity free cash flow is calculated as the sum of net income from current businesses plus depreciation and amortization less capital expenditures which includes capitalized
software development costs as indicated in Note G.
-more-
11. ALLTEL CORPORATION
CONSOLIDATED BALANCE SHEETS UNDER GAAP-Page 11
(In thousands)
ASSETS LIABILITIES AND SHAREHOLDERS' EQUITY
December 31, December 31, December 31, December 31,
2005 2004 2005 2004
CURRENT ASSETS: CURRENT LIABILITIES:
Cash and short-term investments $ 989,153 $ 484,934 Current maturities of long-term debt $ 205,117 $ 224,958
Accounts receivable (less allowance for Accounts payable 649,293 448,161
doubtful accounts of $84,750 and Advance payments and customer deposits 240,499 219,338
$53,606, respectively) 1,077,207 912,665 Accrued taxes 118,895 158,197
Inventories 232,634 156,785 Accrued dividends 147,841 105,922
Prepaid expenses and other 115,179 62,383 Accrued interest 102,512 120,259
Assets held for sale 2,018,701 - Current deferred income taxes 501,672 -
Other current liabilities 255,425 183,523
Total current assets 4,432,874 1,616,767 385,528 -
Liabilities related to assets held for sale
Investments 358,412 804,861 Total current liabilities 2,606,782 1,460,358
Goodwill 8,610,170 4,875,718
Other intangibles 2,179,107 1,306,140
Long-term debt 5,782,890 5,352,422
PROPERTY, PLANT AND EQUIPMENT: Deferred income taxes 1,659,410 1,715,119
Land 298,593 278,084 Other liabilities 948,962 947,172
Buildings and improvements 1,211,359 1,134,824
Wireline 6,942,039 6,735,748
Wireless 6,852,565 5,763,965
Information processing 1,187,192 1,048,446 SHAREHOLDERS' EQUITY:
Other 530,333 489,936 Preferred stock 278 307
Under construction 475,453 385,283 Common stock 383,613 302,268
Additional paid-in capital 5,339,321 197,902
Total property, plant and equipment 17,497,534 15,836,286 Unrealized holding gain on investments 22,297 153,926
Less accumulated depreciation 9,433,951 8,288,195 Foreign currency translation adjustment (2,841) 482
Retained earnings 7,272,769 6,473,780
Net property, plant and equipment 8,063,583 7,548,091
Total shareholders' equity 13,015,437 7,128,665
Other assets 369,335 452,159
TOTAL LIABILITIES AND
TOTAL ASSETS $ 24,013,481 $ 16,603,736 SHAREHOLDERS' EQUITY $ 24,013,481 $ 16,603,736
-more-
12. ALLTEL CORPORATION
CONSOLIDATED STATEMENTS OF CASH FLOWS UNDER GAAP-Page 12
(In thousands)
THREE MONTHS ENDED TWELVE MONTHS ENDED
December 31, December 31, December 31, December 31,
2005 2004 2005 2004
Net Cash Provided from Operations:
Net income $ 255,149 $ 270,645 $ 1,331,379 $ 1,046,235
Adjustments to reconcile net income to net cash provided from
operations:
Income from discontinued operations (4,270) - (30,292) (19,538)
Cumulative effect of accounting change 7,441 - 7,441 -
Depreciation and amortization 404,079 332,520 1,482,605 1,299,691
Provision for doubtful accounts 63,068 47,601 215,087 184,871
Non-cash portion of gain on exchange or disposal of assets and other - - (232,742) -
Non-cash portion of restructuring and other charges 4,982 - 14,982 25,569
Change in deferred income taxes (211,302) 74,794 (193,235) 263,390
Reversal of income tax contingency reserves - - - (19,656)
Other, net (4,097) (5,861) 7,960 (14,336)
Changes in operating assets and liabilities, net of the effects of
acquisitions and dispositions:
Accounts receivable (21,777) (41,856) (227,185) (206,132)
Inventories (61,193) (44,750) (44,968) (33,842)
Accounts payable 149,074 65,854 145,594 (27,174)
Other current liabilities 189,679 6,490 195,889 70,602
Other, net 59,312 (82,646) 59,740 (102,831)
Net cash provided from operations 830,145 622,791 2,732,255 2,466,849
Cash Flows from Investing Activities:
Additions to property, plant and equipment (386,895) (368,122) (1,302,440) (1,125,402)
Additions to capitalized software development costs (8,299) (8,763) (47,216) (32,327)
Additions to investments - (423) (890) (3,228)
Purchases of property, net of cash acquired (1,535) (185,136) (1,137,584) (185,136)
Proceeds from the sale of assets 48,243 - 84,405 -
Proceeds from the sale of investments - - 353,881 -
Proceeds from the return on investments 5,982 21,497 36,872 88,612
Other, net 5,795 (313) 13,746 (907)
Net cash used in investing activities (336,709) (541,260) (1,999,226) (1,258,388)
Cash Flows from Financing Activities:
Dividends on preferred and common stock (145,303) (122,223) (490,472) (467,570)
Reductions in long-term debt (21,139) (22,246) (2,677,779) (277,240)
Distributions to minority investors (20,834) (17,240) (65,642) (66,917)
Long-term debt issued 72,300 - 1,000,000 -
Repurchases of common stock - (88,419) - (595,350)
Common stock issued 20,714 5,146 1,463,504 25,873
Net cash used in financing activities (94,262) (244,982) (770,389) (1,381,204)
Net cash provided from discontinued operations 544,612 - 580,801 -
Effect of exchange rate changes on cash and short-term investments (24,061) - (39,222) (87)
Increase (decrease) in cash and short-term investments 919,725 (163,451) 504,219 (172,830)
Cash and Short-term Investments:
Beginning of the period 69,428 648,385 484,934 657,764
End of the period $ 989,153 $ 484,934 $ 989,153 $ 484,934
-more-
13. ALLTEL CORPORATION
RECONCILIATIONS OF RESULTS OF OPERATIONS UNDER GAAP TO RESULTS OF OPERATIONS FROM CURRENT BUSINESSES (NON-GAAP)-Page 13
(In thousands)
THREE MONTHS ENDED TWELVE MONTHS ENDED
December 31, December 31, December 31, December 31,
2005 2004 2005 2004
Net cash provided from operations $ 830,145 $ 622,791 $ 2,732,255 $ 2,466,849
Adjustments to reconcile to net income under GAAP:
Income from discontinued operations 4,270 - 30,292 19,538
Cumulative effect of accounting change (7,441) - (7,441) -
Depreciation and amortization expense (404,079) (332,520) (1,482,605) (1,299,691)
Provision for doubtful accounts (63,068) (47,601) (215,087) (184,871)
Non-cash portion of gain on exchange or disposal of assets and other - - 232,742 -
Non-cash portion of restructuring and other charges (4,982) - (14,982) (25,569)
Change in deferred income taxes 211,302 (74,794) 193,235 (263,390)
Reversal of income tax contingency reserves - - - 19,656
Other non-cash changes, net 4,097 5,861 (7,960) 14,336
Changes in operating assets and liabilities, net of the
effects of acquisitions and dispositions (315,095) 96,908 (129,070) 299,377
Net income under GAAP 255,149 270,645 1,331,379 1,046,235
Adjustments to reconcile to net income from current businesses:
Restructuring and other charges, net of tax 36,484 (587) 48,053 31,069
Gain on exchange or disposal of assets and other, net of tax - - (136,720) -
Special dividend received on Fidelity National common stock,
net of tax - - (69,812) -
Change in accounting for operating leases, net of tax - - 12,092 -
Hurricane-related costs, net of insurance recoveries and tax 5,809 - 8,962 -
Reversal of income tax contingency reserves - - - (19,656)
Cumulative effect of accounting change 7,441 - 7,441 -
Income from discontinued operations (4,270) - (30,292) (19,538)
Net income from current businesses 300,613 270,058 1,171,103 1,038,110
Adjustments to reconcile to equity free cash flow from current businesses:
Depreciation and amortization expense 404,079 332,520 1,482,605 1,299,691
Capital expenditures (395,194) (376,885) (1,349,656) (1,157,729)
Equity free cash flow from current businesses $ 309,498 $ 225,693 $ 1,304,052 $ 1,180,072
-end-