1. ALLTEL CORPORATION
CONSOLIDATED HIGHLIGHTS AND OTHER FINANCIAL INFORMATION
(In thousands, except per share amounts)
THREE MONTHS ENDED NINE MONTHS ENDED
Increase Increase
September 30, September 30, (Decrease) September 30, September 30, (Decrease)
2006 2005 Amount % 2006 2005 Amount %
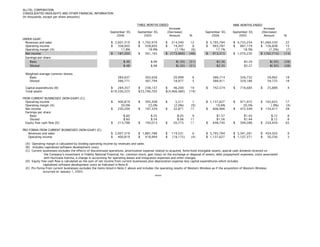
UNDER GAAP:
Revenues and sales $ 2,007,319 $ 1,792,979 $ 214,340 12 $ 5,795,784 $ 4,735,254 $ 1,060,530 22
Operating income $ 358,002 $ 338,695 $ 19,307 6 $ 993,787 $ 867,179 $ 126,608 15
Operating margin (A) 17.8% 18.9% (1.1%) (6) 17.1% 18.3% (1.2%) (7)
Net income $ 187,205 $ 361,165 $ (173,960) (48) $ 913,515 $ 1,076,230 $ (162,715) (15)
Earnings per share:
Basic $.49 $.99 $(.50) (51) $2.36 $3.29 $(.93) (28)
Diluted $.48 $.98 $(.50) (51) $2.35 $3.27 $(.92) (28)
Weighted average common shares:
Basic 384,637 363,638 20,999 6 386,714 326,752 59,962 18
Diluted 386,771 367,794 18,977 5 388,911 329,186 59,725 18
Capital expenditures (B) $ 284,357 $ 238,157 $ 46,200 19 $ 742,574 $ 716,685 $ 25,889 4
Total assets $ 19,330,223 $ 23,796,703 $ (4,466,480) (19)
FROM CURRENT BUSINESSES (NON-GAAP) (C):
Operating income $ 400,819 $ 395,308 $ 5,511 1 $ 1,137,627 $ 971,972 $ 165,655 17
Operating margin (A) 20.0% 22.0% (2.0%) (9) 19.6% 20.5% (.9%) (4)
Net income $ 230,200 $ 197,329 $ 32,871 17 $ 606,966 $ 472,549 $ 134,417 28
Earnings per share:
Basic $.60 $.55 $.05 9 $1.57 $1.45 $.12 8
Diluted $.60 $.54 $.06 11 $1.56 $1.44 $.12 8
Equity free cash flow (D) $ 213,788 $ 193,013 $ 20,775 11 $ 648,745 $ 394,286 $ 254,459 65
PRO FORMA FROM CURRENT BUSINESSES (NON-GAAP) (E):
Revenues and sales $ 2,007,319 $ 1,887,788 $ 119,531 6 $ 5,795,784 $ 5,341,281 $ 454,503 9
Operating income $ 400,819 $ 418,994 $ (18,175) (4) $ 1,137,627 $ 1,107,371 $ 30,256 3
(A) Operating margin is calculated by dividing operating income by revenues and sales.
(B) Includes capitalized software development costs.
(C) Current businesses excludes the effects of discontinued operations, amortization expense related to acquired, finite-lived intangible assets, special cash dividend received on
the Company's investment in Fidelity National Financial, Inc. common stock, gain (loss) on the exchange or disposal of assets, debt prepayment expenses, costs associated
with Hurricane Katrina, a change in accounting for operating leases and integration expenses and other charges.
(D) Equity free cash flow is calculated as the sum of net income from current businesses plus depreciation expense less capital expenditures which includes
capitalized software development costs as indicated in Note B.
(E) Pro forma from current businesses excludes the items listed in Note C above and includes the operating results of Western Wireless as if the acquisition of Western Wireless
occurred on January 1, 2005.
-more-
2. ALLTEL CORPORATION
CONSOLIDATED STATEMENTS OF INCOME UNDER GAAP-Page 2
(In thousands, except per share amounts)
THREE MONTHS ENDED NINE MONTHS ENDED
September 30, September 30, September 30, September 30,
2006 2005 2006 2005
Revenues and sales:
Service revenues $ 1,795,443 $ 1,614,090 $ 5,178,719 $ 4,273,990
Product sales 211,876 178,889 617,065 461,264
Total revenues and sales 2,007,319 1,792,979 5,795,784 4,735,254
Costs and expenses:
Cost of services 610,102 524,388 1,726,863 1,405,448
Cost of products sold 293,754 250,261 849,802 660,148
Selling, general, administrative and other 438,325 399,095 1,298,530 1,088,887
Depreciation and amortization 307,136 266,214 916,012 699,266
Integration expenses and other charges - 14,326 10,790 14,326
Total costs and expenses 1,649,317 1,454,284 4,801,997 3,868,075
Operating income 358,002 338,695 993,787 867,179
Equity earnings in unconsolidated partnerships 17,281 10,434 45,612 36,391
Minority interest in consolidated partnerships (11,729) (20,573) (37,106) (57,838)
Other income, net 37,308 15,203 69,115 144,084
Interest expense (63,822) (78,993) (234,976) (232,866)
Gain (loss) on exchange or disposal of assets and other (50,501) 30,557 126,138 218,830
Income from continuing operations before income taxes 286,539 295,323 962,570 975,780
Income taxes 121,268 111,109 374,686 358,065
Income from continuing operations 165,271 184,214 587,884 617,715
Income from discontinued operations 21,934 176,951 325,631 458,515
Net income 187,205 361,165 913,515 1,076,230
Preferred dividends 21 24 63 72
Net income applicable to common shares $ 187,184 $ 361,141 $ 913,452 $ 1,076,158
Basic earnings per share:
Income from continuing operations $.43 $.51 $1.52 $1.89
Income from discontinued operations .06 .48 .84 1.40
Net income $.49 $.99 $2.36 $3.29
Diluted earnings per share:
Income from continuing operations $.43 $.50 $1.51 $1.88
Income from discontinued operations .05 .48 .84 1.39
Net income $.48 $.98 $2.35 $3.27
-more-
3. ALLTEL CORPORATION
RECONCILIATION OF RESULTS OF OPERATIONS UNDER GAAP TO RESULTS OF OPERATIONS FROM CURRENT BUSINESSES (NON-GAAP)-Page 3
for the three months ended September 30, 2006 and 2005
(In thousands, except per share amounts)
THREE MONTHS ENDED THREE MONTHS ENDED
September 30, 2006 September 30, 2005
Results of Items Results of Results of Items Results of
Operations Excluded from Operations Operations Excluded from Operations
Under Current from Current Under Current from Current
GAAP Businesses Businesses GAAP Businesses Businesses
Revenues and sales:
Service revenues $ 1,795,443 $ - $ 1,795,443 $ 1,614,090 $ - $ 1,614,090
Product sales 211,876 - 211,876 178,889 - 178,889
Total revenues and sales 2,007,319 - 2,007,319 1,792,979 - 1,792,979
Costs and expenses:
Cost of services 610,102 - 610,102 524,388 (8,016) (G) 516,372
Cost of products sold 293,754 - 293,754 250,261 - 250,261
Selling, general, administrative and other 438,325 (3,626) (A) 434,699 399,095 (1,898) (G) 397,197
Depreciation and amortization 307,136 (39,191) (B) 267,945 266,214 (32,373) 233,841
(B)
Integration expenses and other charges - - - 14,326 (14,326) -
(H)
Total costs and expenses 1,649,317 (42,817) 1,606,500 1,454,284 (56,613) 1,397,671
Operating income 358,002 42,817 400,819 338,695 56,613 395,308
Equity earnings in unconsolidated partnerships 17,281 - 17,281 10,434 - 10,434
Minority interest in consolidated partnerships (11,729) - (11,729) (20,573) - (20,573)
Other income, net 37,308 - 37,308 15,203 (5,000) (G) 10,203
Interest expense (63,822) - (63,822) (78,993) - (78,993)
Gain (loss) on exchange or disposal of assets and other (50,501) 50,501 (C) - 30,557 (30,557) (I) -
Income from continuing operations before income taxes 286,539 93,318 379,857 295,323 21,056 316,379
Income taxes 121,268 28,389 (M) 149,657 111,109 7,941 (M) 119,050
Income from continuing operations 165,271 64,929 230,200 184,214 13,115 197,329
Income from discontinued operations 21,934 (21,934) (N) - 176,951 (176,951) (N) -
Net income 187,205 42,995 230,200 361,165 (163,836) 197,329
Preferred dividends 21 - 21 24 - 24
Net income applicable to common shares $ 187,184 $ 42,995 $ 230,179 $ 361,141 $ (163,836) $ 197,305
Basic earnings per share:
Income from continuing operations $ .43 $ .17 $.60 $.51 $ .04 $.55
Income from discontinued operations .06 (.06) - .48 (.48) -
Net income $.49 $.11 $.60 $.99 $(.44) $.55
Diluted earnings per share:
Income from continuing operations $ .43 $ .17 $.60 $.50 $ .04 $.54
Income from discontinued operations .05 (.05) - .48 (.48) -
Net income $.48 $.12 $.60 $.98 $(.44) $.54
See notes on pages 6 and 7 for a description of the line items marked (A) - (N).
-more-
4. ALLTEL CORPORATION
RECONCILIATION OF RESULTS OF OPERATIONS UNDER GAAP TO RESULTS OF OPERATIONS FROM CURRENT BUSINESSES (NON-GAAP)-Page 4
for the nine months ended September 30, 2006 and 2005
(In thousands, except per share amounts)
NINE MONTHS ENDED NINE MONTHS ENDED
September 30, 2006 September 30, 2005
Results of Items Results of Results of Items Results of
Operations Excluded from Operations Operations Excluded from Operations
Under Current from Current Under Current from Current
GAAP Businesses Businesses GAAP Businesses Businesses
Revenues and sales:
Service revenues $ 5,178,719 $ - $ 5,178,719 $ 4,273,990 $ - $ 4,273,990
Product sales 617,065 - 617,065 461,264 - 461,264
Total revenues and sales 5,795,784 - 5,795,784 4,735,254 - 4,735,254
Costs and expenses:
Cost of services 1,726,863 2,235 (D) 1,729,098 1,405,448 (27,725) (G)(L) 1,377,723
Cost of products sold 849,802 - 849,802 660,148 - 660,148
Selling, general, administrative and other 1,298,530 (3,626) (A) 1,294,904 1,088,887 (1,898) (G) 1,086,989
Depreciation and amortization 916,012 (131,659) 784,353 699,266 (60,844) 638,422
(B) (B)
Integration expenses and other charges 10,790 (10,790) - 14,326 (14,326) -
(F) (H)
Total costs and expenses 4,801,997 (143,840) 4,658,157 3,868,075 (104,793) 3,763,282
Operating income 993,787 143,840 1,137,627 867,179 104,793 971,972
Equity earnings in unconsolidated partnerships 45,612 - 45,612 36,391 - 36,391
Minority interest in consolidated partnerships (37,106) - (37,106) (57,838) - (57,838)
Other income, net 69,115 - 69,115 144,084 (116,036) (G)(K) 28,048
Interest expense (234,976) - (234,976) (232,866) - (232,866)
Gain (loss) on exchange or disposal of assets and other 126,138 (126,138) (C)(E) - 218,830 (218,830) (I)(J) -
Income from continuing operations before income taxes 962,570 17,702 980,272 975,780 (230,073) 745,707
Income taxes 374,686 (1,380) (M) 373,306 358,065 (84,907) (M) 273,158
Income from continuing operations 587,884 19,082 606,966 617,715 (145,166) 472,549
Income from discontinued operations 325,631 (325,631) (N) - 458,515 (458,515) (N) -
Net income 913,515 (306,549) 606,966 1,076,230 (603,681) 472,549
Preferred dividends 63 - 63 72 - 72
Net income applicable to common shares $ 913,452 $ (306,549) $ 606,903 $ 1,076,158 $ (603,681) $ 472,477
Basic earnings per share:
Income from continuing operations $1.52 $ .05 $1.57 $1.89 $ (.44) $1.45
Income from discontinued operations .84 (.84) - 1.40 (1.40) -
Net income $2.36 $(.79) $1.57 $3.29 $(1.84) $1.45
Diluted earnings per share:
Income from continuing operations $1.51 $ .05 $1.56 $1.88 $ (.44) $1.44
Income from discontinued operations .84 (.84) - 1.39 (1.39) -
Net income $2.35 $(.79) $1.56 $3.27 $(1.83) $1.44
See notes on pages 6 and 7 for a description of the line items marked (A) - (N).
-more-
5. ALLTEL CORPORATION
SUPPLEMENTAL UNAUDITED PRO FORMA SELECTED FINANCIAL INFORMATION FROM CURRENT BUSINESSES-Page 5
(Dollars in thousands)
For the three months ended September 30, 2005
Operating
Results from
Current Western
Businesses Wireless Pro Forma
Revenues and sales:
Service revenues $ 1,614,090 $ 89,630 $ 1,703,720
Product sales 178,889 5,179 184,068
Total revenues and sales 1,792,979 94,809 1,887,788
Costs and expenses:
Cost of services 516,372 28,055 544,427
Cost of products sold 250,261 9,635 259,896
Selling, general, administrative and other 397,197 17,353 414,550
Depreciation and amortization 233,841 16,080 249,921
Total costs and expenses 1,397,671 71,123 1,468,794
Operating income $ 395,308 $ 23,686 $ 418,994
For the nine months ended September 30, 2005
Operating
Results from
Current Western
Businesses Wireless Pro Forma
Revenues and sales:
Service revenues $ 4,273,990 $ 570,214 $ 4,844,204
Product sales 461,264 35,813 497,077
Total revenues and sales 4,735,254 606,027 5,341,281
Costs and expenses:
Cost of services 1,377,723 167,288 1,545,011
Cost of products sold 660,148 63,021 723,169
Selling, general, administrative and other 1,086,989 132,510 1,219,499
Depreciation and amortization 638,422 107,809 746,231
Total costs and expenses 3,763,282 470,628 4,233,910
Operating income $ 971,972 $ 135,399 $ 1,107,371
Operating results from current businesses have been reconciled to operating results under GAAP on pages 3 and 4 of this earnings release.
-more-
6. ALLTEL CORPORATION
NOTES TO RECONCILIATIONS OF RESULTS OF OPERATIONS UNDER GAAP TO RESULTS OF OPERATIONS FROM CURRENT BUSINESSES (NON-GAAP)-Page 6
As disclosed in the ALLTEL Corporation (quot;Alltelquot; or the quot;Companyquot;) Form 8-K filed on October 27, 2006, Alltel has presented in this earnings release results of operations from current businesses which
exclude the effects of discontinued operations, amortization expense related to acquired, finite-lived intangible assets, a special cash dividend received on the Company's investment in Fidelity National
Financial, Inc. (quot;Fidelity Nationalquot;) common stock, gain (loss) on exchange or disposal of assets, termination fees associated with the early retirement of long-term debt, costs associated with Hurricane Katrina,
a change in accounting for certain operating leases and integration expenses and other charges. Alltel’s purpose for excluding items from the current business measures is to focus on Alltel’s true earnings
capacity associated with providing wireless communications services. Management believes the items excluded from the current business measures are related to strategic activities or other events, specific to
the time and opportunity available, and, accordingly, should be excluded when evaluating the trends of the Company’s operations.
Alltel believes that presenting the current business measures assists investors in assessing the true business performance of the Company by clarifying for investors the effects that certain items such as asset
sales, integration expenses and other business consolidation costs arising from past acquisition and integration activities had on the Company’s GAAP consolidated results of operations. The Company uses
results from current businesses as management’s primary measure of the performance of its business operations. Alltel's management, including the chief operating decision-maker, uses the current business
measures consistently for all purposes, including internal reporting purposes, the evaluation of business objectives, opportunities and performance and the determination of management compensation.
(A) In connection with the spin-off and merger of the Company's wireline telecommunications business, holders of Alltel restricted shares received approximately 1.034 shares of Windstream Corporation
(quot;Windstreamquot;) restricted stock for each share of restricted Alltel common stock held at the time of the distribution. The Windstream restricted shares received by Alltel employees became fully vested on
August 3, 2006. Compensation expense resulting from the accelerated vesting of the Windstream restricted stock awards amounted to $3.6 million. (See Notes C and N below for additional information
regarding the spin-off and merger of Alltel’s wireline telecommunications business).
(B) Eliminates the effects of amortization expense related to acquired, finite-lived intangible assets.
(C) On July 17, 2006, in order to effect the spin-off of its wireline telecommunications business to its stockholders, Alltel contributed all of the assets of its wireline telecommunications business to ALLTEL Holding
Corp. (quot;Alltel Holdingquot; or quot;Spincoquot;), a wholly owned subsidiary of the Company, in exchange for: (i) the issuance to Alltel of Spinco common stock that was distributed on a pro rata basis to Alltel’s
stockholders as a tax-free stock dividend, (ii) the payment of a special dividend to Alltel in the amount of $2.3 billion and (iii) the distribution by Spinco to Alltel of $1.7 billion of Spinco debt securities. Also on
July 17, 2006, Alltel completed a debt exchange in which Alltel transferred to two investment banks the Spinco debt securities received in the spin-off transaction in exchange for certain Alltel debt securities,
consisting of $988.5 million of outstanding commercial paper borrowings and $685.1 million of 4.656 percent notes due May 17, 2007. In completing the debt exchange, Alltel incurred a pretax loss of $27.5
million.
On August 25, 2006, Alltel repurchased prior to maturity $1.0 billion of long-term debt, consisting of $664.3 million of 4.656 percent equity unit notes due 2007, $61.0 million of 6.65 percent unsecured notes
due 2008, $147.0 million of 7.60 percent unsecured notes due 2009 and $127.7 million of 8.00 percent notes due 2010 pursuant to cash tender offers announced by the Company on July 31, 2006. Concurrent
with the debt repurchase, Alltel also terminated the related pay variable/receive fixed, interest rate swap agreement that had been designated as a fair value hedge against the 6.65 percent unsecured notes due
2008. In connection with the early termination of the debt and interest rate swap agreement, Alltel incurred net pretax termination fees of $23.0 million.
(D) The Company recorded a $2.2 million reduction in its allowance for doubtful accounts to reflect lower than expected write-offs from service interruptions and customer displacement attributable to the effects of
Hurricane Katrina. The additional bad debt expense was originally recorded in the third quarter of 2005. (See Note G below.)
(E) During 2005, federal legislation was enacted which included provisions to dissolve and liquidate the assets of the Rural Telephone Bank (quot;RTBquot;). In connection with the dissolution and liquidation, during April
2006, the RTB redeemed all outstanding shares of its Class C stock. As a result, Alltel received liquidating cash distributions of $198.7 million in exchange for its $22.1 million investment in RTB Class C stock.
(F) The Company incurred $10.8 million of integration expenses related to its acquisition completed on August 1, 2005 of Western Wireless Corporation (quot;Western Wirelessquot;). These expenses consisted of $8.3
million of rebranding costs and $2.5 million of system conversion costs and other integration costs.
(G) Alltel incurred $9.9 million of incremental costs related to Hurricane Katrina consisting of increased long-distance and roaming expenses due to providing these services to affected customers at no charge,
system maintenance costs to restore network facilities and additional losses from bad debts. These incremental costs also included Company donations to support the hurricane relief efforts. These incremental
expenses were partially offset by $5.0 million of insurance proceeds received to date by Alltel.
-more-
7. ALLTEL CORPORATION
NOTES TO RECONCILIATIONS OF RESULTS OF OPERATIONS UNDER GAAP TO RESULTS OF OPERATIONS FROM CURRENT BUSINESSES (NON-GAAP)-Page 7
(H) The Company incurred $2.4 million of integration expenses related to its acquisition of Western Wireless. These expenses primarily consisted of system conversion and relocation costs. In addition, the Company
incurred $11.9 million of integration expenses related to the exchange of certain wireless assets with Cingular Wireless LLC (quot;Cingularquot;) completed during the second and third quarters of 2005. These expenses
consisted of handset subsidies incurred to migrate the acquired customer base to CDMA handsets.
(I) Primarily due to certain minority partners' right-of-first-refusal, three of the wireless partnership interests to be exchanged between Alltel and Cingular, as discussed in Note J below, were not completed until July 29,
2005. As a result of completing the exchange transaction, Alltel recorded an additional pretax gain of $30.5 million.
(J) On April 15, 2005, Alltel and Cingular completed the exchange of certain wireless assets. In connection with this transaction, Alltel recorded a pretax gain of $127.5 million. On April 6, 2005, Alltel recorded a
pretax gain of $75.8 million from the sale of all of its shares of Fidelity National common stock. In addition, on April 8, 2005, Alltel retired all of its issued and outstanding 7.50 percent senior notes due March 1,
2006, representing an aggregate principal amount of $450.0 million. Concurrent with the debt retirement, Alltel also terminated the related pay variable/receive fixed, interest rate swap agreement that had been
designated as a fair value hedge against the $450.0 million senior notes. In connection with the early termination of the debt and interest rate swap agreement, Alltel incurred net pretax termination fees of
approximately $15.0 million.
(K) On March 9, 2005, Fidelity National declared a special $10 per share cash dividend to Fidelity National stockholders. The special cash dividend was received by Alltel on March 28, 2005.
(L) Effective January 1, 2005, Alltel changed its accounting for operating leases with scheduled rent increases. Certain of the Company's operating lease agreements for cell sites and for office and retail locations
include scheduled rent escalations during the initial lease term and/or during succeeding optional renewal periods. Previously, the Company had not recognized the scheduled increases in rent expense on a straight-
line basis in accordance with the provisions of Statement of Financial Accounting Standards (quot;SFASquot;) No. 13, quot;Accounting for Leasesquot; and Financial Accounting Standards Board (quot;FASBquot;) Technical Bulletin No.
85-3, quot;Accounting for Operating Leases with Scheduled Rent Increasesquot;. The effects of this change, which are included in corporate expenses, were not material to the Company's previously reported consolidated
results of operations, financial position or cash flows.
(M) Tax-related effect of the items discussed in Notes A - L above.
(N) Eliminates the effects of discontinued operations. On July 17, 2006, Alltel completed the spin-off of its wireline telecommunications business to its stockholders and the merger of that wireline business with Valor
Communications Group, Inc. (quot;Valorquot;). The spin-off included the majority of Alltel’s communications support services, including directory publishing, information technology outsourcing services, retail long-
distance and the wireline sales portion of communications products. The new wireline company formed in the merger of Alltel’s wireline operations and Valor is named Windstream. As a result, Alltel’s historical
results of operations have been adjusted to reflect the wireline business as discontinued operations in the accompanying unaudited consolidated financial statements.
As a condition of receiving approval from the Department of Justice (quot;DOJquot;) and the Federal Communications Commission (quot;FCCquot;) for its acquisition of Midwest Wireless Holdings of Mankato, Minnesota
(quot;Midwest Wirelessquot;), on September 7, 2006, Alltel agreed to divest certain wireless operations in four rural markets in Minnesota. Accordingly, the four markets to be divested in Minnesota have been classified as
discontinued operations in the accompanying unaudited consolidated financial statements.
In addition, as a condition of receiving approval for the Western Wireless acquisition from the DOJ and the FCC, Alltel agreed to divest certain wireless operations of Western Wireless in 16 markets in Arkansas,
Kansas and Nebraska. In December 2005, Alltel completed an exchange of wireless properties with United States Cellular Corporation that included a substantial portion of the divestiture requirements related to the
merger. In the first quarter of 2006, Alltel completed the required divestitures with the sale of the remaining property in Arkansas. During 2005, Alltel completed the sales of international operations in Georgia,
Ghana and Ireland acquired from Western Wireless. During the second quarter of 2006, Alltel completed the sales of the remaining international operations acquired from Western Wireless in Austria, Bolivia, Côte
d’Ivoire, Haiti, and Slovenia. As a result, the acquired international operations and interests of Western Wireless and the 16 markets to be divested in Arkansas, Kansas and Nebraska have been classified as
discontinued operations in the accompanying unaudited consolidated financial statements.
-more-
8. ALLTEL CORPORATION
SUPPLEMENTAL OPERATING INFORMATION-Page 8
(Dollars in thousands, except per customer amounts)
THREE MONTHS ENDED NINE MONTHS ENDED
Increase Increase
September 30, September 30, (Decrease) September 30, September 30, (Decrease)
2006 2005 Amount % 2006 2005 Amount %
Controlled POPs 76,974,746 75,410,320 1,564,426 2
Customers 11,162,300 10,424,710 737,590 7
Penetration rate 14.5% 13.8% .7% 5
Average customers 11,133,165 9,956,726 1,176,439 12 10,933,578 9,229,636 1,703,942 18
Gross customer additions:
Internal 829,304 729,618 99,686 14 2,405,347 1,992,367 412,980 21
Acquired (23,904) 1,336,315 (1,360,219) (102) 88,191 1,602,806 (1,514,615) (94)
Total 805,400 2,065,933 (1,260,533) (61) 2,493,538 3,595,173 (1,101,635) (31)
Net customer additions:
Internal 101,059 20,887 80,172 384 411,785 195,417 216,368 111
Acquired (23,904) 1,336,315 (1,360,219) (102) 88,191 1,602,806 (1,514,615) (94)
Total 77,155 1,357,202 (1,280,047) (94) 499,976 1,798,223 (1,298,247) (72)
Customer acquisition costs:
Cost of products sold $ 173,544 $ 154,251 $ 19,293 13 $ 503,410 $ 397,268 $ 106,142 27
Selling and marketing expenses 256,005 232,060 23,945 10 774,093 616,411 157,682 26
Less product sales 150,186 138,624 11,562 8 441,792 360,049 81,743 23
Total $ 279,363 $ 247,687 $ 31,676 13 $ 835,711 $ 653,630 $ 182,081 28
Cost to acquire a new customer (A) $337 $339 $(2) (1) $347 $328 $19 6
Cash costs from current businesses:
Cost of services $ 610,102 $ 516,372 $ 93,730 18 $ 1,729,098 $ 1,377,723 $ 351,375 26
Cost of products sold 293,754 250,261 43,493 17 849,802 660,148 189,654 29
Selling, general, administrative and other 434,699 397,197 37,502 9 1,294,904 1,086,989 207,915 19
Less product sales 211,876 178,889 32,987 18 617,065 461,264 155,801 34
Total 1,126,679 984,941 141,738 14 3,256,739 2,663,596 593,143 22
Less customer acquisition costs 279,363 247,687 31,676 13 835,711 653,630 182,081 28
Total $ 847,316 $ 737,254 $ 110,062 15 $ 2,421,028 $ 2,009,966 $ 411,062 20
Cash costs from current businesses per unit per month,
excluding customer acquisition costs (B) $25.37 $24.68 $.69 3 $24.60 $24.20 $.40 2
Revenues:
Service revenues $ 1,795,443 $ 1,614,090 $ 181,353 11 $ 5,178,719 $ 4,273,990 $ 904,729 21
Less wholesale roaming revenues 171,459 170,221 1,238 1 486,052 373,514 112,538 30
Less wholesale transport revenues 32,245 7,609 24,636 324 50,439 22,043 28,396 129
Retail revenues $ 1,591,739 $ 1,436,260 $ 155,479 11 $ 4,642,228 $ 3,878,433 $ 763,795 20
Average revenue per customer per month (C) $53.76 $54.04 $(.28) (1) $52.63 $51.45 $1.18 2
Retail revenue per customer per month (D) $47.66 $48.08 $(.42) (1) $47.18 $46.69 $.49 1
Retail minutes of use per customer per month (E) 645 614 31 5 629 586 43 7
Postpay churn 1.67% 1.92% (.25%) (13) 1.60% 1.75% (.15%) (9)
Total churn 2.18% 2.37% (.19%) (8) 2.03% 2.17% (.14%) (6)
Service revenue operating margin (F)
From current businesses 22.3% 24.5% (2.2%) (9) 22.0% 22.7% (0.7%) (3)
Under GAAP 19.9% 21.0% (1.1%) (5) 19.2% 20.3% (1.1%) (5)
(A) Cost to acquire a new customer is calculated by dividing the sum of the GAAP reported cost of products sold and sales and marketing expenses (included within quot;Selling, general,
administrative and otherquot;) less product sales, as reported in the Consolidated Statements of Income, by the number of internal gross customer additions in the period. Customer
acquisition costs exclude amounts related to the Company's customer retention efforts.
(B) Cash costs from current businesses per unit per month, excluding customer acquisition costs, is calculated by dividing the sum of the current businesses reported cost of services, cost of products sold, selling, general,
administrative and other expenses less product sales, as reported in the Consolidated Statements of Income, less customer acquisition costs, by the number of average customers for the period.
Measured on a GAAP basis, cash costs per unit per month, excluding customer acquisition costs, were $25.48 and $24.62 for the three and nine months ended September 30, 2006, respectively,
and $25.01 and $24.55 for the same periods of 2005, respectively.
(C) Average revenue per customer per month is calculated by dividing service revenues by average customers for the period.
(D) Retail revenue per customer per month is calculated by dividing retail revenues (service revenues less wholesale revenues) by average customers for the period.
(E) Retail minutes of use per customer per month represents the average monthly minutes that Alltel's customers use on both the Company's network and while roaming on other carriers' networks.
(F) Service revenue operating margin is calculated by dividing operating income by service revenues.
Operating results from current businesses have been reconciled to operating results under GAAP on pages 3 and 4 of this earnings release.
-more-
9. ALLTEL CORPORATION
CONSOLIDATED BALANCE SHEETS UNDER GAAP-Page 9
(In thousands)
ASSETS LIABILITIES AND SHAREHOLDERS' EQUITY
September 30, December 31, September 30, December 31,
2006 2005 2006 2005
CURRENT ASSETS: CURRENT LIABILITIES:
Cash and short-term investments $ 3,085,999 $ 982,407 Current maturities of long-term debt $ 222,602 $ 182,984
Accounts receivable (less allowance for Accounts payable 464,478 499,997
doubtful accounts of $63,973 and Advance payments and customer deposits 186,812 170,820
$70,607, respectively) 835,121 761,841 Accrued taxes 276,318 141,241
Inventories 156,153 195,183 Accrued dividends 66,114 147,841
Prepaid expenses and other 86,127 92,096 Accrued interest 56,140 98,307
Assets related to discontinued operations 71,509 565,365 Current deferred income taxes - 349,565
Other current liabilities 165,268 206,724
Total current assets 4,234,909 2,596,892 Liabilities related to discontinued operations 2,454 492,473
Investments 367,367 356,397 Total current liabilities 1,440,186 2,289,952
Goodwill 7,805,643 7,429,398
Other intangibles 1,858,805 1,861,354 Long-term debt 2,711,554 5,544,145
Deferred income taxes 1,114,505 1,142,311
Other liabilities 706,352 796,940
PROPERTY, PLANT AND EQUIPMENT: Liabilities related to discontinued operations - 1,224,316
Land 294,443 280,334
Buildings and improvements 906,088 901,116 Total liabilities 4,532,411 8,707,712
Operating plant and equipment 7,577,004 7,362,841
Information processing 1,025,244 1,126,458 SHAREHOLDERS' EQUITY:
Furniture and fixtures 165,567 143,618 Preferred stock 258 278
Under construction 417,652 344,341 Common stock 378,914 383,613
Additional paid-in capital 5,119,505 5,339,321
Total property, plant and equipment 10,385,998 10,158,708 Unrealized holding gain on investments 38,028 22,297
Less accumulated depreciation 5,435,965 5,055,999 Foreign currency translation adjustment - (2,841)
Retained earnings 7,820,921 7,272,769
Net property, plant and equipment 4,950,033 5,102,709
Total shareholders' equity 13,357,626 13,015,437
Other assets 113,466 248,151
Assets related to discontinued operations - 6,418,200
TOTAL LIABILITIES AND
TOTAL ASSETS $19,330,223 $24,013,101 SHAREHOLDERS' EQUITY $19,330,223 $24,013,101
-more-
10. ALLTEL CORPORATION
CONSOLIDATED STATEMENTS OF CASH FLOWS UNDER GAAP-Page 10
(In thousands)
THREE MONTHS ENDED NINE MONTHS ENDED
September 30, September 30, September 30, September 30,
2006 2005 2006 2005
Net Cash Provided from Operations:
Net income $ 187,205 $ 361,165 $ 913,515 $ 1,076,230
Adjustments to reconcile net income to net cash provided from operations:
Income from discontinued operations (21,934) (176,951) (325,631) (458,515)
Depreciation and amortization expense 307,136 266,214 916,012 699,266
Provision for doubtful accounts 66,480 54,830 179,873 131,098
Non-cash portion of (gain) loss on exchange or disposal of assets and other 27,547 (30,557) (80,026) (232,742)
Non-cash portion of integration expenses and other charges - 10,000 - 10,000
Change in deferred income taxes (14,050) 15,003 7,217 19,052
Other, net (1,985) 392 (6,318) 9,493
Changes in operating assets and liabilities, net of the effects of
acquisitions and dispositions:
Accounts receivable (109,788) (107,710) (245,903) (217,567)
Inventories (31,417) 12,407 39,583 9,982
Accounts payable 32,845 53,006 (35,312) (6,333)
Other current liabilities (100,634) (118,246) (323,166) (44,727)
Other, net (1,332) 33,129 (55,015) 7,378
Net cash provided from operations 340,073 372,682 984,829 1,002,615
Cash Flows from Investing Activities:
Additions to property, plant and equipment (277,373) (227,120) (718,574) (681,310)
Additions to capitalized software development costs (6,984) (11,037) (24,000) (35,375)
Additions to investments (167) (75) (686) (950)
Purchases of property, net of cash acquired (130) (912,067) (676,548) (1,135,799)
Proceeds from the sale of assets - - - 36,162
Proceeds from the sale of investments 560 436 200,481 353,881
Proceeds from the return on investments 14,471 10,579 36,748 30,907
Other, net (1,429) 7,918 10,466 19,640
Net cash used in investing activities (271,052) (1,131,366) (1,172,113) (1,412,844)
Cash Flows from Financing Activities:
Dividends on common and preferred stock (149,943) (124,449) (447,095) (345,169)
Repayments of long-term debt (1,011,496) (2,202,811) (1,012,226) (2,655,621)
Distributions to minority investors (7,415) (17,799) (27,708) (44,808)
Repurchases of common stock (709,001) - (709,001) -
Excess tax benefits from stock option exercises 2,199 - 5,408 -
Long-term debt issued - 877,700 - 927,700
Conversion of convertible debt - - (59,848) -
Common stock issued 102,895 43,477 191,479 1,442,790
Net cash used in financing activities (1,772,761) (1,423,882) (2,058,991) (675,108)
Net cash provided from discontinued operations 2,263,278 232,037 4,355,746 675,906
Effect of exchange rate changes on cash and short-term investments - (1,492) (5,879) (1,492)
Increase (decrease) in cash and short-term investments 559,538 (1,952,021) 2,103,592 (410,923)
Cash and Short-term Investments:
Beginning of the period 2,526,461 2,018,346 982,407 477,248
End of the period $ 3,085,999 $ 66,325 $ 3,085,999 $ 66,325
-more-
11. ALLTEL CORPORATION
RECONCILIATIONS OF RESULTS OF OPERATIONS UNDER GAAP TO RESULTS OF OPERATIONS FROM CURRENT BUSINESSES (NON-GAAP)-Page 11
(In thousands)
THREE MONTHS ENDED NINE MONTHS ENDED
September 30, September 30, September 30, September 30,
2006 2005 2006 2005
Net cash provided from operations $ 340,073 $ 372,682 $ 984,829 $ 1,002,615
Adjustments to reconcile to net income under GAAP:
Income from discontinued operations 21,934 176,951 325,631 458,515
Depreciation and amortization expense (307,136) (266,214) (916,012) (699,266)
Provision for doubtful accounts (66,480) (54,830) (179,873) (131,098)
Non-cash portion of (loss) gain on exchange or disposal of assets and othe (27,547) 30,557 80,026 232,742
Non-cash portion of integration expenses and other charges - (10,000) - (10,000)
Change in deferred income taxes 14,050 (15,003) (7,217) (19,052)
Other non-cash changes, net 1,985 (392) 6,318 (9,493)
Changes in operating assets and liabilities, net of the
effects of acquisitions and dispositions 210,326 127,414 619,813 251,267
Net income under GAAP 187,205 361,165 913,515 1,076,230
Adjustments to reconcile to net income from current businesses:
Amortization expense related to acquired, finite-lived intangible assets, net of tax 23,941 20,021 80,444 37,582
Hurricane-related costs, net of insurance recoveries and tax - 3,002 - 3,002
Reversal of excess bad debt reserve related to Hurricane Katrina, net of tax - - (1,366) -
Integration expenses and other charges, net of tax - 8,773 6,589 8,773
Loss (gain) on exchange or disposal of assets and other, net of tax 38,775 (18,681) (68,798) (136,720)
Special dividend received on Fidelity National common stock,
net of tax - - - (69,812)
Compensation expense due to accelerated vesting of restricted stock, net of tax 2,213 - 2,213 -
Change in accounting for operating leases, net of tax - - - 12,009
Income from discontinued operations (21,934) (176,951) (325,631) (458,515)
Net income from current businesses 230,200 197,329 606,966 472,549
Adjustments to reconcile to equity free cash flow from current businesses:
Depreciation expense from current businesses 267,945 233,841 784,353 638,422
Capital expenditures (284,357) (238,157) (742,574) (716,685)
Equity free cash flow from current businesses $ 213,788 $ 193,013 $ 648,745 $ 394,286
-end-