1. ALLTEL CORPORATION
CONSOLIDATED HIGHLIGHTS AND OTHER FINANCIAL INFORMATION (UNAUDITED)
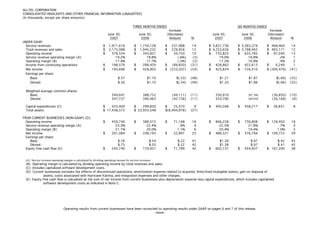
(In thousands, except per share amounts)
THREE MONTHS ENDED SIX MONTHS ENDED
Increase Increase
June 30, June 30, (Decrease) June 30, June 30, (Decrease)
2007 2006 Amount % 2007 2006 Amount %
UNDER GAAP:
Service revenues $ 1,971,616 $ 1,734,128 $ 237,488 14 $ 3,851,736 $ 3,383,276 $ 468,460 14
Total revenues and sales
Wireless $ 2,175,088 $ 1,945,232 $ 229,856 12 $ 4,253,636 $ 3,788,465 $ 465,171 12
Operating income
Wireless $ 378,534 $ 343,831 $ 34,703 10 $ 732,825 $ 635,785 $ 97,040 15
Service revenue operating margin (A) 19.2% 19.8% (.6%) (3) 19.0% 18.8% .2% 1
Operating margin (B)
Wireless 17.4% 17.7% (.3%) (2) 17.2% 16.8% .4% 2
Income from continuing operations $ 198,579 $ 288,429 $ (89,850) (31) $ 428,862 $ 422,613 $ 6,249 1
Net income $ 195,696 $ 428,903 $ (233,207) (54) $ 425,834 $ 726,310 $ (300,476) (41)
Earnings per share:
Basic $.57 $1.10 $(.53) (48) $1.21 $1.87 $(.66) (35)
Diluted $.56 $1.10 $(.54) (49) $1.20 $1.86 $(.66) (35)
Weighted average common shares:
Basic 344,641 388,752 (44,111) (11) 350,910 (36,850) (10)
387,760
Diluted 347,727 390,463 (42,736) (11) 353,790 (36,168) (9)
389,958
Capital expenditures (C) $ 325,400 $ 299,830 $ 25,570 9 $ 495,048 $ 458,217 $ 36,831 8
Total assets $ 17,438,572 $ 23,933,548 $(6,494,976) (27)
FROM CURRENT BUSINESSES (NON-GAAP) (D):
Operating income $ 459,740 $ 388,572 $ 71,168 18 $ 866,258 $ 736,808 $ 129,450 18
Service revenue operating margin (A) 23.3% 22.4% .9% 4 22.5% 21.8% .7% 3
Operating margin (B) 21.1% 20.0% 1.1% 6 20.4% 19.4% 1.0% 5
Net income $ 261,084 $ 208,193 $ 52,891 25 $ 486,521 $ 376,766 $ 109,755 29
Earnings per share:
Basic $.76 $.54 $.22 41 $1.39 $.97 $.42 43
Diluted $.75 $.53 $.22 42 $1.38 $.97 $.41 42
Equity free cash flow (E) $ 242,740 $ 170,951 $ 71,789 42 $ 602,157 $ 434,957 $ 167,200 38
(A) Service revenue operating margin is calculated by dividing operating income by service revenues.
(B) Operating margin is calculated by dividing operating income by total revenues and sales.
(C) Includes capitalized software development costs.
(D) Current businesses excludes the effects of discontinued operations, amortization expense related to acquired, finite-lived intangible assets, gain on disposal of
assets, costs associated with Hurricane Katrina, and integration expenses and other charges.
(E) Equity free cash flow is calculated as the sum of net income from current businesses plus depreciation expense less capital expenditures, which includes capitalized
software development costs as indicated in Note C.
Operating results from current businesses have been reconciled to operating results under GAAP on pages 6 and 7 of this release.
-more-
2. ALLTEL CORPORATION
CONSOLIDATED STATEMENTS OF INCOME UNDER GAAP (UNAUDITED)-Page 2
(In thousands, except per share amounts)
THREE MONTHS ENDED SIX MONTHS ENDED
June 30, June 30, June 30, June 30,
2007 2006 2007 2006
Revenues and sales:
Service revenues $ 1,971,616 $ 1,734,128 $ 3,851,736 $ 3,383,276
Product sales 203,472 211,104 401,900 405,189
Total revenues and sales 2,175,088 1,945,232 4,253,636 3,788,465
Costs and expenses:
Cost of services 640,212 573,977 1,251,207 1,116,761
Cost of products sold 288,638 283,351 576,147 556,048
Selling, general, administrative and other 479,442 434,509 949,340 860,205
Depreciation and amortization 352,271 309,564 701,776 608,876
Integration expenses and other charges 35,991 - 42,341 10,790
Total costs and expenses 1,796,554 1,601,401 3,520,811 3,152,680
Operating income 378,534 343,831 732,825 635,785
Equity earnings in unconsolidated partnerships 16,406 15,399 31,385 28,331
Minority interest in consolidated partnerships (8,889) (11,482) (18,583) (25,377)
Other income, net 5,591 21,016 13,263 31,807
Interest expense (47,437) (86,438) (94,132) (171,154)
Gain on disposal of assets - 176,639 56,548 176,639
Income from continuing operations before income taxes 344,205 458,965 721,306 676,031
Income taxes 145,626 170,536 292,444 253,418
Income from continuing operations 198,579 288,429 428,862 422,613
Income (loss) from discontinued operations (2,883) 140,474 (3,028) 303,697
Net income 195,696 428,903 425,834 726,310
Preferred dividends 19 21 39 42
Net income applicable to common shares $ 195,677 $ 428,882 $ 425,795 $ 726,268
Basic earnings per share:
Income from continuing operations $.58 $ .74 $1.22 $1.09
Income (loss) from discontinued operations (.01) .36 (.01) .78
Net income $.57 $1.10 $1.21 $1.87
Diluted earnings per share:
Income from continuing operations $.57 $ .74 $1.21 $1.08
Income (loss) from discontinued operations (.01) .36 (.01) .78
Net income $.56 $1.10 $1.20 $1.86
-more-
3. ALLTEL CORPORATION
CONSOLIDATED BALANCE SHEETS UNDER GAAP (UNAUDITED)-Page 3
(In thousands)
ASSETS LIABILITIES AND SHAREHOLDERS' EQUITY
June 30, December 31, June 30, December 31,
2007 2006 2007 2006
CURRENT ASSETS: CURRENT LIABILITIES:
Cash and short-term investments $ 456,298 $ 934,228 Current maturities of long-term debt $ 39,689 $ 36,285
Accounts receivable (less allowance for Accounts payable 496,231 576,126
doubtful accounts of $64,500 and Advance payments and customer deposits 205,270 186,193
$54,865, respectively) 839,195 807,307 Accrued taxes 180,538 114,109
Inventories 206,473 218,629 Accrued dividends 43,010 46,039
Prepaid expenses and other 86,106 67,665 Accrued interest 79,105 79,281
Assets related to discontinued operations - 4,321 Other current liabilities 185,577 156,471
Liabilities related to discontinued operations - 2,761
Total current assets 1,588,072 2,032,150
Total current liabilities 1,229,420 1,197,265
Investments 187,067 368,871
Goodwill 8,421,305 8,447,013
Other intangibles 2,042,341 2,129,346 Long-term debt 2,743,942 2,697,412
Deferred income taxes 1,083,342 1,109,479
PROPERTY, PLANT AND EQUIPMENT: Other liabilities 700,146 677,609
Land 328,310 314,902
Buildings and improvements 990,888 955,061 Total liabilities 5,756,850 5,681,765
Operating plant and equipment 8,313,569 7,933,840
Information processing 1,114,089 1,048,136
Furniture and fixtures 178,560 173,835 SHAREHOLDERS' EQUITY:
Under construction 431,093 495,968 Preferred stock 253 258
Common stock 343,864 364,572
Total property, plant and equipment 11,356,509 10,921,742 Additional paid-in capital 3,031,311 4,296,786
Less accumulated depreciation 6,257,618 5,690,360 Accumulated other comprehensive income (loss) (26,053) 9,525
Retained earnings 8,332,347 7,990,808
Net property, plant and equipment 5,098,891 5,231,382
Total shareholders' equity 11,681,722 12,661,949
Other assets 100,896 89,455
Assets related to discontinued operations - 45,497
TOTAL LIABILITIES AND
TOTAL ASSETS $ 17,438,572 $ 18,343,714 SHAREHOLDERS' EQUITY $ 17,438,572 $ 18,343,714
-more-
4. ALLTEL CORPORATION
CONSOLIDATED STATEMENTS OF CASH FLOWS UNDER GAAP (UNAUDITED)-Page 4
(In thousands)
THREE MONTHS ENDED SIX MONTHS ENDED
June 30, June 30, June 30, June 30,
2007 2006 2007 2006
Cash Flows from Operating Activities:
Net income $ 195,696 $ 428,903 $ 425,834 $ 726,310
Adjustments to reconcile net income to net cash provided from operating activities:
Loss (income) from discontinued operations 2,883 (140,474) 3,028 (303,697)
Depreciation and amortization expense 352,271 309,564 701,776 608,876
Provision for doubtful accounts 49,566 64,693 86,827 113,393
Non-cash portion of gain on disposal of assets - (176,639) (56,548) (176,639)
Change in deferred income taxes 34,938 (19,220) 47,093 21,267
Other, net (9,441) (4,264) (16,163) (4,334)
Changes in operating assets and liabilities, net of the effects of
acquisitions and dispositions:
Accounts receivable (124,393) (127,422) (120,834) (136,115)
Inventories 7,889 34,336 12,156 71,000
Accounts payable 8,103 32,478 (81,675) (68,157)
Other current liabilities 34,799 (109,112) 133,800 (155,913)
Other, net (763) (35,373) (22,585) (53,684)
Net cash provided from operating activities 551,548 257,470 1,112,709 642,307
Cash Flows from Investing Activities:
Additions to property, plant and equipment (315,963) (290,528) (477,818) (441,201)
Additions to capitalized software development costs (9,437) (9,302) (17,230) (17,016)
Purchases of property, net of cash acquired (3,750) (217,487) (6,250) (676,418)
Proceeds from the sale of investments - 199,921 188,711 199,921
Proceeds from the return on investments 13,880 13,363 24,811 22,277
Other, net 1,036 4,058 680 11,377
Net cash used in investing activities (314,234) (299,975) (287,096) (901,060)
Cash Flows from Financing Activities:
Dividends on common and preferred stock (44,565) (149,415) (90,526) (297,152)
Repayments of long-term debt (35,590) (41) (36,254) (730)
Cash payments to effect conversion of convertible notes - - - (59,848)
Distributions to minority investors (13,283) (8,483) (21,055) (20,293)
Purchases of common stock (421,514) - (1,360,298) -
Excess tax benefits from stock option exercises 1,339 2,276 5,169 5,657
Long-term debt issued 100,000 - 100,000 -
Common stock issued 10,510 33,688 52,958 88,584
Net cash used in financing activities (403,103) (121,975) (1,350,006) (283,782)
Cash Flows from Discontinued Operations:
Cash provided from (used in) operating activities (3,107) 165,013 (1,178) 599,484
Cash provided from investing activities 48,365 1,557,828 47,641 1,492,015
Cash provided from financing activities - 92,726 - 969
Net cash provided from discontinued operations 45,258 1,815,567 46,463 2,092,468
Effect of exchange rate changes on cash and short-term investments - (6,464) - (5,879)
Increase (decrease) in cash and short-term investments (120,531) 1,644,623 (477,930) 1,544,054
Cash and Short-term Investments:
Beginning of the period 576,829 881,838 934,228 982,407
End of the period $ 456,298 $ 2,526,461 $ 456,298 $ 2,526,461
-more-
5. ALLTEL CORPORATION
SUPPLEMENTAL OPERATING INFORMATION (UNAUDITED)-Page 5
(Dollars in thousands, except per customer amounts)
THREE MONTHS ENDED SIX MONTHS ENDED
Increase Increase
June 30, June 30, (Decrease) June 30, June 30, (Decrease)
2007 2006 Amount % 2007 2006 Amount %
Controlled POPs 79,575,793 78,000,811 1,574,982 2
Customers 12,242,066 11,085,145 1,156,921 10
Penetration rate 15.4% 14.2% 1.2% 8
Average customers 12,147,380 10,951,268 1,196,112 11 12,041,655 10,838,881 1,202,774 11
Gross customer additions:
Internal 789,961 770,589 19,372 3 1,657,434 1,576,043 81,391 5
Acquired - 112,095 (112,095) (100) - 112,095 (112,095) (100)
Total 789,961 882,684 (92,723) (11) 1,657,434 1,688,138 (30,704) (2)
Net customer additions:
Internal 181,494 145,985 35,509 24 418,128 310,726 107,402 35
Acquired - 112,095 (112,095) (100) - 112,095 (112,095) (100)
Total 181,494 258,080 (76,586) (30) 418,128 422,821 (4,693) (1)
Cash costs from current businesses:
Cost of services $ 640,212 $ 576,212 $ 64,000 11 $ 1,251,207 $ 1,118,996 $ 132,211 12
Cost of products sold 288,638 283,351 5,287 2 576,147 556,048 20,099 4
Selling, general, administrative and other 479,442 434,509 44,933 10 949,340 860,205 89,135 10
Less product sales 203,472 211,104 (7,632) (4) 401,900 405,189 (3,289) (1)
Total $ 1,204,820 $ 1,082,968 $ 121,852 11 $ 2,374,794 $ 2,130,060 $ 244,734 11
Cash costs from current businesses
per unit per month (A) $33.06 $32.96 $.10 - $32.87 $32.75 $.12 -
Revenues:
Service revenues $ 1,971,616 $ 1,734,128 $ 237,488 14 $ 3,851,736 $ 3,383,276 $ 468,460 14
Less wholesale roaming revenues 170,121 163,590 6,531 4 324,308 314,593 9,715 3
Less wholesale transport revenues 42,850 7,844 35,006 446 89,284 18,194 71,090 391
Retail revenues $ 1,758,645 $ 1,562,694 $ 195,951 13 $ 3,438,144 $ 3,050,489 $ 387,655 13
Average revenue per customer per month (B) $54.10 $52.78 $1.32 3 $53.31 $52.02 $1.29 2
Retail revenue per customer per month (C) $48.26 $47.57 $.69 1 $47.59 $46.91 $.68 1
Retail minutes of use per customer per month (D) 724 638 86 13 688 620 68 11
Postpay churn 1.16% 1.47% (.31%) (21) 1.24% 1.56% (.32%) (21)
Total churn 1.67% 1.91% (.24%) (13) 1.72% 1.95% (.23%) (12)
(A) Cash costs from current businesses per unit per month is calculated by dividing the sum of the current businesses reported cost of services, cost of products sold, selling,
general, administrative and other expenses less product sales by the number of average customers for the period. Measured on a GAAP basis, cash costs per unit per
month were $33.06 and $32.87 for the three and six months ended June 30, 2007, respectively, and $32.90 and $32.72 for the same periods of 2006, respectively.
(B) Average revenue per customer per month is calculated by dividing service revenues by average customers for the period.
(C) Retail revenue per customer per month is calculated by dividing retail revenues (service revenues less wholesale revenues) by average customers for the period.
(D) Retail minutes of use per customer per month represents the average monthly minutes that Alltel's customers use on both the Company's network and while roaming on
other carriers' networks.
Operating results from current businesses have been reconciled to operating results under GAAP on pages 6 and 7 of this release.
-more-
6. ALLTEL CORPORATION
RECONCILIATIONS OF RESULTS OF OPERATIONS UNDER GAAP TO RESULTS OF OPERATIONS FROM CURRENT BUSINESSES (NON-GAAP) (UNAUDITED)-Page 6
(In thousands)
THREE MONTHS ENDED JUNE 30, 2007
Income Income
Depreciation Before From Basic Diluted
Cost of and Operating Income Income Continuing Net Earnings Earnings
Services Amortization Income Taxes Taxes Operations Income Per Share Per Share
$.57 $.56
Under GAAP $ 640,212 $ 352,271 $ 378,534 $ 344,205 $ 145,626 $ 198,579 $ 195,696
Items excluded from measuring results from current businesses:
Amortization expense related to acquired,
.08 .08
finite-lived intangible assets (A) - (45,215) 45,215 45,215 17,589 27,626 27,626
.10 .10
Integration expenses and other charges (B)(C) - - 35,991 35,991 1,112 34,879 34,879
.01 .01
Loss from discontinued operations (I) - - - - - - 2,883
.19 .19
Net increase (decrease) - (45,215) 81,206 81,206 18,701 62,505 65,388
$.76 $.75
From current businesses $ 640,212 $ 307,056 $ 459,740 $ 425,411 $ 164,327 $ 261,084 $ 261,084
THREE MONTHS ENDED JUNE 30, 2006
Income Income
Depreciation Before From Basic Diluted
Cost of and Operating Income Income Continuing Net Earnings Earnings
Services Amortization Income Taxes Taxes Operations Income Per Share Per Share
$1.10 $1.10
Under GAAP $ 573,977 $ 309,564 $ 343,831 $ 458,965 $ 170,536 $ 288,429 $ 428,903
Items excluded from measuring results from current businesses:
Amortization expense related to acquired,
.08 .07
finite-lived intangible assets (A) - (46,976) 46,976 46,976 18,274 28,702 28,702
Reversal of excess bad debt reserve related
to Hurricane Katrina (G) 2,235 - (2,235) (2,235) (869) (1,366) (1,366) - -
(.28) (.28)
Gain on disposal of assets (H) - - - (176,639) (69,067) (107,572) (107,572)
(.36) (.36)
Income from discontinued operations (I) - - - - - - (140,474)
(.56) (.57)
Net increase (decrease) 2,235 (46,976) 44,741 (131,898) (51,662) (80,236) (220,710)
$.54 $.53
From current businesses $ 576,212 $ 262,588 $ 388,572 $ 327,067 $ 118,874 $ 208,193 $ 208,193
-more-
7. ALLTEL CORPORATION
RECONCILIATIONS OF RESULTS OF OPERATIONS UNDER GAAP TO RESULTS OF OPERATIONS FROM CURRENT BUSINESSES (NON-GAAP) (UNAUDITED)-Page 7
(In thousands)
SIX MONTHS ENDED JUNE 30, 2007
Income Income
Depreciation Before From Basic Diluted
Cost of and Operating Income Income Continuing Net Earnings Earnings
Services Amortization Income Taxes Taxes Operations Income Per Share Per Share
$1.21 $1.20
Under GAAP $ 1,251,207 $ 701,776 $ 732,825 $ 721,306 $ 292,444 $ 428,862 $ 425,834
Items excluded from measuring results from current businesses:
Amortization expense related to acquired,
.16 .16
finite-lived intangible assets (A) - (91,092) 91,092 91,092 35,435 55,657 55,657
.11 .11
Integration expenses and other charges (B)(C)(D) - - 42,341 42,341 3,583 38,758 38,758
Gain on disposal of assets (.10) (.10)
(E) - - - (56,548) (19,792) (36,756) (36,756)
.01 .01
Loss from discontinued operations (I) - - - - - - 3,028
.18 .18
Net increase (decrease) - (91,092) 133,433 76,885 19,226 57,659 60,687
$1.39 $1.38
From current businesses $ 1,251,207 $ 610,684 $ 866,258 $ 798,191 $ 311,670 $ 486,521 $ 486,521
SIX MONTHS ENDED JUNE 30, 2006
Income Income
Depreciation Before From Basic Diluted
Cost of and Operating Income Income Continuing Net Earnings Earnings
Services Amortization Income Taxes Taxes Operations Income Per Share Per Share
$1.87 $1.86
Under GAAP $ 1,116,761 $ 608,876 $ 635,785 $ 676,031 $ 253,418 $ 422,613 $ 726,310
Items excluded from measuring results from current businesses:
Amortization expense related to acquired,
.15 .15
finite-lived intangible assets (A) - (92,468) 92,468 92,468 35,970 56,498 56,498
Reversal of excess bad debt reserve related
to Hurricane Katrina (G) 2,235 - (2,235) (2,235) (869) (1,366) (1,366) - -
Gain on disposal of assets (.28) (.28)
(H) - - - (176,639) (69,067) (107,572) (107,572)
.02 .01
Integration expenses and other charges (F) - - 10,790 10,790 4,197 6,593 6,593
(.79) (.77)
Income from discontinued operations (I) - - - - - - (303,697)
(.90) (.89)
Net increase (decrease) 2,235 (92,468) 101,023 (75,616) (29,769) (45,847) (349,544)
$.97 $.97
From current businesses $ 1,118,996 $ 516,408 $ 736,808 $ 600,415 $ 223,649 $ 376,766 $ 376,766
-more-
8. ALLTEL CORPORATION
RECONCILIATIONS OF RESULTS OF OPERATIONS UNDER GAAP TO RESULTS OF OPERATIONS FROM CURRENT BUSINESSES (NON-GAAP) (UNAUDITED)-Page 8
(In thousands)
THREE MONTHS ENDED SIX MONTHS ENDED
June 30, June 30, June 30, June 30,
2007 2006 2007 2006
Net cash provided from operating activities $ 551,548 $ 257,470 $ 1,112,709 $ 642,307
Adjustments to reconcile to net income under GAAP:
Income (loss) from discontinued operations (2,883) 140,474 (3,028) 303,697
Depreciation and amortization expense (352,271) (309,564) (701,776) (608,876)
Provision for doubtful accounts (49,566) (64,693) (86,827) (113,393)
Non-cash portion of gain on disposal of assets - 176,639 56,548 176,639
Change in deferred income taxes (34,938) 19,220 (47,093) (21,267)
Other non-cash changes, net 9,441 4,264 16,163 4,334
Changes in operating assets and liabilities, net of the
effects of acquisitions and dispositions 74,365 205,093 79,138 342,869
Net income under GAAP 195,696 428,903 425,834 726,310
Adjustments to reconcile to net income from current businesses,
net of tax (see specific items listed on pages 6 and 7) 65,388 (220,710) 60,687 (349,544)
Net income from current businesses 261,084 208,193 486,521 376,766
Adjustments to reconcile to equity free cash flow from current businesses:
Depreciation expense from current businesses 307,056 262,588 610,684 516,408
Capital expenditures (325,400) (299,830) (495,048) (458,217)
Equity free cash flow from current businesses $ 242,740 $ 170,951 $ 602,157 $ 434,957
-more-
9. ALLTEL CORPORATION
NOTES TO RECONCILIATIONS OF RESULTS OF OPERATIONS UNDER GAAP TO RESULTS OF OPERATIONS FROM CURRENT BUSINESSES (NON-GAAP)
(UNAUDITED)-Page 9
As disclosed in the ALLTEL Corporation (quot;Alltelquot; or the quot;Companyquot;) Form 8-K filed on August 1, 2007, Alltel has presented in this earnings release results of operations from current
businesses which exclude the effects of discontinued operations, amortization expense related to acquired, finite-lived intangible assets, gain on disposal of assets, costs associated with
Hurricane Katrina, and integration expenses and other charges. Alltel's purpose for excluding items from the current business measures is to focus on Alltel’s true earnings capacity
associated with providing wireless communications services. Management believes the items excluded from the current business measures are related to strategic activities or other
events, specific to the time and opportunity available, and, accordingly, should be excluded when evaluating the trends of the Company's operations.
Alltel believes that presenting the current business measures assists investors in assessing the true business performance of the Company by clarifying for investors the effects that certain
items such as asset sales, integration expenses and other business consolidation costs arising from past acquisition and integration activities had on the Company’s GAAP consolidated
results of operations. The Company uses results from current businesses as management’s primary measure of the performance of its business operations. Alltel's management, including
the chief operating decision-maker, uses the current business measures consistently for all purposes, including internal reporting purposes, the evaluation of business objectives,
opportunities and performance and the determination of management compensation.
(A) Eliminates the effects of amortization expense related to acquired, finite-lived intangible assets.
(B) On May 20, 2007, Alltel entered into an agreement to be acquired by two private investment firms, TPG Partners V, L.P. and GS Capital Partners VI Fund, L.P. Completion of the
transaction, which is currently expected to occur by the end of 2007, is contingent upon customary closing conditions, including approval by Alltel’s shareholders and certain regulatory
approvals, including the approval of the Federal Communications Commission (quot;FCCquot;). In connection with this transaction, Alltel incurred $33.1 million of incremental costs, principally
consisting of financial advisory, legal and regulatory filing fees.
(C) During the second quarter of 2007, the Company incurred $2.2 million of integration expenses related to its acquisitions of Midwest Wireless Holdings (quot;Midwest Wirelessquot;) and wireless
properties in Illinois, Texas and Virginia completed during 2006 (collectively, quot;the 2006 acquisitionsquot;). These expenses primarily consisted of branding, signage and computer system
conversion costs. Alltel also recorded $0.7 million of severance and employee benefit costs associated with the closing of a call center.
(D) During the first quarter of 2007, the Company incurred $2.6 million of integration expenses related to the 2006 acquisitions consisting of branding, signage and computer system
conversion costs. Alltel also recorded a pretax charge of $3.7 million associated with the closing of two call centers, consisting of severance and employee benefit costs related to a
planned workforce reduction.
(E) Alltel completed the sale of marketable equity securities that had been acquired in connection with its August 1, 2005 merger with Western Wireless Corporation (quot;Western Wirelessquot;). In
connection with the sale of these securities, Alltel recorded a pretax gain of $56.5 million.
(F) The Company incurred $10.8 million of integration expenses related to its acquisition of Western Wireless. These expenses consisted of $8.3 million of rebranding costs and $2.5 million
of system conversion costs and other integration costs.
(G) The Company recorded a $2.2 million reduction in its allowance for doubtful accounts to reflect lower than expected write-offs from service interruptions and customer displacement
attributable to the effects of Hurricane Katrina. The additional bad debt expense was originally recorded in the third quarter of 2005.
(H) During 2005, federal legislation was enacted which included provisions to dissolve and liquidate the assets of the Rural Telephone Bank (quot;RTBquot;). In connection with the dissolution and
liquidation, during April 2006, the RTB redeemed all outstanding shares of its Class C stock. As a result, Alltel received liquidating cash distributions of $198.7 million in exchange for its
$22.1 million investment in RTB Class C stock.
-more-
10. ALLTEL CORPORATION
NOTES TO RECONCILIATIONS OF RESULTS OF OPERATIONS UNDER GAAP TO RESULTS OF OPERATIONS FROM CURRENT BUSINESSES (NON-GAAP)
(UNAUDITED) (CONTINUED)-Page 10
(I) Eliminates the effects of discontinued operations. Loss from discontinued operations in the six month period ended June 30, 2007 included an impairment charge of $1.7 million to reflect
the fair value less cost to sell of the four rural markets in Minnesota required to be divested, as further discussed below.
As a condition of receiving approval from the Department of Justice (quot;DOJquot;) and the FCC for its acquisition of Midwest Wireless, on September 7, 2006, Alltel agreed to divest certain
wireless operations in four rural markets in Minnesota. Accordingly, the four markets to be divested in Minnesota have been classified as discontinued operations in the accompanying
unaudited consolidated financial statements. On April 3, 2007, Alltel completed the sale of these properties.
On July 17, 2006, Alltel completed the spin-off of its wireline telecommunications business to its stockholders and the merger of that wireline business with Valor Communications Group,
Inc. (quot;Valorquot;). The spin-off included the majority of Alltel’s communications support services, including directory publishing, information technology outsourcing services, retail long-
distance and the wireline sales portion of communications products. The new wireline company formed in the merger of Alltel's wireline operations and Valor is named Windstream
Corporation. As a result, Alltel's historical results of operations have been adjusted to reflect the wireline business as discontinued operations in the accompanying unaudited consolidated
financial statements.
In addition, as a condition of receiving approval for the Western Wireless acquisition from the DOJ and the FCC, Alltel agreed to divest certain wireless operations of Western Wireless in
16 markets in Arkansas, Kansas and Nebraska. In December 2005, Alltel completed an exchange of wireless properties with United States Cellular Corporation that included a substantial
portion of the divestiture requirements related to the merger. In the first quarter of 2006, Alltel completed the required divestitures with the sale of the remaining property in Arkansas.
During 2005, Alltel completed the sales of international operations in Georgia, Ghana and Ireland acquired from Western Wireless. During the second quarter of 2006, Alltel completed the
sales of the remaining international operations acquired from Western Wireless in Austria, Bolivia, Côte d’Ivoire, Haiti, and Slovenia. As a result, the acquired international operations and
interests of Western Wireless and the 16 markets to be divested in Arkansas, Kansas and Nebraska have been classified as discontinued operations in the accompanying unaudited
consolidated financial statements.
-end-