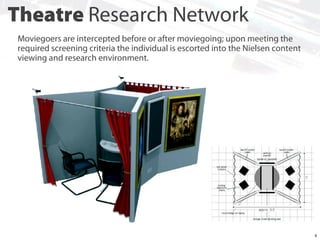
This document summarizes the findings of a research study about newspaper usage among moviegoers. Some key findings include:
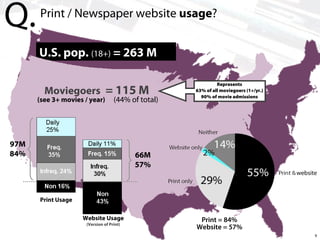
- 86% of moviegoers access newspapers in print or online. Newspaper usage does not vary by demographics.
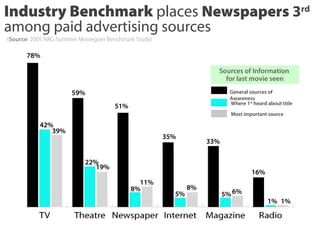
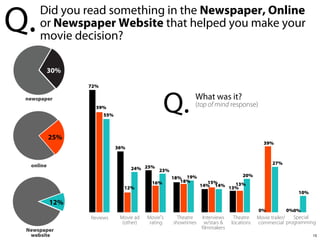
- For creating awareness of new movies, newspapers rank second only to television commercials and movie trailers.
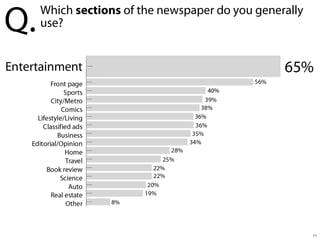
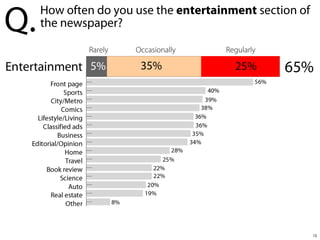
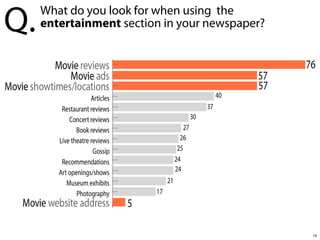
- The entertainment section is the most frequented newspaper section among moviegoers.
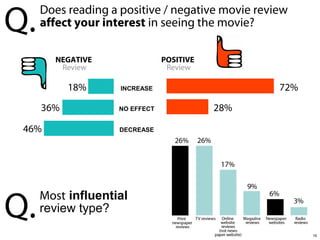
- Movie reviews and advertisements in newspapers have the greatest impact on movie selection decisions.
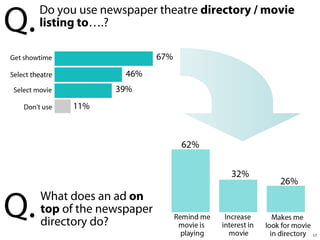
- Newspapers are the preferred source for obtaining theater showtime information, ahead of telephone and internet.


![[Report] Is TV still important media for Vietnamese?](https://cdn.slidesharecdn.com/ss_thumbnails/tvreporten-150528020431-lva1-app6891-thumbnail.jpg?width=640&height=640&fit=bounds)


