Alcohol drinking habits West Africa 2013
•
1 like•220 views

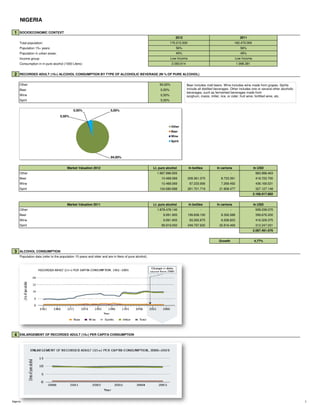
This document provides socioeconomic and alcohol consumption data for Nigeria, Niger, and Ghana. It shows that in Nigeria, other alcoholic beverages make up 94% of pure alcohol consumption while beer is 0.5% and wine and spirits are 0.5% and 5% respectively. Recorded adult per capita consumption is 9.8 liters while total is 12.3 liters. In Niger, beer accounts for 56% of pure alcohol consumption, wine is 11%, and spirits are 33%. Recorded adult per capita consumption is low at 0.1 liters. Ghana's other beverage consumption is 66% of pure alcohol, beer is 27%, wine is 5%, and spirits are 2%. Recorded adult per capita consumption

Recommended
More Related Content
Viewers also liked
Similar to Alcohol drinking habits West Africa 2013
Similar to Alcohol drinking habits West Africa 2013 (20)
Alcohol drinking habits West Africa 2013
- 1. NIGERIA 1 SOCIOECONOMIC CONTEXT Total population: Population 15+ years: Population in urban areas: Income group: Consumption in in pure alcohol (1000 Liters): 2 RECORDED ADULT (15+) ALCOHOL CONSUMPTION BY TYPE OF ALCOHOLIC BEVERAGE (IN % OF PURE ALCOHOL) Other 94,00% Beer 0,50% Wine 0,50% Spirit 5,00% Market Valuation 2012 Lt. pure alcohol In bottles In cartons In USD Other 1.967.996.925 - - 983.998.463 Beer 10.468.069 209.361.375 8.723.391 418.722.750 Wine 10.468.069 87.233.906 7.269.492 436.169.531 Spirit 104.680.688 261.701.719 21.808.477 327.127.148 2.166.017.892 2012 2011 162.470.000 56% 49% Low Income 1.998.381 170.212.500 2.093.614 56% 49% Low Income 94,00% 0,50% 0,50% 5,00% Other Beer Wine Spirit Beer includes malt beers. Wine includes wine made from grapes. Spirits include all distilled beverages. Other includes one or several other alcoholic beverages, such as fermented beverages made from sorghum, maize, millet, rice, or cider, fruit wine, fortified wine, etc. 2.166.017.892 Market Valuation 2011 Lt. pure alcohol In bottles In cartons In USD Other 1.878.478.140 - - 939.239.070 Beer 9.991.905 199.838.100 8.326.588 399.676.200 Wine 9.991.905 83.265.875 6.938.823 416.329.375 Spirit 99.919.050 249.797.625 20.816.469 312.247.031 2.067.491.676 Growth 4,77% 3 ALCOHOL CONSUMPTION Population data (refer to the population 15 years and older and are in liters of pure alcohol). 4 ENLARGEMENT OF RECORDED ADULT (15+) PER CAPITA CONSUMPTION Nigeria 1
- 2. 5 ADULT (15+) PER CAPITA CONSUMPTION, AVERAGE (IN LITRES OF PURE ALCOHOL): Recorded 9,8 Unrecorded 2,5 Total 12,3 WHO African Region 6,2 6 ROBUST ESTIMATE OF FIVE-YEAR CHANGE IN RECORDED ADULT (15+) PER CAPITA CONSUMPTION: Increase Stable Decrease Inconclusive 7 HEALTH CONSEQUENCES Prevalence estimates (12-month prevalence for 2004): Males Females Alcohol use disorders (15+ years) 1.95% 0.03% 8 PATTERNS OF DRINKING ABSTAINERS (15+ years), 2003 Males Females Total Lifetime abstainers 33.3% 50.9% 42.2% Former drinkers 16.1% 22.8% 19.5% Abstainers* 49.4% 73.7% 61.7% * Persons who did not drink in the past 12 months. 9 DRINKERS ONLY Adult (15+ years) per capita consumption*, total 32.06 Adult (15+ years) per capita consumption*, males 36.86 Adult (15+ years) per capita consumption*, females 22.99 Heavy episodic drinkers** (15–85+ years), males, 2003 31.7% Heavy episodic drinkers** (15–85+ years), females, 2003 24.7% * (Recorded + unrecorded) in liters of pure alcohol, average 2003–2005. ** Had at least 60 grams or more of pure alcohol on at least one occasion weekly. 10 PATTERNS OF DRINKING SCORE Least risky 1 2 3 4 5 Most risky 1 2 3 4 5 Patterns of drinking score* * Given the same level of consumption, the higher the patterns of drinking score, the greater the alcohol-attributable burden of disease for the country. 11 ALCOHOL POLICY Beer Wine Spirits Excise tax on YES YES YES National legal minimum age for off-premise sales of alcoholic beverages (serving) 18 18 18 National legal minimum age for on-premise sales of alcoholic beverages (serving) 18 18 18 Specific Events Intoxicated Persons Petrol Stations Restrictions for on-/off-premise sales of alcoholic beverages YES NO NO General Young Professional National maximum legal blood alcohol concentration (BAC) when driving a vehicle 0.05% 0.05% 0.05% Legally binding regulations on alcohol advertising Legally binding regulations on alcohol product placement Legally binding regulations on alcohol sponsorship Legally binding regulations on alcohol sales promotion Legally binding regulations onTime (hours and days) Legally binding regulations on Location (places and density) NO NO NO/YES Alcohol Policy NO NO NO Legally binding regulations on Location (places and density) NO/YES Nigeria 2
- 3. NIGER 1 SOCIOECONOMIC CONTEXT Total population: Population 15+ years: Population in urban areas: Income group: Consumption in in pure alcohol (1000 Liters): 2 RECORDED ADULT (15+) ALCOHOL CONSUMPTION BY TYPE OF ALCOHOLIC BEVERAGE (IN % OF PURE ALCOHOL) Other 0,00% Beer 56,00% Wine 11,00% Spirit 33,00% Market Valuation 2012 Lt. pure alcohol In bottles In cartons In USD Other - - - - Beer 2.786.700 55.734.000 2.322.250 55.734.000 Wine 547.388 4.561.563 380.130 22.807.813 Spirit 1.642.163 4.105.406 342.117 5.131.758 83.673.570 17% 17% Low Income Low Income 4.976 4.821 2012 2011 16.587.500 16.070.000 52% 52% 56,00% 11,00% 33,00% Other Beer Wine Spirit Beer includes malt beers. Wine includes wine made from grapes. Spirits include all distilled beverages. Other includes one or several other alcoholic beverages, such as fermented beverages made from sorghum, maize, millet, rice, or cider, fruit wine, fortified wine, etc. Market Valuation 2011 Lt. pure alcohol In bottles In cartons In USD Other - - - - Beer 2.699.760 53.995.200 2.249.800 53.995.200 Wine 530.310 4.419.250 368.271 22.096.250 Spirit 1.590.930 3.977.325 331.444 4.971.656 81.063.106 Growth 3,22% 3 ALCOHOL CONSUMPTION Population data (refer to the population 15 years and older and are in liters of pure alcohol). 4 ENLARGEMENT OF RECORDED ADULT (15+) PER CAPITA CONSUMPTION Niger 3
- 4. 5 ADULT (15+) PER CAPITA CONSUMPTION, AVERAGE (IN LITRES OF PURE ALCOHOL): Recorded 0,1 Unrecorded 0,2 Total 0,3 WHO African Region 6,2 6 ROBUST ESTIMATE OF FIVE-YEAR CHANGE IN RECORDED ADULT (15+) PER CAPITA CONSUMPTION: Increase Stable Decrease Inconclusive 7 HEALTH CONSEQUENCES Prevalence estimates (12-month prevalence for 2004): Males Females Alcohol use disorders (15+ years) 0.09% 0.01% 8 PATTERNS OF DRINKING ABSTAINERS (15+ years), 2003 Males Females Total Lifetime abstainers NA NA NA Former drinkers NA NA NA Abstainers* NA NA NA * Persons who did not drink in the past 12 months. 9 DRINKERS ONLY Adult (15+ years) per capita consumption*, total NA Adult (15+ years) per capita consumption*, males NA Adult (15+ years) per capita consumption*, females NA Heavy episodic drinkers** (15–85+ years), males, 2003 NA Heavy episodic drinkers** (15–85+ years), females, 2003 NA * (Recorded + unrecorded) in liters of pure alcohol, average 2003–2005. ** Had at least 60 grams or more of pure alcohol on at least one occasion weekly. 10 PATTERNS OF DRINKING SCORE Least risky 1 2 3 4 5 Most risky 1 2 3 4 5 Patterns of drinking score* * Given the same level of consumption, the higher the patterns of drinking score, the greater the alcohol-attributable burden of disease for the country. 11 ALCOHOL POLICY Beer Wine Spirits Excise tax on YES YES YES National legal minimum age for off-premise sales of alcoholic beverages (serving) 18 18 18 National legal minimum age for on-premise sales of alcoholic beverages (serving) 18 18 18 Specific Events Intoxicated Persons Petrol Stations Restrictions for on-/off-premise sales of alcoholic beverages NO YES YES General Young Professional National maximum legal blood alcohol concentration (BAC) when driving a vehicle NO NO NO Legally binding regulations on alcohol advertising Legally binding regulations on alcohol product placement Legally binding regulations on alcohol sponsorship Legally binding regulations on alcohol sales promotion Legally binding regulations onTime (hours and days) Legally binding regulations on Location (places and density) YES Alcohol Policy NO NO NO NO YES/NO Niger 4
- 5. GHANA 1 SOCIOECONOMIC CONTEXT Total population: Population 15+ years: Population in urban areas: Income group: Consumption in in pure alcohol (1000 Liters): 2 RECORDED ADULT (15+) ALCOHOL CONSUMPTION BY TYPE OF ALCOHOLIC BEVERAGE (IN % OF PURE ALCOHOL) Other 66,00% Beer 27,00% Wine 5,00% Spirit 2,00% Market Valuation 2012 Lt. pure alcohol In bottles In cartons In USD Other 50.898.375 - - 25.449.188 Beer 20.822.063 416.441.250 17.351.719 832.882.500 Wine 3.855.938 32.132.813 2.677.734 160.664.063 Spirit 1.542.375 3.855.938 321.328 4.819.922 1.023.815.672 2012 2011 25.706.250 24.965.000 Low middle Income Low middle Income 77.119 74.895 61% 61% 49% 49% 66,00% 27,00% 5,00% 2,00% Other Beer Wine Spirit Beer includes malt beers. Wine includes wine made from grapes. Spirits include all distilled beverages. Other includes one or several other alcoholic beverages, such as fermented beverages made from sorghum, maize, millet, rice, or cider, fruit wine, fortified wine, etc. Market Valuation 2011 Lt. pure alcohol In bottles In cartons In USD Other 49.430.700 - - 24.715.350 Beer 20.221.650 404.433.000 16.851.375 808.866.000 Wine 3.744.750 31.206.250 2.600.521 156.031.250 Spirit 1.497.900 3.744.750 312.063 4.680.938 994.293.538 Growth 2,97% 3 ALCOHOL CONSUMPTION Population data (refer to the population 15 years and older and are in liters of pure alcohol). 4 ENLARGEMENT OF RECORDED ADULT (15+) PER CAPITA CONSUMPTION Ghana 5
- 6. 5 ADULT (15+) PER CAPITA CONSUMPTION, AVERAGE (IN LITRES OF PURE ALCOHOL): Recorded 1,5 Unrecorded 1,5 Total 3 WHO African Region 6,2 6 ROBUST ESTIMATE OF FIVE-YEAR CHANGE IN RECORDED ADULT (15+) PER CAPITA CONSUMPTION: Increase Stable Decrease Inconclusive 7 HEALTH CONSEQUENCES Prevalence estimates (12-month prevalence for 2004): Males Females Alcohol use disorders (15+ years) 1.43% 0.16% 8 PATTERNS OF DRINKING ABSTAINERS (15+ years), 2003 Males Females Total Lifetime abstainers 52.1 64.4% 58.2% Former drinkers 15.9 8.4% 12.2% Abstainers* 68% 72.8% 70.4% * Persons who did not drink in the past 12 months. 9 DRINKERS ONLY Adult (15+ years) per capita consumption*, total 10.03 Adult (15+ years) per capita consumption*, males 12.54 Adult (15+ years) per capita consumption*, females 6.91 Heavy episodic drinkers** (15–85+ years), males, 2003 8% Heavy episodic drinkers** (15–85+ years), females, 2003 1.5% * (Recorded + unrecorded) in liters of pure alcohol, average 2003–2005. ** Had at least 60 grams or more of pure alcohol on at least one occasion weekly. 10 PATTERNS OF DRINKING SCORE Least risky 1 2 3 4 5 Most risky 1 2 3 4 5 Patterns of drinking score* * Given the same level of consumption, the higher the patterns of drinking score, the greater the alcohol-attributable burden of disease for the country. 11 ALCOHOL POLICY Beer Wine Spirits Excise tax on YES YES YES National legal minimum age for off-premise sales of alcoholic beverages (serving) 18 18 18 National legal minimum age for on-premise sales of alcoholic beverages (serving) 18 18 18 Specific Events Intoxicated Persons Petrol Stations Restrictions for on-/off-premise sales of alcoholic beverages NO NO NO General Young Professional National maximum legal blood alcohol concentration (BAC) when driving a vehicle 0,08% 0,08% 0,08% Legally binding regulations on alcohol advertising Legally binding regulations on alcohol product placement Legally binding regulations on alcohol sponsorship Legally binding regulations on alcohol sales promotion Legally binding regulations on Time (hours and days) Legally binding regulations on Location (places and density) YES NO NO NO NO/YES Alcohol Policy YES Ghana 6
- 7. TOGO 1 SOCIOECONOMIC CONTEXT Total population: Population 15+ years: Population in urban areas: Income group: Consumption in in pure alcohol (1000 Liters): 2 RECORDED ADULT (15+) ALCOHOL CONSUMPTION BY TYPE OF ALCOHOLIC BEVERAGE (IN % OF PURE ALCOHOL) Other 21,00% Beer 42,00% Wine 31,00% Spirit 6,00% Market Valuation 2012 Lt. pure alcohol In bottles In cartons In USD Other 3.008.250 - - 1.504.125 Beer 6.016.500 120.330.000 5.013.750 120.330.000 Wine 4.440.750 37.006.250 3.083.854 185.031.250 Spirit 859.500 2.148.750 179.063 2.685.938 309.551.313 Low Income Low Income 14.325 13.920 2012 2011 57% 57% 41% 41% 7.162.500 6.960.000 21,00% 42,00% 31,00% 6,00% Other Beer Wine Spirit Beer includes malt beers. Wine includes wine made from grapes. Spirits include all distilled beverages. Other includes one or several other alcoholic beverages, such as fermented beverages made from sorghum, maize, millet, rice, or cider, fruit wine, fortified wine, etc. Market Valuation 2011 Lt. pure alcohol In bottles In cartons In USD Other 2.923.200 - - 1.461.600 Beer 5.846.400 116.928.000 4.872.000 116.928.000 Wine 4.315.200 35.960.000 2.996.667 179.800.000 Spirit 835.200 2.088.000 174.000 2.610.000 300.799.600 Growth 2,91% 3 ALCOHOL CONSUMPTION Population data (refer to the population 15 years and older and are in liters of pure alcohol). 4 ENLARGEMENT OF RECORDED ADULT (15+) PER CAPITA CONSUMPTION Togo 7
- 8. 5 ADULT (15+) PER CAPITA CONSUMPTION, AVERAGE (IN LITRES OF PURE ALCOHOL): Recorded 1 Unrecorded 1 Total 2 WHO African Region 6,2 6 ROBUST ESTIMATE OF FIVE-YEAR CHANGE IN RECORDED ADULT (15+) PER CAPITA CONSUMPTION: Increase Stable Decrease Inconclusive 7 HEALTH CONSEQUENCES Prevalence estimates (12-month prevalence for 2004): Males Females Alcohol use disorders (15+ years) 0,60% 0.07% 8 PATTERNS OF DRINKING ABSTAINERS (15+ years), 2003 Males Females Total Lifetime abstainers 33.3% 50.9% 42.2% Former drinkers 16.1% 22.8% 19.5% Abstainers* 49.4% 73.7% 61.7% * Persons who did not drink in the past 12 months. 9 DRINKERS ONLY Adult (15+ years) per capita consumption*, total NA Adult (15+ years) per capita consumption*, males NA Adult (15+ years) per capita consumption*, females NA Heavy episodic drinkers** (15–85+ years), males, 2003 NA Heavy episodic drinkers** (15–85+ years), females, 2003 NA * (Recorded + unrecorded) in liters of pure alcohol, average 2003–2005. ** Had at least 60 grams or more of pure alcohol on at least one occasion weekly. 10 PATTERNS OF DRINKING SCORE Least risky 1 2 3 4 5 Most risky 1 2 3 4 5 Patterns of drinking score* * Given the same level of consumption, the higher the patterns of drinking score, the greater the alcohol-attributable burden of disease for the country. 11 ALCOHOL POLICY Beer Wine Spirits Excise tax on YES YES YES National legal minimum age for off-premise sales of alcoholic beverages (serving) NO NO NO National legal minimum age for on-premise sales of alcoholic beverages (serving) NO NO NO Specific Events Intoxicated Persons Petrol Stations Restrictions for on-/off-premise sales of alcoholic beverages NO NO NO General Young Professional National maximum legal blood alcohol concentration (BAC) when driving a vehicle NO NO NO Legally binding regulations on alcohol advertising Legally binding regulations on alcohol product placement Legally binding regulations on alcohol sponsorship Legally binding regulations on alcohol sales promotion Legally binding regulations onTime (hours and days) Legally binding regulations on Location (places and density) NO NO NO NO NO Alcohol Policy NO Togo 8
- 9. BENIN 1 SOCIOECONOMIC CONTEXT Total population: Population 15+ years: Population in urban areas: Income group: Consumption in in pure alcohol (1000 Liters): 2 RECORDED ADULT (15+) ALCOHOL CONSUMPTION BY TYPE OF ALCOHOLIC BEVERAGE (IN % OF PURE ALCOHOL) Other 28,00% Beer 45,00% Wine 13,00% Spirit 14,00% Market Valuation 2012 Lt. pure alcohol In bottles In cartons In USD Other 5.712.630 - - 2.856.315 Beer 9.181.013 183.620.250 7.650.844 183.620.250 Wine 2.652.293 22.102.438 1.841.870 110.512.188 Spirit 2.856.315 7.140.788 595.066 8.925.984 305.914.737 Low Income Low Income 20.402 20.018 2012 2011 56% 56% 40% 40% 9.273.750 9.099.000 28,00% 45,00% 13,00% 14,00% Other Beer Wine Spirit Beer includes malt beers. Wine includes wine made from grapes. Spirits include all distilled beverages. Other includes one or several other alcoholic beverages, such as fermented beverages made from sorghum, maize, millet, rice, or cider, fruit wine, fortified wine, etc. Market Valuation 2011 Lt. pure alcohol In bottles In cartons In USD Other 5.604.984 - - 2.802.492 Beer 9.008.010 180.160.200 7.506.675 180.160.200 Wine 2.602.314 21.685.950 1.807.163 108.429.750 Spirit 2.802.492 7.006.230 583.853 8.757.788 300.150.230 Growth 1,92% 3 ALCOHOL CONSUMPTION Population data (refer to the population 15 years and older and are in liters of pure alcohol). 4 ENLARGEMENT OF RECORDED ADULT (15+) PER CAPITA CONSUMPTION Benin 9
- 10. 5 ADULT (15+) PER CAPITA CONSUMPTION, AVERAGE (IN LITRES OF PURE ALCOHOL): Recorded 1,2 Unrecorded 1 Total 2,2 WHO African Region 6,2 6 ROBUST ESTIMATE OF FIVE-YEAR CHANGE IN RECORDED ADULT (15+) PER CAPITA CONSUMPTION: Increase Stable Decrease Inconclusive 7 HEALTH CONSEQUENCES Prevalence estimates (12-month prevalence for 2004): Males Females Alcohol use disorders (15+ years) 0,66% 0,07 8 PATTERNS OF DRINKING ABSTAINERS (15+ years), 2003 Males Females Total Lifetime abstainers 17% 30,60% 23,80% Former drinkers 14,50% 20,80% 17,70% Abstainers* 31,50% 51,40% 41,50% * Persons who did not drink in the past 12 months. 9 DRINKERS ONLY Adult (15+ years) per capita consumption*, total 3,67 Adult (15+ years) per capita consumption*, males 4,18 Adult (15+ years) per capita consumption*, females 2,7 Heavy episodic drinkers** (15–85+ years), males, 2003 6,70% Heavy episodic drinkers** (15–85+ years), females, 2003 1,60% * (Recorded + unrecorded) in liters of pure alcohol, average 2003–2005. ** Had at least 60 grams or more of pure alcohol on at least one occasion weekly. 10 PATTERNS OF DRINKING SCORE Least risky 1 2 3 4 5 Most risky 1 2 3 4 5 Patterns of drinking score* * Given the same level of consumption, the higher the patterns of drinking score, the greater the alcohol-attributable burden of disease for the country. 11 ALCOHOL POLICY Beer Wine Spirits Excise tax on YES YES YES National legal minimum age for off-premise sales of alcoholic beverages (serving) NO NO NO National legal minimum age for on-premise sales of alcoholic beverages (serving) NO NO NO Specific Events Intoxicated Persons Petrol Stations Restrictions for on-/off-premise sales of alcoholic beverages NO NO NO General Young Professional National maximum legal blood alcohol concentration (BAC) when driving a vehicle 0,05% 0,05% 0,05% Legally binding regulations on alcohol advertising Legally binding regulations on alcohol product placement Legally binding regulations on alcohol sponsorship Legally binding regulations on alcohol sales promotion Legally binding regulations onTime (hours and days) Legally binding regulations on Location (places and density) NO NO NO NO NO Alcohol Policy NO Benin 10
- 11. BURKINA FASO 1 SOCIOECONOMIC CONTEXT Total population: Population 15+ years: Population in urban areas: Income group: Consumption in in pure alcohol (1000 Liters): 2 RECORDED ADULT (15+) ALCOHOL CONSUMPTION BY TYPE OF ALCOHOLIC BEVERAGE (IN % OF PURE ALCOHOL) Other 80,00% Beer 9,00% Wine 2,00% Spirit 9,00% Market Valuation 2012 Lt. pure alcohol In bottles In cartons In USD Other 99.330.000 - - 49.665.000 Beer 11.174.625 223.492.500 9.312.188 223.492.500 Wine 2.483.250 20.693.750 1.724.479 103.468.750 Spirit 11.174.625 27.936.563 2.328.047 34.920.703 411.546.953 2012 2011 17.737.500 16.970.000 54% 54% 19% 19% Low Income Low Income 124.163 118.790 80,00% 9,00% 2,00% 9,00% Other Beer Wine Spirit Beer includes malt beers. Wine includes wine made from grapes. Spirits include all distilled beverages. Other includes one or several other alcoholic beverages, such as fermented beverages made from sorghum, maize, millet, rice, or cider, fruit wine, fortified wine, etc. Market Valuation 2011 Lt. pure alcohol In bottles In cartons In USD Other 95.032.000 - - 47.516.000 Beer 10.691.100 213.822.000 8.909.250 213.822.000 Wine 2.375.800 19.798.333 1.649.861 98.991.667 Spirit 10.691.100 26.727.750 2.227.313 33.409.688 393.739.354 Growth 4,52% 3 ALCOHOL CONSUMPTION Population data (refer to the population 15 years and older and are in liters of pure alcohol). 4 ENLARGEMENT OF RECORDED ADULT (15+) PER CAPITA CONSUMPTION Burkina Faso 11
- 12. 5 ADULT (15+) PER CAPITA CONSUMPTION, AVERAGE (IN LITRES OF PURE ALCOHOL): Recorded 4,5 Unrecorded 2,5 Total 7,0 WHO African Region 6,2 6 ROBUST ESTIMATE OF FIVE-YEAR CHANGE IN RECORDED ADULT (15+) PER CAPITA CONSUMPTION: Increase Stable Decrease Inconclusive 7 HEALTH CONSEQUENCES Prevalence estimates (12-month prevalence for 2004): Males Females Alcohol use disorders (15+ years) 1,90% 0,21% 8 PATTERNS OF DRINKING ABSTAINERS (15+ years), 2003 Males Females Total Lifetime abstainers 63% 64,80% 64,10% Former drinkers 12,00% 12,00% 12,00% Abstainers* 75,40% 76,80% 76,10% * Persons who did not drink in the past 12 months. 9 DRINKERS ONLY Adult (15+ years) per capita consumption*, total 29,24 Adult (15+ years) per capita consumption*, males 39,7 Adult (15+ years) per capita consumption*, females 18,81 Heavy episodic drinkers** (15–85+ years), males, 2003 49,90% Heavy episodic drinkers** (15–85+ years), females, 2003 36,80% * (Recorded + unrecorded) in liters of pure alcohol, average 2003–2005. ** Had at least 60 grams or more of pure alcohol on at least one occasion weekly. 10 PATTERNS OF DRINKING SCORE Least risky 1 2 3 4 5 Most risky 1 2 3 4 5 Patterns of drinking score* * Given the same level of consumption, the higher the patterns of drinking score, the greater the alcohol-attributable burden of disease for the country. 11 ALCOHOL POLICY Beer Wine Spirits Excise tax on YES YES YES National legal minimum age for off-premise sales of alcoholic beverages (serving) 18 18 18 National legal minimum age for on-premise sales of alcoholic beverages (serving) 18 18 18 Specific Events Intoxicated Persons Petrol Stations Restrictions for on-/off-premise sales of alcoholic beverages YES YES YES General Young Professional National maximum legal blood alcohol concentration (BAC) when driving a vehicle NO NO NO Legally binding regulations on alcohol advertising Legally binding regulations on alcohol product placement Legally binding regulations on alcohol sponsorship Legally binding regulations on alcohol sales promotion Legally binding regulations onTime (hours and days) Legally binding regulations on Location (places and density) YES Alcohol Policy YES YES NO NO YES/NO Burkina Faso 12
- 13. COTE D'IVOIRE 1 SOCIOECONOMIC CONTEXT Total population: Population 15+ years: Population in urban areas: Income group: Consumption in in pure alcohol (1000 Liters): 2 RECORDED ADULT (15+) ALCOHOL CONSUMPTION BY TYPE OF ALCOHOLIC BEVERAGE (IN % OF PURE ALCOHOL) Other 78,00% Beer 14,00% Wine 7,00% Spirit 1,00% Market Valuation 2012 Lt. pure alcohol In bottles In cartons In USD Other 104.644.800 - - 52.322.400 Beer 18.782.400 375.648.000 15.652.000 375.648.000 Wine 9.391.200 78.260.000 6.521.667 391.300.000 Spirit 1.341.600 3.354.000 279.500 4.192.500 823.462.900 2012 2011 20.640.000 20.152.000 59% 59% 45% 45% Low Income Low Income 134.160 130.988 78,00% 14,00% 7,00% 1,00% Other Beer Wine Spirit Beer includes malt beers. Wine includes wine made from grapes. Spirits include all distilled beverages. Other includes one or several other alcoholic beverages, such as fermented beverages made from sorghum, maize, millet, rice, or cider, fruit wine, fortified wine, etc. Market Valuation 2011 Lt. pure alcohol In bottles In cartons In USD Other 102.170.640 - - 51.085.320 Beer 18.338.320 366.766.400 15.281.933 366.766.400 Wine 9.169.160 76.409.667 6.367.472 382.048.333 Spirit 1.309.880 3.274.700 272.892 4.093.375 803.993.428 Growth 2,42% 3 ALCOHOL CONSUMPTION Population data (refer to the population 15 years and older and are in liters of pure alcohol). 4 ENLARGEMENT OF RECORDED ADULT (15+) PER CAPITA CONSUMPTION Cote D'Ivoire 13
- 14. 5 ADULT (15+) PER CAPITA CONSUMPTION, AVERAGE (IN LITRES OF PURE ALCOHOL): Recorded 4,5 Unrecorded 2 Total 6,5 WHO African Region 6,2 6 ROBUST ESTIMATE OF FIVE-YEAR CHANGE IN RECORDED ADULT (15+) PER CAPITA CONSUMPTION: Increase Stable Decrease Inconclusive 7 HEALTH CONSEQUENCES Prevalence estimates (12-month prevalence for 2004): Males Females Alcohol use disorders (15+ years) 0,80% 0,08% 8 PATTERNS OF DRINKING ABSTAINERS (15+ years), 2003 Males Females Total Lifetime abstainers 52% 73,00% 62,20% Former drinkers 13,30% 14,80% 14,10% Abstainers* 65,30% 87,80% 76,30% * Persons who did not drink in the past 12 months. 9 DRINKERS ONLY Adult (15+ years) per capita consumption*, total 27,29 Adult (15+ years) per capita consumption*, males 31 Adult (15+ years) per capita consumption*, females 16,49 Heavy episodic drinkers** (15–85+ years), males, 2003 24,90% Heavy episodic drinkers** (15–85+ years), females, 2003 6,90% * (Recorded + unrecorded) in liters of pure alcohol, average 2003–2005. ** Had at least 60 grams or more of pure alcohol on at least one occasion weekly. 10 PATTERNS OF DRINKING SCORE Least risky 1 2 3 4 5 Most risky 1 2 3 4 5 Patterns of drinking score* * Given the same level of consumption, the higher the patterns of drinking score, the greater the alcohol-attributable burden of disease for the country. 11 ALCOHOL POLICY Beer Wine Spirits Excise tax on YES YES YES National legal minimum age for off-premise sales of alcoholic beverages (serving) 18 18 18 National legal minimum age for on-premise sales of alcoholic beverages (serving) 18 18 18 Specific Events Intoxicated Persons Petrol Stations Restrictions for on-/off-premise sales of alcoholic beverages YES YES NO General Young Professional National maximum legal blood alcohol concentration (BAC) when driving a vehicle 0,08% 0,08% 0,08% Legally binding regulations on alcohol advertising Legally binding regulations on alcohol product placement Legally binding regulations on alcohol sponsorship Legally binding regulations on alcohol sales promotion Legally binding regulations onTime (hours and days) Legally binding regulations on Location (places and density) NO Alcohol Policy YES YES NO NO NO Cote D'Ivoire 14
- 15. GUINEA 1 SOCIOECONOMIC CONTEXT Total population: Population 15+ years: Population in urban areas: Income group: Consumption in in pure alcohol (1000 Liters): 2 RECORDED ADULT (15+) ALCOHOL CONSUMPTION BY TYPE OF ALCOHOLIC BEVERAGE (IN % OF PURE ALCOHOL) Other 0,00% Beer 77,00% Wine 9,00% Spirit 14,00% Market Valuation 2012 Lt. pure alcohol In bottles In cartons In USD Other - - - - Beer 6.407.170 128.143.400 5.339.308 128.143.400 Wine 748.890 6.240.750 520.063 31.203.750 Spirit 1.164.940 2.912.350 242.696 3.640.438 162.987.588 2012 2011 10.401.250 10.221.000 57% 57% 33% 33% Low Income Low Income 8.321 8.177 77,00% 9,00% 14,00% Other Beer Wine Spirit Beer includes malt beers. Wine includes wine made from grapes. Spirits include all distilled beverages. Other includes one or several other alcoholic beverages, such as fermented beverages made from sorghum, maize, millet, rice, or cider, fruit wine, fortified wine, etc. Market Valuation 2011 Lt. pure alcohol In bottles In cartons In USD Other - - - - Beer 6.296.136 125.922.720 5.246.780 125.922.720 Wine 735.912 6.132.600 511.050 30.663.000 Spirit 1.144.752 2.861.880 238.490 3.577.350 160.163.070 Growth 1,76% 3 ALCOHOL CONSUMPTION Population data (refer to the population 15 years and older and are in liters of pure alcohol). 4 ENLARGEMENT OF RECORDED ADULT (15+) PER CAPITA CONSUMPTION Guinea 15
- 16. 5 ADULT (15+) PER CAPITA CONSUMPTION, AVERAGE (IN LITRES OF PURE ALCOHOL): Recorded 0,3 Unrecorded 0,5 Total 0,8 WHO African Region 6,2 6 ROBUST ESTIMATE OF FIVE-YEAR CHANGE IN RECORDED ADULT (15+) PER CAPITA CONSUMPTION: Increase Stable Decrease Inconclusive 7 HEALTH CONSEQUENCES Prevalence estimates (12-month prevalence for 2004): Males Females Alcohol use disorders (15+ years) 0,16% 0,02% 8 PATTERNS OF DRINKING ABSTAINERS (15+ years), 2003 Males Females Total Lifetime abstainers NA NA NA Former drinkers NA NA NA Abstainers* NA NA NA * Persons who did not drink in the past 12 months. 9 DRINKERS ONLY Adult (15+ years) per capita consumption*, total NA Adult (15+ years) per capita consumption*, males NA Adult (15+ years) per capita consumption*, females NA Heavy episodic drinkers** (15–85+ years), males, 2003 NA Heavy episodic drinkers** (15–85+ years), females, 2003 NA * (Recorded + unrecorded) in liters of pure alcohol, average 2003–2005. ** Had at least 60 grams or more of pure alcohol on at least one occasion weekly. 10 PATTERNS OF DRINKING SCORE Least risky 1 2 3 4 5 Most risky 1 2 3 4 5 Patterns of drinking score* * Given the same level of consumption, the higher the patterns of drinking score, the greater the alcohol-attributable burden of disease for the country. 11 ALCOHOL POLICY Beer Wine Spirits Excise tax on YES YES YES National legal minimum age for off-premise sales of alcoholic beverages (serving) 18 18 18 National legal minimum age for on-premise sales of alcoholic beverages (serving) 18 18 18 Specific Events Intoxicated Persons Petrol Stations Restrictions for on-/off-premise sales of alcoholic beverages YES YES NO General Young Professional National maximum legal blood alcohol concentration (BAC) when driving a vehicle 0,08% 0,08% 0,08% Legally binding regulations on alcohol advertising Legally binding regulations on alcohol product placement Legally binding regulations on alcohol sponsorship Legally binding regulations on alcohol sales promotion Legally binding regulations onTime (hours and days) Legally binding regulations on Location (places and density) NO Alcohol Policy YES YES NO NO NO Guinea 16
- 17. GAMBIA (THE) 1 SOCIOECONOMIC CONTEXT Total population: Population 15+ years: Population in urban areas: Income group: Consumption in in pure alcohol (1000 Liters): 2 RECORDED ADULT (15+) ALCOHOL CONSUMPTION BY TYPE OF ALCOHOLIC BEVERAGE (IN % OF PURE ALCOHOL) Other 0,00% Beer 77,00% Wine 9,00% Spirit 14,00% Market Valuation 2012 Lt. pure alcohol In bottles In cartons In USD Other - - - - Beer 4.764.760 95.295.200 3.970.633 95.295.200 Wine 556.920 4.641.000 386.750 23.205.000 Spirit 866.320 2.165.800 180.483 2.707.250 121.207.450 2012 2011 1.820.000 1.776.000 59% 57% 55% 33% Low Income Low Income 6.188 6.038 77,00% 9,00% 14,00% Other Beer Wine Spirit Beer includes malt beers. Wine includes wine made from grapes. Spirits include all distilled beverages. Other includes one or several other alcoholic beverages, such as fermented beverages made from sorghum, maize, millet, rice, or cider, fruit wine, fortified wine, etc. Market Valuation 2011 Lt. pure alcohol In bottles In cartons In USD Other - - - - Beer 4.649.568 92.991.360 3.874.640 92.991.360 Wine 543.456 4.528.800 377.400 22.644.000 Spirit 845.376 2.113.440 176.120 2.641.800 118.277.160 Growth 2,48% 3 ALCOHOL CONSUMPTION Population data (refer to the population 15 years and older and are in liters of pure alcohol). 4 ENLARGEMENT OF RECORDED ADULT (15+) PER CAPITA CONSUMPTION The Gambia 17
- 18. 5 ADULT (15+) PER CAPITA CONSUMPTION, AVERAGE (IN LITRES OF PURE ALCOHOL): Recorded 2,4 Unrecorded 1 Total 3,4 WHO African Region 6,2 6 ROBUST ESTIMATE OF FIVE-YEAR CHANGE IN RECORDED ADULT (15+) PER CAPITA CONSUMPTION: Increase Stable Decrease Inconclusive 7 HEALTH CONSEQUENCES Prevalence estimates (12-month prevalence for 2004): Males Females Alcohol use disorders (15+ years) 1,03% 0,12% 8 PATTERNS OF DRINKING ABSTAINERS (15+ years), 2003 Males Females Total Lifetime abstainers NA NA NA Former drinkers NA NA NA Abstainers* NA NA NA * Persons who did not drink in the past 12 months. 9 DRINKERS ONLY Adult (15+ years) per capita consumption*, total NA Adult (15+ years) per capita consumption*, males NA Adult (15+ years) per capita consumption*, females NA Heavy episodic drinkers** (15–85+ years), males, 2003 NA Heavy episodic drinkers** (15–85+ years), females, 2003 NA * (Recorded + unrecorded) in liters of pure alcohol, average 2003–2005. ** Had at least 60 grams or more of pure alcohol on at least one occasion weekly. 10 PATTERNS OF DRINKING SCORE Least risky 1 2 3 4 5 Most risky 1 2 3 4 5 Patterns of drinking score* * Given the same level of consumption, the higher the patterns of drinking score, the greater the alcohol-attributable burden of disease for the country. 11 ALCOHOL POLICY Beer Wine Spirits Excise tax on YES YES YES National legal minimum age for off-premise sales of alcoholic beverages (serving) 18 18 18 National legal minimum age for on-premise sales of alcoholic beverages (serving) 18 18 18 Specific Events Intoxicated Persons Petrol Stations Restrictions for on-/off-premise sales of alcoholic beverages YES NO NO General Young Professional National maximum legal blood alcohol concentration (BAC) when driving a vehicle NA NA NA Legally binding regulations on alcohol advertising Legally binding regulations on alcohol product placement Legally binding regulations on alcohol sponsorship Legally binding regulations on alcohol sales promotion Legally binding regulations onTime (hours and days) Legally binding regulations on Location (places and density) NO Alcohol Policy YES YES YES YES YES/NO The Gambia 18
- 19. LIBERIA 1 SOCIOECONOMIC CONTEXT Total population: Population 15+ years: Population in urban areas: Income group: Consumption in in pure alcohol (1000 Liters): 2 RECORDED ADULT (15+) ALCOHOL CONSUMPTION BY TYPE OF ALCOHOLIC BEVERAGE (IN % OF PURE ALCOHOL) Other 0,0% Beer 9,0% Wine 1,0% Spirit 90,0% Market Valuation 2012 Lt. pure alcohol In bottles In cartons In USD Other - - - - Beer 1.989.765 39.795.300 1.658.138 39.795.300 Wine 221.085 1.842.375 153.531 9.211.875 Spirit 19.897.650 49.744.125 4.145.344 62.180.156 111.187.331 2012 2011 4.335.000 4.128.000 53% 53% 59% 59% Low Income Low Income 22.109 21.053 0,00% 9,00% 1,00% 90,00% Other Beer Wine Spirit Beer includes malt beers. Wine includes wine made from grapes. Spirits include all distilled beverages. Other includes one or several other alcoholic beverages, such as fermented beverages made from sorghum, maize, millet, rice, or cider, fruit wine, fortified wine, etc. Market Valuation 2011 Lt. pure alcohol In bottles In cartons In USD Other - - - - Beer 1.894.752 37.895.040 1.578.960 37.895.040 Wine 210.528 1.754.400 146.200 8.772.000 Spirit 18.947.520 47.368.800 3.947.400 59.211.000 105.878.040 Growth 5,01% 3 ALCOHOL CONSUMPTION Population data (refer to the population 15 years and older and are in liters of pure alcohol). 4 ENLARGEMENT OF RECORDED ADULT (15+) PER CAPITA CONSUMPTION Liberia 19
- 20. 5 ADULT (15+) PER CAPITA CONSUMPTION, AVERAGE (IN LITRES OF PURE ALCOHOL): Recorded 3,5 Unrecorded 1,6 Total 5,1 WHO African Region 6,2 6 ROBUST ESTIMATE OF FIVE-YEAR CHANGE IN RECORDED ADULT (15+) PER CAPITA CONSUMPTION: Increase Stable Decrease Inconclusive 7 HEALTH CONSEQUENCES Prevalence estimates (12-month prevalence for 2004): Males Females Alcohol use disorders (15+ years) 1,42% 0,16% 8 PATTERNS OF DRINKING ABSTAINERS (15+ years), 2003 Males Females Total Lifetime abstainers NA NA NA Former drinkers NA NA NA Abstainers* NA NA NA * Persons who did not drink in the past 12 months. 9 DRINKERS ONLY Adult (15+ years) per capita consumption*, total NA Adult (15+ years) per capita consumption*, males NA Adult (15+ years) per capita consumption*, females NA Heavy episodic drinkers** (15–85+ years), males, 2003 NA Heavy episodic drinkers** (15–85+ years), females, 2003 NA * (Recorded + unrecorded) in liters of pure alcohol, average 2003–2005. ** Had at least 60 grams or more of pure alcohol on at least one occasion weekly. 10 PATTERNS OF DRINKING SCORE Least risky 1 2 3 4 5 Most risky 1 2 3 4 5 Patterns of drinking score* * Given the same level of consumption, the higher the patterns of drinking score, the greater the alcohol-attributable burden of disease for the country. 11 ALCOHOL POLICY Beer Wine Spirits Excise tax on YES YES YES National legal minimum age for off-premise sales of alcoholic beverages (serving) NO NO NO National legal minimum age for on-premise sales of alcoholic beverages (serving) 18 18 18 Specific Events Intoxicated Persons Petrol Stations Restrictions for on-/off-premise sales of alcoholic beverages NO NO NO General Young Professional National maximum legal blood alcohol concentration (BAC) when driving a vehicle 0,05% 0,05% 0,05% Legally binding regulations on alcohol advertising Legally binding regulations on alcohol product placement Legally binding regulations on alcohol sponsorship Legally binding regulations on alcohol sales promotion Legally binding regulations onTime (hours and days) Legally binding regulations on Location (places and density) YES/NO Alcohol Policy NO NO NO NO NO Liberia 20
- 21. MALI 1 SOCIOECONOMIC CONTEXT Total population: Population 15+ years: Population in urban areas: Income group: Consumption in in pure alcohol (1000 Liters): 2 RECORDED ADULT (15+) ALCOHOL CONSUMPTION BY TYPE OF ALCOHOLIC BEVERAGE (IN % OF PURE ALCOHOL) Other 84,00% Beer 13,00% Wine 1,00% Spirit 2,00% Market Valuation 2012 Lt. pure alcohol In bottles In cartons In USD Other 13.795.950 - - 6.897.975 Beer 2.135.088 42.701.750 1.779.240 42.701.750 Wine 164.238 1.368.646 114.054 6.843.229 Spirit 328.475 821.188 68.432 1.026.484 57.469.439 31% 31% Low Income Low Income 16.424 15.839 2012 2011 16.423.750 15.839.000 52% 52% 84,00% 13,00% 1,00% 2,00% Other Beer Wine Spirit Beer includes malt beers. Wine includes wine made from grapes. Spirits include all distilled beverages. Other includes one or several other alcoholic beverages, such as fermented beverages made from sorghum, maize, millet, rice, or cider, fruit wine, fortified wine, etc. Market Valuation 2011 Lt. pure alcohol In bottles In cartons In USD Other 13.304.760 - - 6.652.380 Beer 2.059.070 41.181.400 1.715.892 41.181.400 Wine 158.390 1.319.917 109.993 6.599.583 Spirit 316.780 791.950 65.996 989.938 55.423.301 Growth 3,69% 3 ALCOHOL CONSUMPTION Population data (refer to the population 15 years and older and are in liters of pure alcohol). 4 ENLARGEMENT OF RECORDED ADULT (15+) PER CAPITA CONSUMPTION Mali 21
- 22. 5 ADULT (15+) PER CAPITA CONSUMPTION, AVERAGE (IN LITRES OF PURE ALCOHOL): Recorded 0,5 Unrecorded 0,5 Total 1,0 WHO African Region 6,2 6 ROBUST ESTIMATE OF FIVE-YEAR CHANGE IN RECORDED ADULT (15+) PER CAPITA CONSUMPTION: Increase Stable Decrease Inconclusive 7 HEALTH CONSEQUENCES Prevalence estimates (12-month prevalence for 2004): Males Females Alcohol use disorders (15+ years) 0,28% 0,03% 8 PATTERNS OF DRINKING ABSTAINERS (15+ years), 2003 Males Females Total Lifetime abstainers 94.8% 96.8% 95.9% Former drinkers 1.7% 1,00% 1.3% Abstainers* 96.5% 97.8% 97.2% * Persons who did not drink in the past 12 months. 9 DRINKERS ONLY Adult (15+ years) per capita consumption*, total 36.87 Adult (15+ years) per capita consumption*, males 62.14 Adult (15+ years) per capita consumption*, females 1.76 Heavy episodic drinkers** (15–85+ years), males, 2003 10.4% Heavy episodic drinkers** (15–85+ years), females, 2003 8.9% * (Recorded + unrecorded) in liters of pure alcohol, average 2003–2005. ** Had at least 60 grams or more of pure alcohol on at least one occasion weekly. 10 PATTERNS OF DRINKING SCORE Least risky 1 2 3 4 5 Most risky 1 2 3 4 5 Patterns of drinking score* * Given the same level of consumption, the higher the patterns of drinking score, the greater the alcohol-attributable burden of disease for the country. 11 ALCOHOL POLICY Beer Wine Spirits Excise tax on YES YES YES National legal minimum age for off-premise sales of alcoholic beverages (serving) NO NO NO National legal minimum age for on-premise sales of alcoholic beverages (serving) NO NO NO Specific Events Intoxicated Persons Petrol Stations Restrictions for on-/off-premise sales of alcoholic beverages NO NO NO General Young Professional National maximum legal blood alcohol concentration (BAC) when driving a vehicle NO NO NO Legally binding regulations on alcohol advertising Legally binding regulations on alcohol product placement Legally binding regulations on alcohol sponsorship Legally binding regulations on alcohol sales promotion Legally binding regulations onTime (hours and days) Legally binding regulations on Location (places and density) NO Alcohol Policy NO NO NO NO NO Mali 22
- 23. MAURITANIA 1 SOCIOECONOMIC CONTEXT Total population: Population 15+ years: Population in urban areas: Income group: Consumption in in pure alcohol (1000 Liters): 2 RECORDED ADULT (15+) ALCOHOL CONSUMPTION BY TYPE OF ALCOHOLIC BEVERAGE (IN % OF PURE ALCOHOL) Other 0,00% Beer 0,00% Wine 0,00% Spirit 100,00% Market Valuation 2012 Lt. pure alcohol In bottles In cartons In USD Other - - - - Beer - - - - Wine - - - - Spirit 1.642.375 4.105.938 342.161 5.132.422 5.132.422 41% 41% Low Income Low Income 1.642 1.584 2012 2011 16.423.750 15.839.000 60% 60% 0,00% 0,00% 0,00% 100,00% Other Beer Wine Spirit Beer includes malt beers. Wine includes wine made from grapes. Spirits include all distilled beverages. Other includes one or several other alcoholic beverages, such as fermented beverages made from sorghum, maize, millet, rice, or cider, fruit wine, fortified wine, etc. Market Valuation 2011 Lt. pure alcohol In bottles In cartons In USD Other - - - - Beer - - - - Wine - - - - Spirit 1.583.900 3.959.750 329.979 4.949.688 4.949.688 Growth 3,69% 3 ALCOHOL CONSUMPTION Population data (refer to the population 15 years and older and are in liters of pure alcohol). 4 ENLARGEMENT OF RECORDED ADULT (15+) PER CAPITA CONSUMPTION Mauritania 23
- 24. 5 ADULT (15+) PER CAPITA CONSUMPTION, AVERAGE (IN LITRES OF PURE ALCOHOL): Recorded 0 Unrecorded 0,1 Total 0,1 WHO African Region 6,2 6 ROBUST ESTIMATE OF FIVE-YEAR CHANGE IN RECORDED ADULT (15+) PER CAPITA CONSUMPTION: Increase Stable Decrease Inconclusive 7 HEALTH CONSEQUENCES Prevalence estimates (12-month prevalence for 2004): Males Females Alcohol use disorders (15+ years) 0,02% 0,00% 8 PATTERNS OF DRINKING ABSTAINERS (15+ years), 2003 Males Females Total Lifetime abstainers 97.1% 97.8% 97.5% Former drinkers 1.4% 1.4% 1.3% Abstainers* 98.5% 99.2% 98.8% * Persons who did not drink in the past 12 months. 9 DRINKERS ONLY Adult (15+ years) per capita consumption*, total 9.17 Adult (15+ years) per capita consumption*, males 12.88 Adult (15+ years) per capita consumption*, females 2.61 Heavy episodic drinkers** (15–85+ years), males, 2003 0,00% Heavy episodic drinkers** (15–85+ years), females, 2003 0,00% * (Recorded + unrecorded) in liters of pure alcohol, average 2003–2005. ** Had at least 60 grams or more of pure alcohol on at least one occasion weekly. 10 PATTERNS OF DRINKING SCORE Least risky 1 2 3 4 5 Most risky 1 2 3 4 5 Patterns of drinking score* * Given the same level of consumption, the higher the patterns of drinking score, the greater the alcohol-attributable burden of disease for the country. 11 ALCOHOL POLICY Beer Wine Spirits Excise tax on TOTAL BAN TOTAL BAN TOTAL BAN National legal minimum age for off-premise sales of alcoholic beverages (serving) TOTAL BAN TOTAL BAN TOTAL BAN National legal minimum age for on-premise sales of alcoholic beverages (serving) TOTAL BAN TOTAL BAN TOTAL BAN Specific Events Intoxicated Persons Petrol Stations Restrictions for on-/off-premise sales of alcoholic beverages TOTAL BAN TOTAL BAN TOTAL BAN General Young Professional National maximum legal blood alcohol concentration (BAC) when driving a vehicle TOTAL BAN TOTAL BAN TOTAL BAN Legally binding regulations on alcohol advertising Legally binding regulations on alcohol product placement Legally binding regulations on alcohol sponsorship Legally binding regulations on alcohol sales promotion Legally binding regulations onTime (hours and days) Legally binding regulations on Location (places and density) TOTAL BAN Alcohol Policy TOTAL BAN TOTAL BAN TOTAL BAN TOTAL BAN TOTAL BAN Mauritania 24
- 25. SENEGAL 1 SOCIOECONOMIC CONTEXT Total population: Population 15+ years: Population in urban areas: Income group: Consumption in in pure alcohol (1000 Liters): 2 RECORDED ADULT (15+) ALCOHOL CONSUMPTION BY TYPE OF ALCOHOLIC BEVERAGE (IN % OF PURE ALCOHOL) Other 0,00% Beer 54,00% Wine 43,00% Spirit 3,00% Market Valuation 2012 Lt. pure alcohol In bottles In cartons In USD Other - - - - Beer 4.222.935 84.458.700 3.519.113 84.458.700 Wine 3.362.708 28.022.563 2.335.214 140.112.813 Spirit 234.608 586.519 48.877 733.148 225.304.661 42% 42% Low Income Low Income 7.820 7.660 2012 2011 13.033.750 12.767.000 58% 58% 54,00% 43,00% 3,00% Other Beer Wine Spirit Beer includes malt beers. Wine includes wine made from grapes. Spirits include all distilled beverages. Other includes one or several other alcoholic beverages, such as fermented beverages made from sorghum, maize, millet, rice, or cider, fruit wine, fortified wine, etc. Market Valuation 2011 Lt. pure alcohol In bottles In cartons In USD Other - - - - Beer 4.136.508 82.730.160 3.447.090 82.730.160 Wine 3.293.886 27.449.050 2.287.421 137.245.250 Spirit 229.806 574.515 47.876 718.144 220.693.554 Growth 2,09% 3 ALCOHOL CONSUMPTION Population data (refer to the population 15 years and older and are in liters of pure alcohol). 4 ENLARGEMENT OF RECORDED ADULT (15+) PER CAPITA CONSUMPTION Senegal 25
- 26. 5 ADULT (15+) PER CAPITA CONSUMPTION, AVERAGE (IN LITRES OF PURE ALCOHOL): Recorded 0,3 Unrecorded 0,3 Total 0,6 WHO African Region 6,2 6 ROBUST ESTIMATE OF FIVE-YEAR CHANGE IN RECORDED ADULT (15+) PER CAPITA CONSUMPTION: Increase Stable Decrease Inconclusive 7 HEALTH CONSEQUENCES Prevalence estimates (12-month prevalence for 2004): Males Females Alcohol use disorders (15+ years) 0.52% 0.06% 8 PATTERNS OF DRINKING ABSTAINERS (15+ years), 2003 Males Females Total Lifetime abstainers 93.7% 98.3% 96.1% Former drinkers 3,00% 0.9% 1.9% Abstainers* 96.7% 99.2% 98,00% * Persons who did not drink in the past 12 months. 9 DRINKERS ONLY Adult (15+ years) per capita consumption*, total 30 Adult (15+ years) per capita consumption*, males 33.45 Adult (15+ years) per capita consumption*, females 15.27 Heavy episodic drinkers** (15–85+ years), males, 2003 11.3% Heavy episodic drinkers** (15–85+ years), females, 2003 19.3% * (Recorded + unrecorded) in liters of pure alcohol, average 2003–2005. ** Had at least 60 grams or more of pure alcohol on at least one occasion weekly. 10 PATTERNS OF DRINKING SCORE Least risky 1 2 3 4 5 Most risky 1 2 3 4 5 Patterns of drinking score* * Given the same level of consumption, the higher the patterns of drinking score, the greater the alcohol-attributable burden of disease for the country. 11 ALCOHOL POLICY Beer Wine Spirits Excise tax on YES YES YES National legal minimum age for off-premise sales of alcoholic beverages (serving) 18 18 18 National legal minimum age for on-premise sales of alcoholic beverages (serving) 18 18 18 Specific Events Intoxicated Persons Petrol Stations Restrictions for on-/off-premise sales of alcoholic beverages YES YES YES General Young Professional National maximum legal blood alcohol concentration (BAC) when driving a vehicle NO NO NO Legally binding regulations on alcohol advertising Legally binding regulations on alcohol product placement Legally binding regulations on alcohol sponsorship Legally binding regulations on alcohol sales promotion Legally binding regulations onTime (hours and days) Legally binding regulations on Location (places and density) YES/NO Alcohol Policy YES NO NO NO YES/NO Senegal 26
- 27. SIERRA LEON 1 SOCIOECONOMIC CONTEXT Total population: Population 15+ years: Population in urban areas: Income group: Consumption in in pure alcohol (1000 Liters): 2 RECORDED ADULT (15+) ALCOHOL CONSUMPTION BY TYPE OF ALCOHOLIC BEVERAGE (IN % OF PURE ALCOHOL) Other 92,5% Beer 6,5% Wine 0,5% Spirit 0,5% Market Valuation 2012 Lt. pure alcohol In bottles In cartons In USD Other 54.922.916 - - 27.461.458 Beer 3.859.448 77.188.963 3.216.207 77.188.963 Wine 296.881 2.474.005 206.167 12.370.026 Spirit 296.881 742.202 61.850 927.752 117.948.198 41% 41% Low Income Low Income 59.376 58.171 2012 2011 6.121.250 5.997.000 57% 57% 92,50% 6,50% 0,50% 0,50% Other Beer Wine Spirit Beer includes malt beers. Wine includes wine made from grapes. Spirits include all distilled beverages. Other includes one or several other alcoholic beverages, such as fermented beverages made from sorghum, maize, millet, rice, or cider, fruit wine, fortified wine, etc. Market Valuation 2011 Lt. pure alcohol In bottles In cartons In USD Other 53.808.083 - - 26.904.041 Beer 3.781.109 75.622.170 3.150.924 75.622.170 Wine 290.855 2.423.788 201.982 12.118.938 Spirit 290.855 727.136 60.595 908.920 115.554.069 Growth 2,07% 3 ALCOHOL CONSUMPTION Population data (refer to the population 15 years and older and are in liters of pure alcohol). 4 ENLARGEMENT OF RECORDED ADULT (15+) PER CAPITA CONSUMPTION Sierra Leon 27
- 28. 5 ADULT (15+) PER CAPITA CONSUMPTION, AVERAGE (IN LITRES OF PURE ALCOHOL): Recorded 6,7 Unrecorded 3 Total 9,7 WHO African Region 6,2 6 ROBUST ESTIMATE OF FIVE-YEAR CHANGE IN RECORDED ADULT (15+) PER CAPITA CONSUMPTION: Increase Stable Decrease Inconclusive 7 HEALTH CONSEQUENCES Prevalence estimates (12-month prevalence for 2004): Males Females Alcohol use disorders (15+ years) 2.10% 0.24% 8 PATTERNS OF DRINKING ABSTAINERS (15+ years), 2003 Males Females Total Lifetime abstainers 36.2% 46.4% 41.4% Former drinkers 21,00% 18.1% 19.5% Abstainers* 57.2% 64.5% 60.8% * Persons who did not drink in the past 12 months. 9 DRINKERS ONLY Adult (15+ years) per capita consumption*, total 24.86 Adult (15+ years) per capita consumption*, males 31.67 Adult (15+ years) per capita consumption*, females 16.73 Heavy episodic drinkers** (15–85+ years), males, 2003 NA Heavy episodic drinkers** (15–85+ years), females, 2003 NA * (Recorded + unrecorded) in liters of pure alcohol, average 2003–2005. ** Had at least 60 grams or more of pure alcohol on at least one occasion weekly. 10 PATTERNS OF DRINKING SCORE Least risky 1 2 3 4 5 Most risky 1 2 3 4 5 Patterns of drinking score* * Given the same level of consumption, the higher the patterns of drinking score, the greater the alcohol-attributable burden of disease for the country. 11 ALCOHOL POLICY Beer Wine Spirits Excise tax on YES YES YES National legal minimum age for off-premise sales of alcoholic beverages (serving) NO NO NO National legal minimum age for on-premise sales of alcoholic beverages (serving) NO NO NO Specific Events Intoxicated Persons Petrol Stations Restrictions for on-/off-premise sales of alcoholic beverages NO NO NO General Young Professional National maximum legal blood alcohol concentration (BAC) when driving a vehicle 0,08% 0,08% 0,08% Legally binding regulations on alcohol advertising Legally binding regulations on alcohol product placement Legally binding regulations on alcohol sponsorship Legally binding regulations on alcohol sales promotion Legally binding regulations onTime (hours and days) Legally binding regulations on Location (places and density) NO Alcohol Policy NO NO NO NO NO Sierra Leon 28