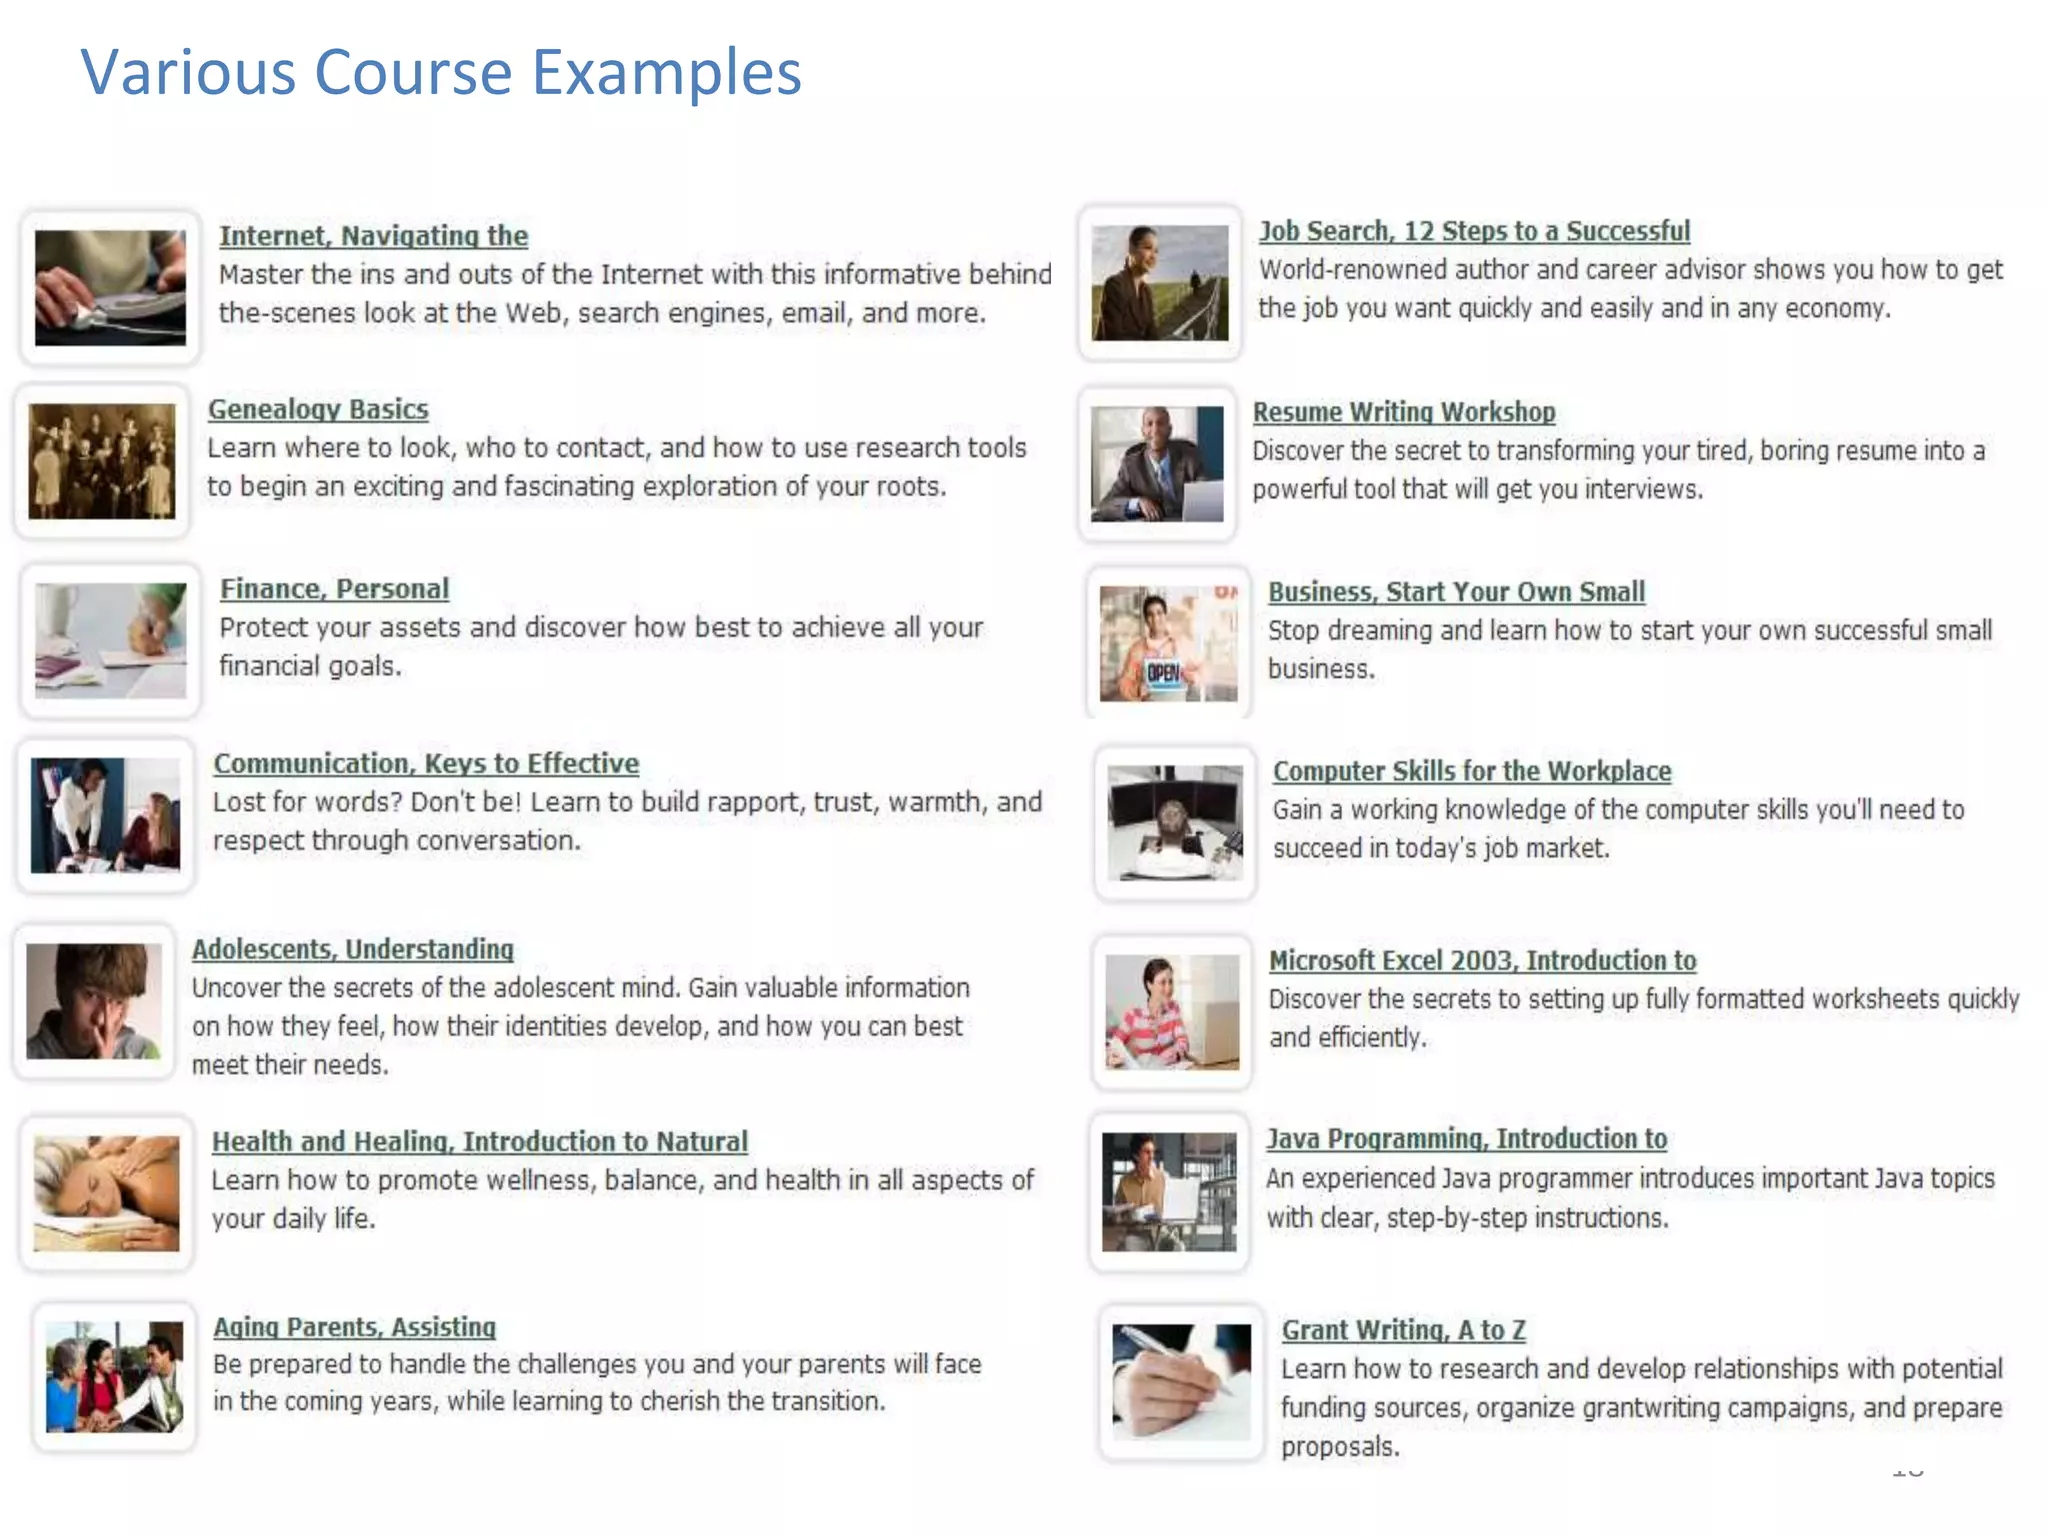
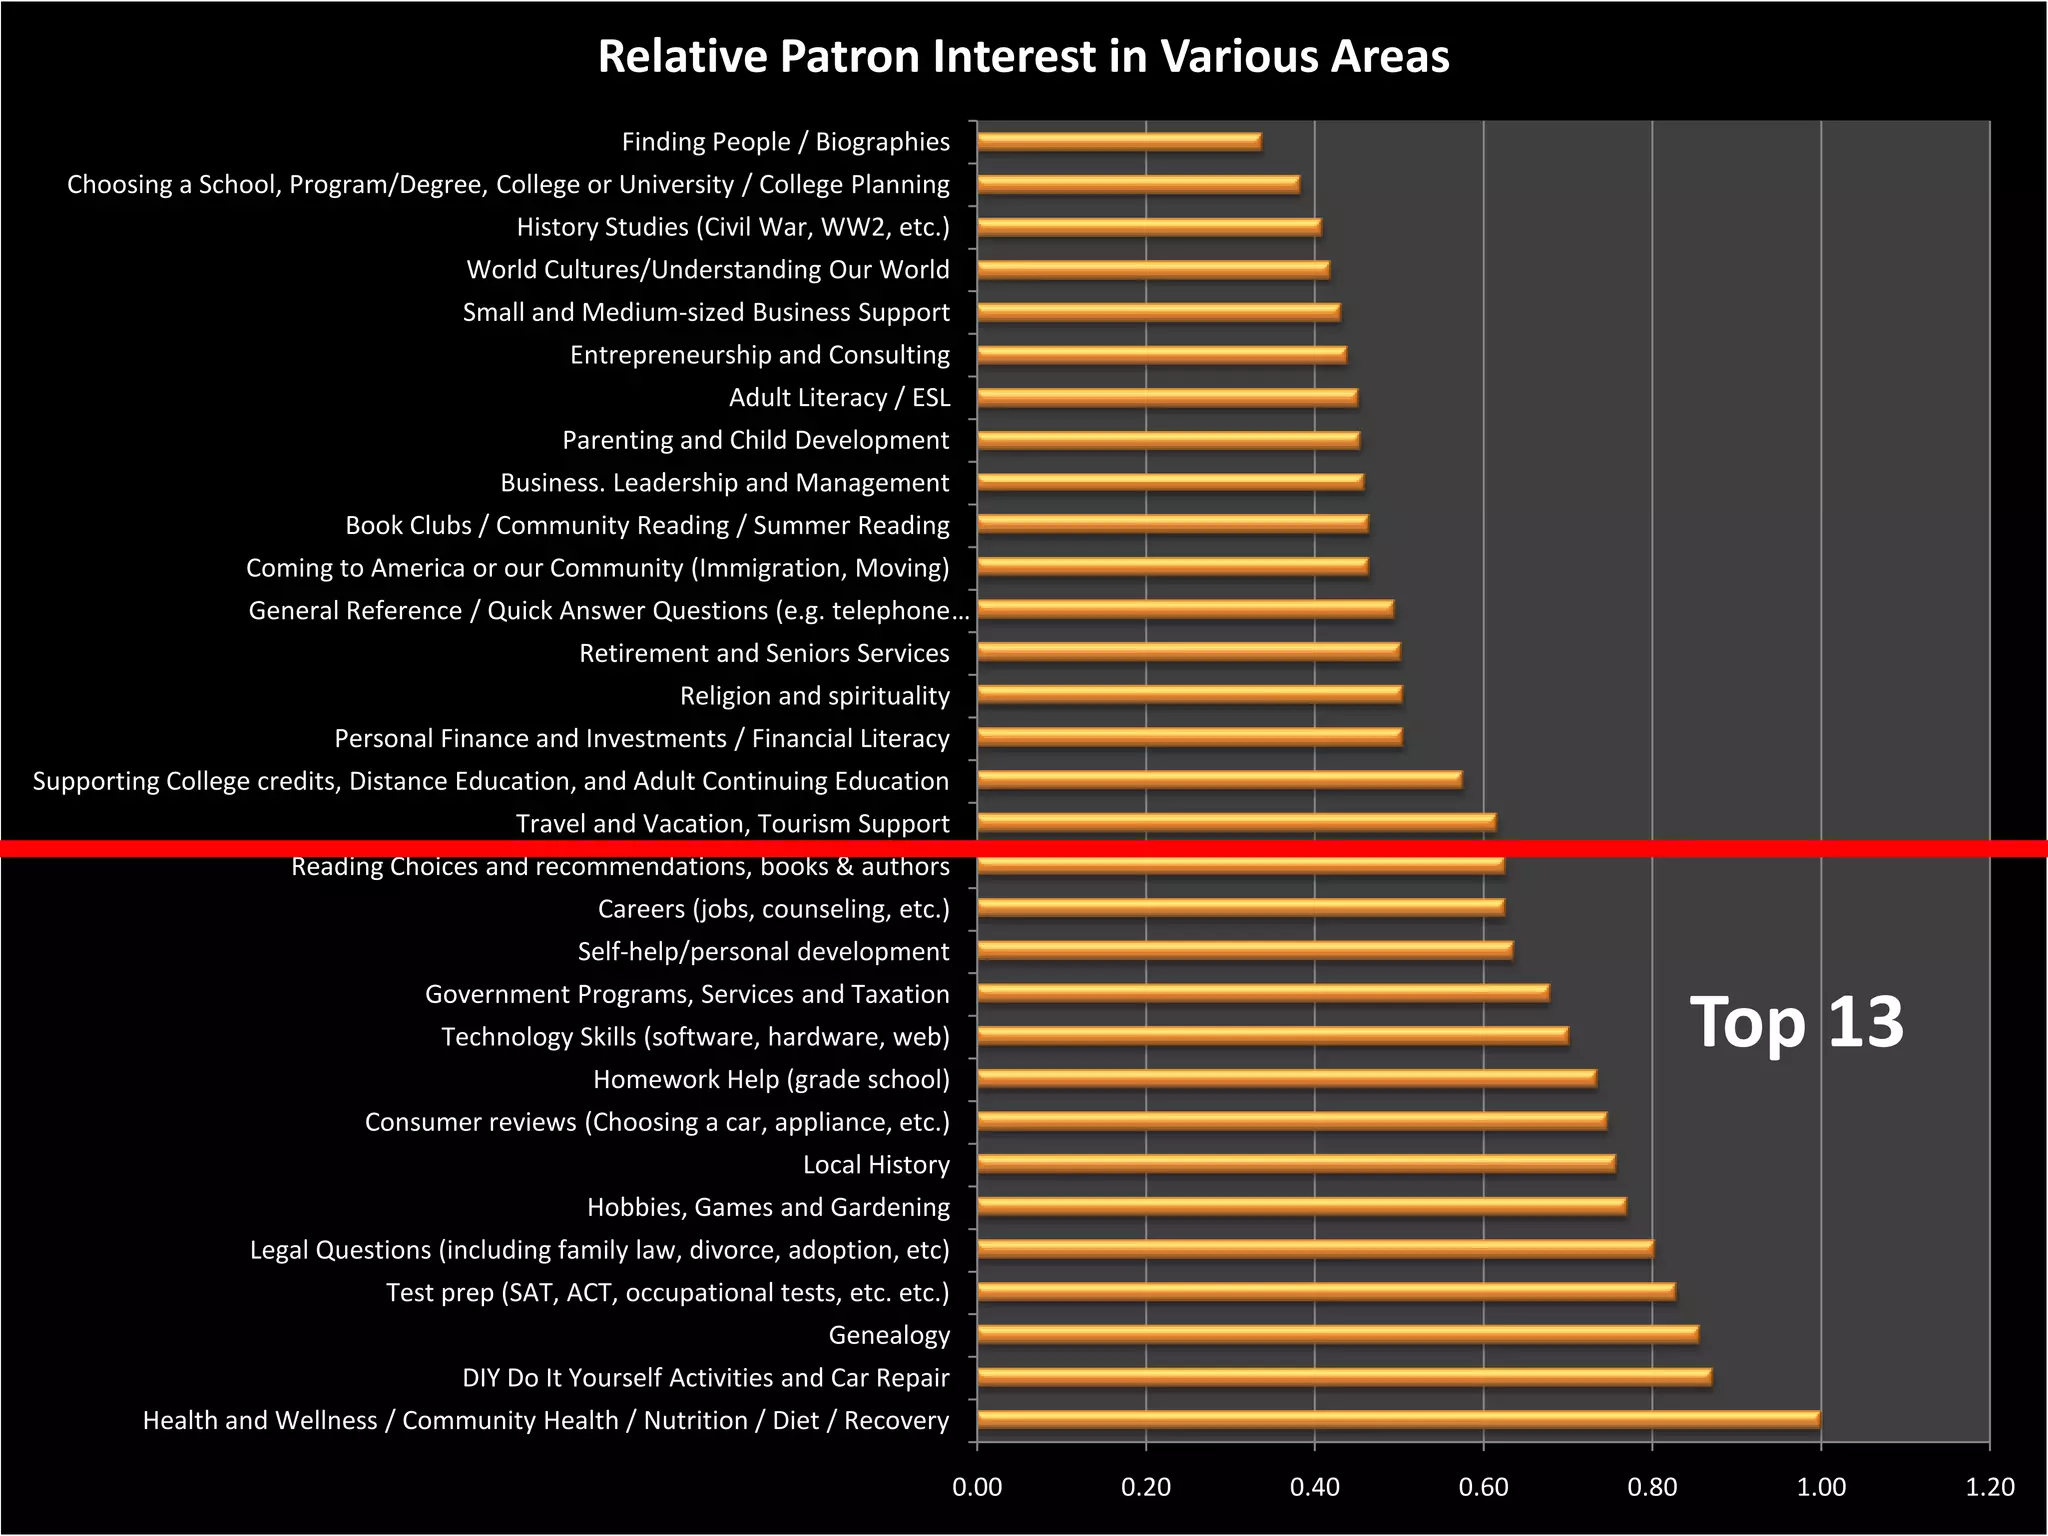
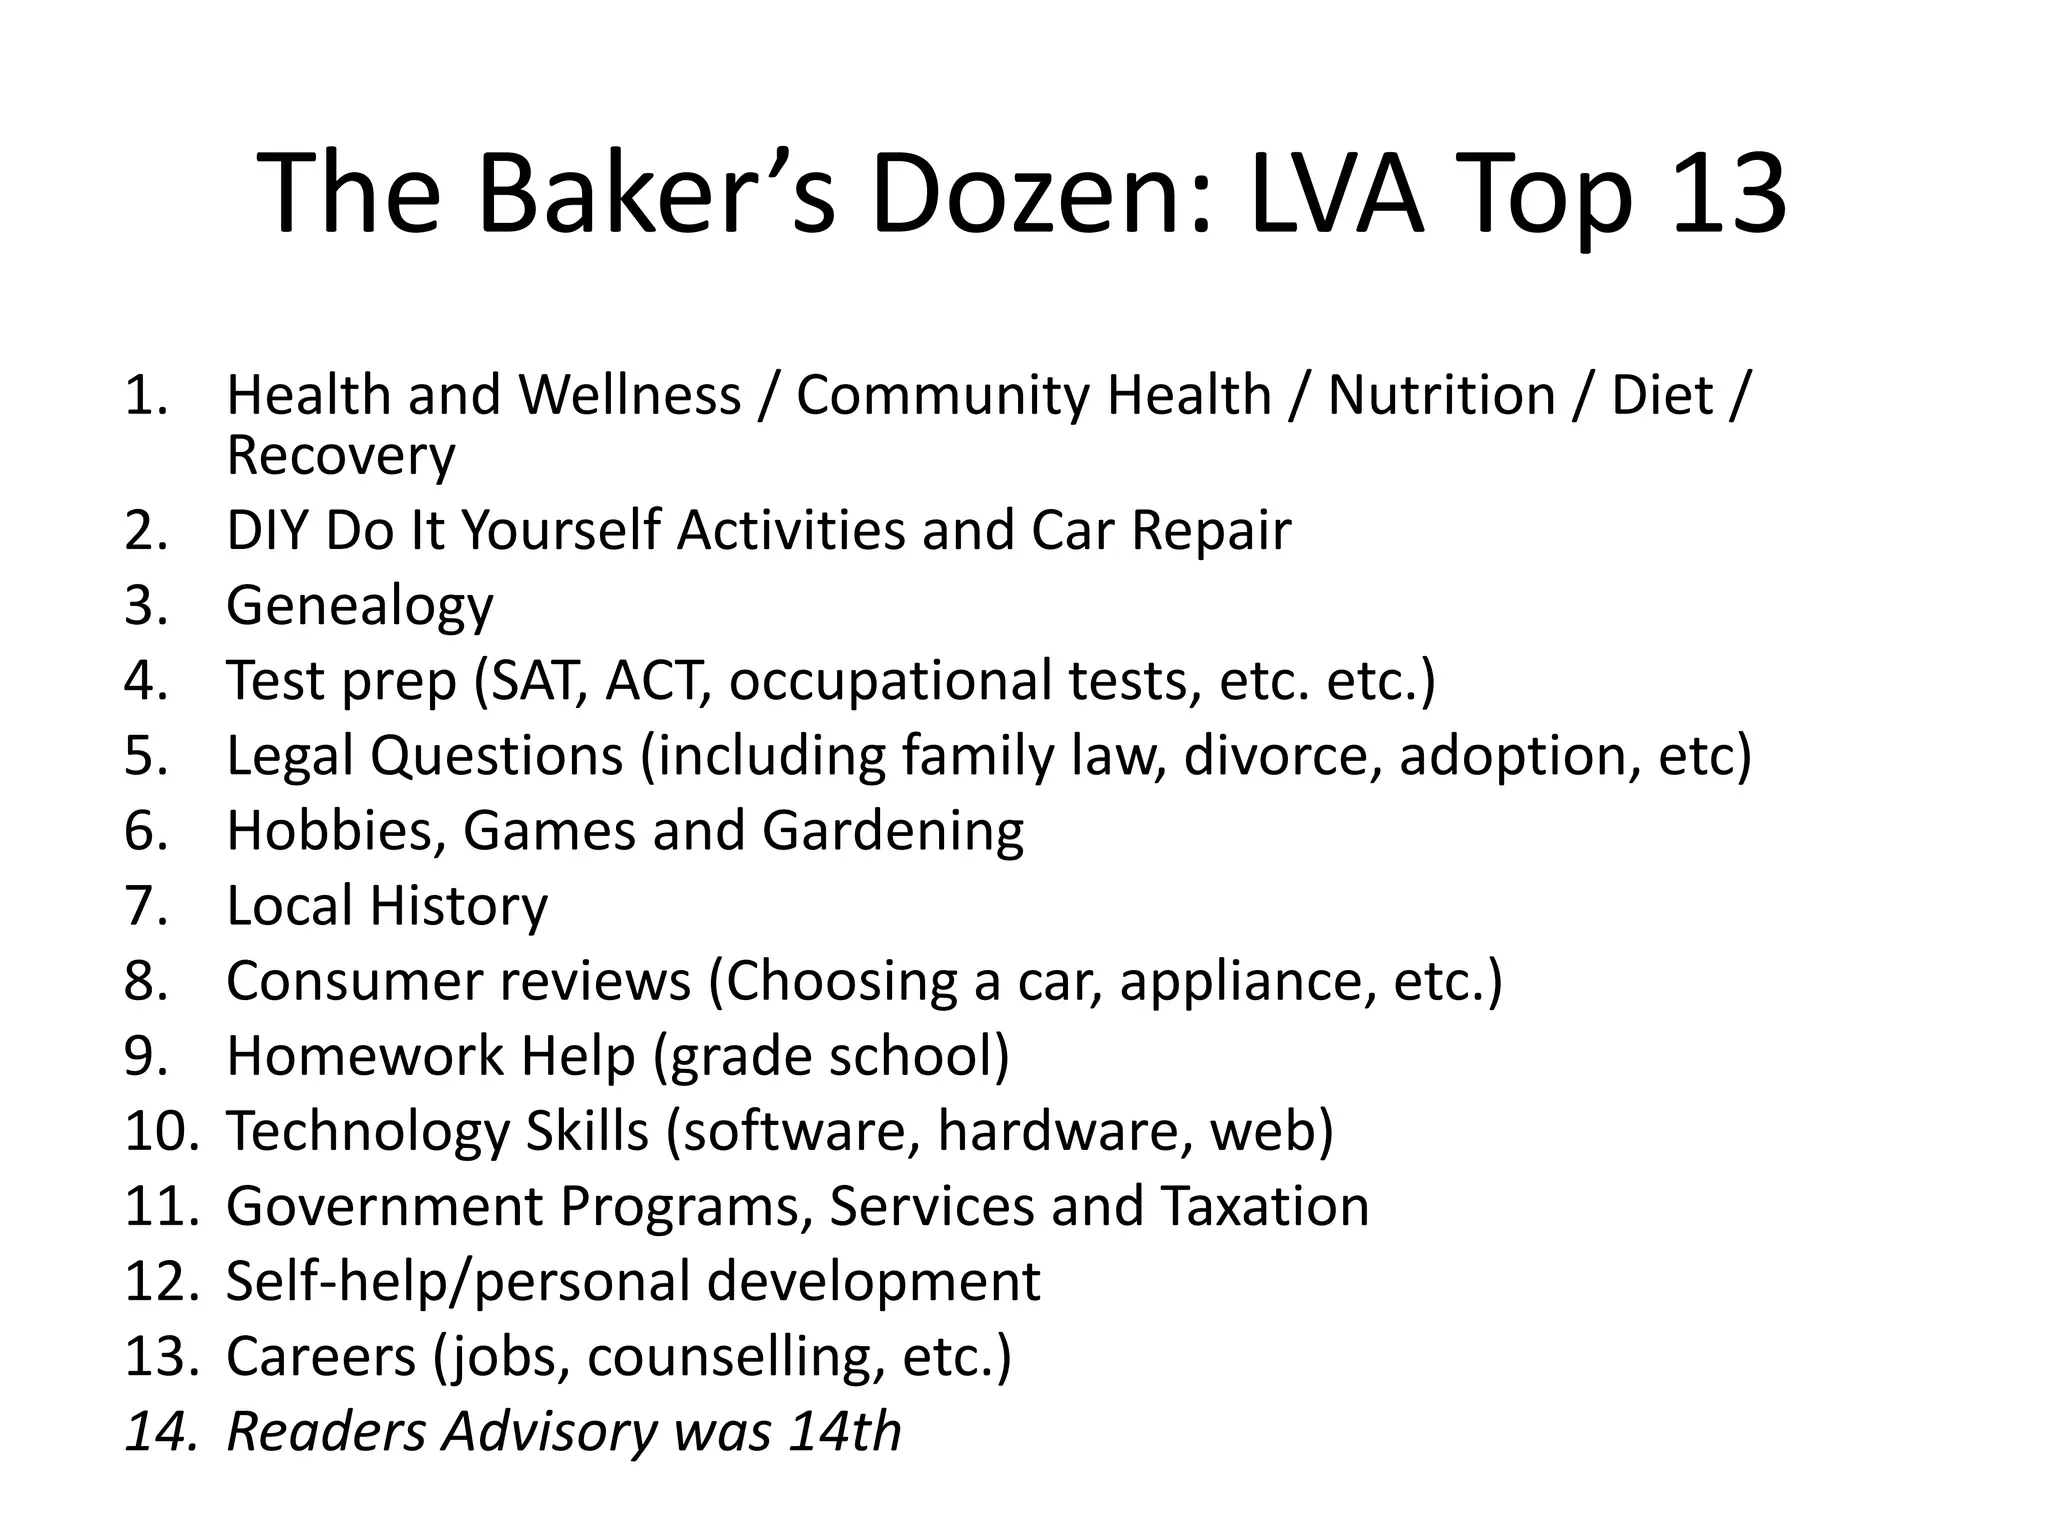
SlideShare a Scribd company logo
Digital
                           Bridge
                             to
                         Somewhere


    Stephen Abram
Gale, Cengage Learning
ALA, Anaheim June 2012
COMMUNITY
  IMPACT


            Stephen Abram
In Other Words…
Meaningful and sustainable strategies based on the needs
       of your libraries and your communities.
6 Sustainable Library Strategies
   for 21st Century Libraries
Black & White
Recognize key shifts
1. Real Learning
• Not random and opportunistic
• Scalable and Repeatable
• Attainable
ed2go Overview

   Public Library Solutions
       February 2012
What is Ed2Go for Libraries?

 • Ed2Go for Libraries is Life Long Learning in Action!


• Ed2Go for Libraries delivers engaging, interesting
  online courses on a variety of popular topics with a
  subscription model designed for libraries.
• Hundreds of courses
• Expert instructors
• Unlimited course registrations
• Annual subscription
A closer look: Product Specs
•   Ed2Go for Libraries
     • Expert instructors lead each course
     • Flexible course model that keeps students accountable and engaged
          •   12-lesson format
          •   20 - 24 course-hours over 6 weeks
          •   Courses kick-off 3rd Wednesday of every month
          •   Student discussion area with instructor interaction
          •   Written in “conversational style”
          •   Download a certificate of completion
          •   Courses added monthly
     • Turn-key product administration for the library
          • Easy to track successful student outcomes
          • ed2go hosts robust website for library administrators packed with usage
            reports, site customization options, and customizable marketing collateral
•   Ed2Go Basic for Libraries
     • All the above MINUS 19 additional courses offering accredited
       continuing education credits
Course Development Process


                             15
Instructor Qualifications


                            16
Four Broad Categories


      Computers and Technology       Personal Development


       Career and Professional   Writing and Publishing


                                                            17
Various Course Examples


                          18
30+ Courses Added Annually
•   Web Design and       •    Advanced Microsoft    •   Courses for Teaching Professionals
    Programming               Excel 2010            •   Singapore Math Strategies: Advanced
•   Macintosh, iPhone, •      Introduction to           Model Drawing for Grades 6-9
    and iPad                  Microsoft Word 2011   •   Creating Classroom Centers
    Programming               for the Mac
•   Creating WordPress •      Introduction to
                                                    •
    Websites II               Photoshop CS6         •   Personal Enrichment
•   Creating Mobile Apps                            •   Introduction to Chemistry
    with HTML5                                      •   Introduction to Biology
                          •                         •   Business Finance for Non-Finance
•   Computer Courses                                    Personnel
•   Intermediate                                    •   Introduction to Digital Scrapbooking
    Microsoft Access
                                                    •   Introduction to Screenwriting
    2010
•   Introduction to
                                                    •   Managing Life as a Single Parent
    Microsoft Publisher                             •   Living Well on a Budget
    2010                                            •   Publish and Sell Your E-Books
•   Introduction to
    Adobe Acrobat X


                                                                                               19
Ed2Go 19 High Value Courses
Advanced CompTIA A+ Certification Prep
Basic CompTIA A+ Certification Prep
Certificate in Complementary and Alternative Medicine
Certificate in End of Life Care
Certificate in Gerontology
Certificate in Growth and Development Through the Lifespan
Certificate in Holistic and Integrative Health
Certificate in Integrative Mental Health
Certificate in Issues in Oxygenation
Certificate in Legal and Ethical Issues in Nursing
Certificate in Pain Assessment and Management
Certificate in Perinatal Issues
Certificate in Spirituality, Health, and Healing
CompTIA A+ Network+ Certification Prep
CompTIA Â+ Security+ Certification Prep
Intermediate CompTIA A+ Certification Prep
PMP® Certification Prep 1
PMP® Certification Prep 2                                    20
2. Real Reading
• eBooks and Beyond
• The reading experience
• Reviews, commentary, communities
READING EXERCISE


 Why do people read?
Why do people read?
1.    To learn
2.    To engage in hearing other’s opinions (to agree or disagree or understand)
3.    To develop more knowledge about myself and develop as a whole person
4.    To be entertained and laugh, to engage and interact
5.    To address boredom and the inexorable progress of time
6.    To research and keep up-to-date
7.    To participate well in civil society (everything from news to voting)
8.    To be informed (and maybe smarter)
9.    To understand others (individually and culturally)
10.   To escape our day-to-day lives
11.   To stimulate the imagination and be inspired or spiritual
12.    To write and communicate better through reading others
13.    To teach
14.    To have something to talk about
15.   To connect with like-minded people
3 .Real Programs
•   Scalable
•   Repeatable
•   Staffed
•   Train the trainer
•   Aligned with collections and communities
•   Partnerships and Alliances
4. Real Technology
•   Experience Portals
•   eLearning
•   Mobile first
•   eBooks
•   Technology enhanced but not tech-centric
    spaces (gesture computing, holograms, laser
    tag, iPhone
    balls, Legobots, Smartboards, Cloud
    computing, monitors, etc.)
5. Real Stories and Measurements
• Stop playing games
Academic Libraries:
Central Michigan University
Grand Valley State University
       Public Libraries:
Clinton Macomb Public Library
     Howell District Library
      Kent District Library
    Portage District Library
• Goals?
• Who are your potential partners and potential
  funders? (Who, What, Where, Why, When and
  How to reach them?)
• GO AFTER STORIES!
• Get the whole story (permissions)
• Test your Story (brief, succinct, complete,
  upbeat, appropriate, personable, actionable)
• Get your story out!
Facebook.com/CanadianOutcomes
The Present         The Future
    The Past
                     Letting People      Letting People
Building Libraries
                      Know About        Know What We
 and Collections
                          Them         Can Do For Them


    It’s All About    It’s All About     It’s All About
       Numbers          Marketing          Outcomes
6. Real Questions
Why do people ask questions?
Is your library experience conceptually organized around answers and programs?
                     Or collections, technology and buildings?
Why do people ask questions?
   Who, What, When, Where
   How & Why
   Data – Information – Knowledge - Behavior
   To Learn or to Know
   To Acquire Information, Clarify, Tune
   To Decide, to Solve, to Choose, to Delay
   To Interview, Delve, Interact, Progress
   To Entertain or Socialize
   To Reduce Fear
   To Help, Aid, Cure, Be a Friend
   To Win A Bet
Sample Charts of Top Library
        Questions
      Stephen Abram, MLS
     Gale Cengage Learning
Advance Survey Data for the
    Library of Virginia
    Prepared by Stephen Abram
  and the Gale, Cengage Learning
 Statistical Analysis Research Team
Reference Facet of the
Library of Virginia Story

  September 2010 Survey Data
62 of 91 LVA library systems (68%)
Respondent Role

          0.0%
        1.7%                         Senior Management
                                     Was Engaged!

25.0%


                                           Director / Management Team

                                           Reference Staff

                                           Circulation Staff

                                           Technology Staff


                             73.3%
Respondent Experience

            0.0%

                   5.1%           You have deep
                                  Experience and
                          11.9%
                                  Talent.!


                                           Less than 1 year
                                           1-5 years
                                           6-10 years
                                           Over 10-years


83.1%
Degree of Urbanization


                                               There was
        18.2%
                                               Diversity of
                               21.8%           Libraries in
                                               the sample.


                                                Urban
                                                Small Town
                                                Rural
                                                Regional Center / Consortia Staff


                                       21.8%


38.2%
Yep – You Get Questions
•   Health and Wellness / Community Health / Nutrition / Diet / Recovery DIY Do It
    Yourself Activities and Car Repair Genealogy Test prep (SAT, ACT, occupational
    tests, etc. etc.) Legal Questions (including family law, divorce, adoption, etc)
    Hobbies, Games and Gardening Local History Consumer reviews (Choosing a
    car, appliance, etc.) Homework Help (grade school) Technology Skills
    (software, hardware, web) Government Programs, Services and Taxation Self-
    help/personal development Careers (jobs, counselling, etc.) Reading Choices and
    recommendations, books & authors Travel and Vacation, Tourism Support
    Supporting College credits, Distance Education, and Adult Continuing Education
    Personal Finance and Investments / Financial Literacy Religion and spirituality
    Retirement and Seniors Services General Reference / Quick Answer Questions (e.g.
    telephone numbers, addresses, definitions, locations, library hours and
    services, etc.) Coming to America or our Community (Immigration, Moving) Book
    Clubs / Community Reading / Summer Reading Business. Leadership and
    Management Parenting and Child Development Adult Literacy / ESL
    Entrepreneurship and Consulting Small and Medium-sized Business Support World
    Cultures/Understanding Our World History Studies (Civil War, WW2, etc.) Choosing
    a School, Program/Degree, College or University / College Planning Finding People
    / Biographies , language learning
Relative Patron Interest in Various Areas
                                                   Finding People / Biographies
  Choosing a School, Program/Degree, College or University / College Planning
                                         History Studies (Civil War, WW2, etc.)
                                     World Cultures/Understanding Our World
                                    Small and Medium-sized Business Support
                                              Entrepreneurship and Consulting
                                                             Adult Literacy / ESL
                                             Parenting and Child Development
                                        Business. Leadership and Management
                          Book Clubs / Community Reading / Summer Reading
                  Coming to America or our Community (Immigration, Moving)
                  General Reference / Quick Answer Questions (e.g. telephone …
                                               Retirement and Seniors Services
                                                        Religion and spirituality
                         Personal Finance and Investments / Financial Literacy
Supporting College credits, Distance Education, and Adult Continuing Education
                                         Travel and Vacation, Tourism Support
                     Reading Choices and recommendations, books & authors
                                              Careers (jobs, counseling, etc.)
                                               Self-help/personal development
                                 Government Programs, Services and Taxation
                                   Technology Skills (software, hardware, web)                                         Top 13
                                                Homework Help (grade school)
                            Consumer reviews (Choosing a car, appliance, etc.)
                                                                   Local History
                                                Hobbies, Games and Gardening
                  Legal Questions (including family law, divorce, adoption, etc)
                              Test prep (SAT, ACT, occupational tests, etc. etc.)
                                                                      Genealogy
                                    DIY Do It Yourself Activities and Car Repair
         Health and Wellness / Community Health / Nutrition / Diet / Recovery

                                                                                    0.00   0.20   0.40   0.60   0.80     1.00   1.20
The Baker’s Dozen: LVA Top 13
1. Health and Wellness / Community Health / Nutrition / Diet /
    Recovery
2. DIY Do It Yourself Activities and Car Repair
3. Genealogy
4. Test prep (SAT, ACT, occupational tests, etc. etc.)
5. Legal Questions (including family law, divorce, adoption, etc)
6. Hobbies, Games and Gardening
7. Local History
8. Consumer reviews (Choosing a car, appliance, etc.)
9. Homework Help (grade school)
10. Technology Skills (software, hardware, web)
11. Government Programs, Services and Taxation
12. Self-help/personal development
13. Careers (jobs, counselling, etc.)
14. Readers Advisory was 14th
Resource Levels for Top Ten Areas of Patron Interest (Question 1)

                Technology Skills (software, hardware, Internet/web)                   51.7%                               48.3%                 0.0%


                         Test prep (SAT, ACT, occupational tests, etc.)                    58.3%                                41.7%            0.0%


         Legal Questions (including family law, divorce, adoption, etc)                    60.0%                               35.0%            5.0%


                                                            Genealogy                      60.0%                           31.7%               8.3%


                           DIY Do It Yourself Activities and Car Repair                        67.8%                              30.5%          1.7%
                                                                                                                                                        Enough
                                                                                                                                                        Not Enough
                                       Homework Help (grade school)                             72.9%                                  25.4%     1.7%
                                                                                                                                                        Not Applicable


                                                         Local History                             75.9%                               22.4%     1.7%


Health and Wellness / Community Health / Nutrition / Diet / Recovery                                81.7%                                16.7% 1.7%


                   Consumer reviews (choosing a car, appliance, etc.)                                83.1%                                15.3% 1.7%


                                               Hobbies and Gardening                                   88.3%                               10.0%
                                                                                                                                               1.7%


                                                                          0%   10%   20%    30%      40%     50%   60%   70%     80%      90%    100%
Student Homework Support - Level of Requests by Area
100%            0.0%
                1.7%                 0.0%
                                     1.7%                 0.0%
                                                          1.7%                1.7%                0.0%                                   1.7%
                                                                              1.7%                                   3.4%

               10.0%                                                                             11.7%
                                    13.3%                13.3%
90%

                                                                             22.0%

80%
                                                                                                 20.0%
                                                                                                                                         44.1%

70%
                                                                                                                     56.9%
               43.3%                38.3%                38.3%

60%

                                                                                                                                                   N/A
                                                                             42.4%
                                                                                                 35.0%                                             Not at all Common
50%
                                                                                                                                                   Slightly Common
                                                                                                                                                   Common
40%                                                                                                                                                Very Common

                                                                                                                                         39.0%

30%
                                                                                                                     22.4%

               45.0%                46.7%                46.7%
20%
                                                                             32.2%               33.3%

                                                                                                                     12.1%
10%                                                                                                                                      11.9%


                                                                                                                     5.2%                3.4%
 0%
       History / Social Studies
                            Science / Science fairs)   Biographies
                                                               Special Events (Black (or Hispanic, Asian, Native American) Studies Month)
                                                                           Literature                            Women’s History        Religion
Areas of World Which Generate Most Questions
100%   0.00%    1.67%    0.00%    0.00%    1.75%    0.00%    1.67%    0.00%    1.89%    1.69%    0.00%    1.69%    0.00%    1.69%
       6.90%
                11.67%            17.24%   14.04%   17.24%            17.54%
90%                      18.97%
                                                             23.33%                     22.03%
                                                                               28.30%            31.03%   30.51%
80%                                                                                                                39.66%
       34.48%                                                                                                               42.37%
                28.33%
70%

                         36.21%   41.38%
60%                                        47.37%

                                                    56.90%            57.89%
50%                                                          50.00%
                                                                                        55.93%
                                                                               49.06%
                                                                                                 51.72%
40%                                                                                                       52.54%                     N/A
       39.66%   38.33%
                                                                                                                   46.55%
                                                                                                                                     Not at all Popular
                                                                                                                            45.76%
30%                                                                                                                                  Slightly Popular
                         37.93%   32.76%   22.81%                                                                                    Popular
20%                                                                                                                                  Very Popular
                                                                      14.04%
                                                    24.14%   20.00%
                                                                               18.87%   16.95%   10.34%
10%    18.97%   20.00%
                                           14.04%                                                         15.25%   13.79%
                                                                      10.53%                                                8.47%
                         6.90%    8.62%                                                          6.90%
                                                             5.00%                      3.39%
 0%                                                 1.72%                      1.89%                      0.00%    0.00%    1.69%
The Strategic Collection Issue


•List includes top 10 subjects for each group.
•Most popular subject for each group is denoted by 10, least popular (within top 10) is denoted by 1.
•Items that did not make the top 10 for a particular group are denoted by 0 for that group.
•Since not all items were included in the top 10 of all groups, the sum of scores is taken across groups, rather than the
average, to provide the overall rankings (higher being better).
•The overall top 10 items are the same as those represented in the chart, but rank differs due to the fact that only 55
respondents are included above (others did not indicate a location type).
Top Hobbies Survey

From Stephen’s Lighthouse
Top 12 Patron Hobbies
          Recreational Reading
             Cooking & Recipes
                     Computers
                 Movies & Film
    Exercise, Cycling & Walking
Traveling, Tourism & Vacations
                          Music
                            Pets
                      Gardening
               Television Shows
                    Arts & Crafts
        Knitting & Needlecrafts

                                    0      10    20    30   40   50   60   70


                               I made a mistake and left out photography as a hobby.
Patron Hobbies - All
                  Recreational Reading
                     Cooking & Recipes
                             Computers
                          Movies & Film
            Exercise, Cycling & Walking
        Traveling, Tourism & Vacations
                                   Music
                                    Pets
                              Gardening
                       Television Shows
                            Arts & Crafts
                Knitting & Needlecrafts
                        Diet & Nutrition
          Religion & Spiritual Activities
                              Genealogy
  Carpentry, Home Repair & Additions
                Antiques & Collectibles
                          Video Gaming
                        Volunteer Work
                            Outdoor Life
                        Creative Writing
                      Cars, Motorcycles
                   Board & Card Games
                         Summer Sports
Painting & Sculpture / Art Appreciation
                Adult Individual Sports
                                   Other
  Home Entertaining, Picnics & Parties
                            Live Theatre
                                  Sewing
                     Adult Team Sports
                       Children's Sports
                                    Golf
                          Woodworking
                          Winter Sports
                       Stamp collecting
Other Hobbies


         1                  Bird Feeding


                1           Genealogy


                            Homesteading
5                       1

                            Internet social games


                            Learning to use my I-POD
                        1

                            Politics


                1           Hiking


    1    1
                            Photography/Photojournalism
Other Hobbies


                Bird Feeding


                Genealogy


                Homesteading


                Internet social games


                Learning to use my I-POD


                Politics


                Hiking


                Photography/Photojournalism
National Library Customer Satisfaction
                 Data
Specific Database Results from Usage


           Year One: Aug. 2009 – Sept. 2010
   Sample: More up to date and local data is available
What do we need to know?
• How do library databases compare with other web
  experiences and expectations?
• Who are our core virtual users?
• What are user expectations for satisfaction?
• How does library search compare to consumer
  search like Google?
• How do people find and connect with library virtual
  services?
• What should we ‘fix’ as a first priority?
• Are end users being successful in their POV?
• Are they happy? Will they come back? Tell a friend?
Top-Level Benchmarks
          Gale-Cengage Browse Survey
          August 01, 2010 - August 31, 2010


              90      90     90      89            90   90        90        90   90
                                              88             87                            87
                                                                       85             84
                                                                       78                  77
71                                   75                 76
                             73                                                  74   74
              72      72                                          72
     71
                                         Gale Library
                                              70
                                                   68
                                                             70             69
                                                                                      65
                                                                                           62

                                      Databases Compare 59             59


                             48

                                     41
                                          Very Well                              48


              30      30
                                           to Other
                                              30
                                                   33
                                                             37

                                                                  30        30

                                       Web Experiences
 0
Digging Into Satisfaction
                  3        4       5       9        6       8       7       2        1

                                                                                  Element
                 High Univers/           Other,          Other            Middle    ary
                School College           please         Profess- Profess- School School
                Student Student Librar’n specify Teacher ional      or    Student Student Overall
     Responses: 3,043    2,920   1,570    709     576      576     488     477      148   10,507
                 29%     28%      15%     7%       5%      5%      5%      5%       1%

Content           70      77      79       69    Users will
                                                   77      74       67      68      40      73

Look and Feel

Navigation
                  64

                  65
                          74

                          71
                                  74

                                  69
                                           64

                                           60
                                                Return and
                                                   72

                                                   69
                                                           70

                                                           66
                                                                    61

                                                                    60
                                                                            63

                                                                            63
                                                                                    37

                                                                                    45
                                                                                            68

                                                                                            66

Search            61      73      73       60  Recommend
                                                   71      67       59      59      35      66
Site
Performance
                  73      79      77       72
                                               Once Hooked
                                                   77      76       68      72      52      75

Satisfaction      63      74      72       60      72      66       59      62      35      67
Likelihood to
                  72      82      85       71      82      78       66      69      36      76
Return
Primary
                  63      73      68       56      70      60       51      60      33      65
Resource

Recommend         63      78      83       66      80      72       63      61      36      71
Gale-Cengage Browse Survey
                                                                        Priority Map
                                                             October 01, 2009 - October 31, 2009

                              STATUS QUO REQUIRED                                             MAINTAIN OR IMPROVE


    High


                                Site Performance
                                      74, 0.4                          Content
                                                                       73, 1.1
                                                                                  Library
  SCORE


          72

                                                                                  Search
                                Look and Feel
                                   68, 0.4
                                                                                 Needs to
                                                             Navigation
                                                              67, 0.9
                                                                                 Improve                                   Search
                                                                                                                           67, 2.8


   Low

          62
               0.2   Low                    MONITOR              1.2                               TOP PRIORITY
                                                                                                    2.2             High
Key:
Position of each bubble indicates its score and impact                           IMPACT
Size of each bubble also indicates the relative size of impact
Who uses e-Resources?

      High School Student                                                              29%


University/ College Student                                                          28%


                  Librarian
                                                             The Core User
                                                                   15%


     Other, please specify                        7%
                                                               For Library
                  Teacher                    5%
                                                              E-Resources
        Other Professional                   5%
                                                                 is Clear
                 Professor               5%


    Middle School Student               5%


Elementary School Student          1%


                              0%        5%             10%       15%     20%   25%         30%   35
Gale-Cengage Browse Survey
Did you find what you were looking for?
 August 01, 2009 - September 06, 2010

                (N: 10486)


   Don't know yet
        20%

            Database Users
 No
              Are Being
20%                              Yes

              Successful         60%
Gale-Cengage Browse Survey
  Which search engine do you primarily use to do online research?
              August 01, 2009 - September 06, 2010

                                    (N: 10486)


                                    Ask.com
                        Yahoo.com     3%
                           6%

Other, please specify
        10%


                                                 Google.com
                                                    81%
Gale-Cengage Browse Survey
What type of difficulty, if any, did you encounter with the navigation process on this website?
                               August 01, 2009 - September 06, 2010

                                                     (N: 10486)

                                                              Links/labels are
                             Had technical difficulties   difficult to understand
                              (e.g. broken links, error               4%
                                     messages)
                                        4%
                 Too many links or
                navigational choices
                         5%


                                                     There are
     Could not navigate back to
       previous information
                8%


     Would often feel lost, not
       know where I was
                                                    Training and
                                                            Did not have any difficulty
                                                                navigating the site

                                                  Communication
               8%                                                     52%

                                  Other, please
                                     specify
                                       9%
                                                   Opportunities

                     Links did not take me
                       where I expected
                              10%
Gale-Cengage Browse Survey
         What is your gender?
  August 01, 2009 - September 06, 2010

                   (N: 10484)


       Prefer not to respond
                8%


              More Males Use
Male
33%
                 Library
                Databases       Female
                                 59%


               Than Usual
Gale-Cengage Browse Survey
          What is your age?
 August 01, 2009 - September 06, 2010

                     (N: 10486)


        Prefer not to respond
                 7%


        26-35
         10%
                 There is Not      18 and under
                                       30%
19-25
 11%            A Demographic
                Swing in Online
        36-50
         19%        Usage         51+
                                  23%
Gale-Cengage Browse Survey
Do you trust the content on this website more than the content you find through web search
                                         engines?
                           August 01, 2009 - September 06, 2010

                                            (N: 10486)


                                          No
                                          9%


                                            Library Users
                                            Trust Library
                        Haven't thought about it
                                  18%


                                              Databases
                                               More.     Yes
                                                         73%
Gale-Cengage Browse Survey
 Which best describes the purpose of your research today?
          August 01, 2009 - September 06, 2010

                                   (N: 10486)


                            Just browsing
Other, please specify            5%
         6%


                Personal
                 interest
                   10%
                             School is the
                             Sweet Spot –
            Professional project

                            But Other Users
                   17%                          School assignment
                                                       62%


                             Abound Too.
Gale-Cengage Browse Survey
                                   Which best describes your role on this website today?
                                          August 01, 2009 - September 06, 2010

                                                          (N: 10486)


 High School Student                                                                               29%


   University/ College
                                                                                                 28%
        Student


             Librarian                                            15%
                                                            Library’s
 Other, please specify                         7%
                                                          Natural Allies
             Teacher                      5%
                                                          Are Big Users
   Other Professional                     5%


            Professor
                                                           & Potential
                                      5%


Middle School Student                 5%
                                                            Partners.
   Elementary School
                              1%
       Student

                         0%          5%             10%         15%        20%             25%     30%   35%
Gale-Cengage Browse Survey
            How did you find out about this website?
             August 01, 2009 - September 06, 2010

                            (N: 10486)


  Other, please specify   Web search
           5%              engine
                             3%

Used in the past
      7%
          Wow! Only 29% of
                                               Librarian

            Users Find                           32%


           E-Resources
           Teacher
            24%

           Through Our
                            School or library website
            Websites.                 29%
Gale-Cengage Browse Survey
                        How frequently do you use this website?
                         August 01, 2009 - September 06, 2010

                                             (N: 10486)


           Every 6 months or less
                    7%                   Daily
                                          7%


About once every 3 months
                                     And 39% of Your
           8%
                                    Users Are in Your           First time
                                                                   36%


                                     Databases for
                        About once a month
                               10%


                                      For the Very
                            Several times a
                                week           Several times a month
                                 14%
                                       First Time!      18%
Gale-Cengage Browse Survey
                                          Recommend - Scores and Distributions
                                           August 01, 2009 - September 06, 2010

                                                         (Avg. Score: 71)
                                                                               Your Users
                                                                                  Will
                                                                              Recommend
                                                                             Your Databases
 How likely are you to
recommend this site to
   someone else?              12%   2%3%3% 5%   5%       7%    11%           14%                      39%
    Avg Score: 7.4
      N*: 10486


                         0%             20%                   40%                  60%                80%   100%
* N values exclude
 "Don't Know"                                        1    2   3      4   5    6    7     8   9   10
Gale-Cengage Browse Survey
                                        Primary Resource - Scores and Distributions
                                           August 01, 2009 - September 06, 2010

                                                         (Avg. Score: 65)
                                                                               Your Users
                                                                                Respect
                                                                             Your Databases
 How likely are you to
                                                                               As Primary
  use this site as your
  primary resource for
 your research needs?
                               12%   3% 4% 4%   6%       7%    10%           14%Sources  13%                  27%
     Avg Score: 6.9
       N*: 10486


                          0%             20%                  40%                  60%                  80%         100%
* N values exclude
 "Don't Know"                                        1    2   3      4   5     6   7     8     9   10
Gale-Cengage Browse Survey
                                         Likelihood to Return - Scores and Distributions
                                              August 01, 2009 - September 06, 2010

                                                           (Avg. Score: 76)
                                                                                         Your Users
                                                                                             Are
                                                                                          Likely to
                                                                                           Return
  How likely are you to
   return to this site?
                               9%   2% 2% 4% 4%
                                      2%          7%       11%             14%                         46%
     Avg Score: 7.9
       N*: 10486


                          0%               20%                   40%                     60%                80%   100%
* N values exclude
 "Don't Know"                                          1   2     3     4         5   6   7     8   9   10
Gale-Cengage Browse Survey
                                                  Satisfaction - Scores and Distributions
                                                  August 01, 2009 - September 06, 2010

                                                               (Avg. Score: 67)
                                                                                           Your Users
  How does this site
compare to your idea of
                                                                                            Evaluate
  an ideal website?              10%   3% 4% 4%     7%        8%         13%              18%                  15%           19%
   Avg Score: 6.8
      N*: 10486                                                                           Your Services
                                                                                           as Meeting
                                                                                          Expectations.
How well does this site
     meet your
   expectations?                 10%   2%3% 4% 6%        6%        11%              18%                  18%                22%
   Avg Score: 7.1
     N*: 10486


   What is your overall
   satisfaction with this
           site?                 9%    2% 3% 5%
                                         3%          7%        11%                 18%                  19%                 23%
     Avg Score: 7.2
         N*: 10486


                            0%               20%                       40%                    60%                     80%          100%
* N values exclude
 "Don't Know"                                             1        2     3     4    5     6     7   8     9      10
Gale-Cengage Browse Survey
                                                Site Performance - Scores and Distributions
                                                   August 01, 2009 - September 06, 2010

                                                                 (Avg. Score: 75)


Please rate the ability to
   load pages without
getting error messages
                                  7% 1% 2%3% 4%
                                      2%             6%         14%               19%                              42%
       on this site.
      Avg Score: 8
        N*: 4659


     Please rate the
  consistency of speed
  from page to page on
                                  7% 1% 2% 5%
                                      2%        6%        11%             19%                   20%                      28%
        this site.
     Avg Score: 7.7
        N*: 4661


Please rate how quickly
pages load on this site.
                                  7% 1% 3% 5%
                                      2%          5%       12%              18%                 20%                      27%
    Avg Score: 7.6
       N*: 4660


                             0%                 20%                   40%                   60%                    80%         100%
* N values exclude
 "Don't Know"                                               1     2   3      4     5    6   7         8   9   10
Gale-Cengage Browse Survey
                                                     Search - Scores and Distributions
                                                    August 01, 2009 - September 06, 2010

                                                                   (Avg. Score: 66)

 Please rate how well
  the search feature
helps you to narrow the
                                  11%    3% 4% 4%    6%           8%          12%             17%               15%               21%
results to find what you
          want.
   Avg Score: 6.8…

 Please rate how well
the search results help
  you decide what to
                                  11%    2% 3% 4%   6%        8%             12%             18%                15%               21%
        select.
    Avg Score: 6.9
      N*: 10486

     Please rate the
 organization of search
   results on this site.          9%    2% 3% 5%
                                          3%             7%            12%              19%                   16%                24%
     Avg Score: 7.2
        N*: 4659


       Please rate the
    relevance of search
     results on this site.        9%    3% 3% 4%    6%        8%           11%              17%                17%               22%
        Avg Score: 7
          N*: 4661


                             0%                20%                           40%                    60%                    80%          100%
* N values exclude
 "Don't Know"                                                 1        2     3      4   5     6     7     8     9     10
Gale-Cengage Browse Survey
                                                  Navigation - Scores and Distributions
                                                  August 01, 2009 - September 06, 2010

                                                                 (Avg. Score: 66)


Please rate the number
 of clicks to get where
 you want on this site.         10%    3% 6%      6%       7%      8%         11%             17%             13%            19%
     Avg Score: 6.6
        N*: 4661

  Please rate how well
   the site layout helps
  you find what you are
                                9%    2%3% 4%    6%        8%         13%               19%               16%               21%
        looking for.
       Avg Score: 7
          N*: 4658

Please rate the options
available for navigating
        this site.              9%    2%3% 4%    7%        7%         13%               20%               15%               21%
     Avg Score: 7
       N*: 4663


  Please rate how well
  the site is organized.
                                9%    1% 3% 6%
                                       2%             6%        12%               21%                   16%                24%
     Avg Score: 7.3
         N*: 4661


                           0%                   20%                     40%                   60%                    80%           100%
* N values exclude
 "Don't Know"                                               1     2     3     4     5    6     7    8     9     10
Gale-Cengage Browse Survey
                                                Look and Feel - Scores and Distributions
                                                 August 01, 2009 - September 06, 2010

                                                                 (Avg. Score: 68)


    Please rate the
readability of the pages
      on this site.             7% 1% 2% 5%
                                    2%         5%         11%             19%             18%                        30%
    Avg Score: 7.7
       N*: 4659


Please rate the balance
of graphics and text on
       this site.               8%   2%3% 5%     8%         9%        13%           19%                 15%                20%
     Avg Score: 7
       N*: 4658


  Please rate the visual
   appeal of this site.
                                9%   2% 4% 5%        8%         10%       13%           16%             14%                20%
     Avg Score: 6.9
        N*: 4663


                           0%                  20%                    40%                 60%                  80%               100%
* N values exclude
 "Don't Know"                                               1     2   3     4   5   6     7     8   9     10
Gale-Cengage Browse Survey
                                                    Content - Scores and Distributions
                                                   August 01, 2009 - September 06, 2010

                                                                   (Avg. Score: 73)


    Please rate the
freshness of content on
       this site.               9%   1% 3% 6%
                                      2%            7%            12%               18%              18%                    26%
    Avg Score: 7.4
       N*: 4662


 Please rate the quality
 of information on this
          site.                 8%   1% 2% 4% 5%
                                      2%                 9%               18%                  20%                        31%
     Avg Score: 7.7
        N*: 4661


   Please rate the
accuracy of information
     on this site.              8% 1% 2% 5% 4%
                                    2%               8%                 18%                   22%                         31%
    Avg Score: 7.8
      N*: 4660


                           0%                20%                         40%                   60%                  80%           100%
* N values exclude
 "Don't Know"                                                 1     2     3     4     5   6     7    8     9   10
There’s Great News!
     We have Room for
     Improvement BUT
Library Databases Compete
    Very Well with User
      Expectations and
     Needs Fulfillment.
Gale-Cengage Browse Survey
                                                  Future Behaviors with Satisfaction Trendlines
                                                      August 01, 2009 - September 06, 2010

                       100


                        90


                        80
Score


                        70


                        60


                        50


                        40
                               Aug-09   Sep-09   Oct-09   Nov-09   Dec-09   Jan-10   Feb-10   Mar-10   Apr-10   May-10   Jun-10   Jul-10   Aug-10   Sep-10
        Likelihood to Return    82       76       77       76       77       75       77       75       76        76      77       83       81       77
        Primary Resource        69       63       64       66       65       64       67       65       65        65      64       68       66       63
        Recommend               77       71       72       70       71       70       72       70       70        70      74       79       77       74
        Satisfaction            70       66       68       67       68       65       68       66       67        67      68       72       71       67


                                                                               Time Periods
Gale-Cengage Browse Survey
                                                       Elements with Satisfaction Trendlines
                                                       August 01, 2009 - September 06, 2010

                     100


                       90


                       80


                       70
Score


                       60


                       50


                       40
                            Aug-09   Sep-09   Oct-09   Nov-09   Dec-09   Jan-10   Feb-10   Mar-10   Apr-10   May-10   Jun-10   Jul-10   Aug-10   Sep-10
        Content              75       74       73       72       73       71       74         73     73       73       74       78       79       78
        Look and Feel        71       69       68       68       68       67       68         68     68       68       72       76       74       70
        Navigation           69       66       67       66       67       64       67         66     66       66       68       73       70       62
        Search               70       66       67       66       66       65       67         66     66       66       69       72       72       68
        Site Performance     78       75       74       74       75       73       75         75     75       77       82       80       81       81
        Satisfaction         70       66       68       67       68       65       68         66     67       67       68       72       71       67


                                                                               Time Periods
Gale-Cengage Browse Survey
                                                                     Satisfaction Trendlines
                                                               August 01, 2009 - September 06, 2010

                          100


                           90


                           80
Satisfaction Score


                           70


                           60


                           50


                           40
                                    Aug-09   Sep-09   Oct-09   Nov-09   Dec-09   Jan-10     Feb-10   Mar-10   Apr-10   May-10   Jun-10   Jul-10   Aug-10   Sep-10
                     Satisfaction    70       66       68       67       68       65         68       66       67       67       68       72       71       67


                                                                                          Time Periods
Gale-Cengage Browse Survey
                                                                 Number of Survey Respondents
                                                               August 01, 2009 - September 06, 2010

                        1,800
                                                                                                             The School
                        1,600
                                                                                                             Cycle Drives
                        1,400


                        1,200
                                                                                                             Many Usage
                                                                                                              Scenarios
Number of Respondents


                        1,000


                         800


                         600


                         400


                         200


                           0
                                    Aug-09   Sep-09   Oct-09   Nov-09   Dec-09   Jan-10     Feb-10   Mar-10   Apr-10   May-10   Jun-10   Jul-10   Aug-10   Sep-10
                                N    203     1,153    1,611    1,391     760      814       1,081    1,138    1,059     691      168      170      192      55


                                                                                          Time Periods
Lego™ Pieces
• Counter Sushi data
• Database usage (unique user, session, length
  of session, hits, downloads, etc.)
• Google Analytics
• Foresee satisfaction and demographic data
• Search Samples
• ILS Data
• Geo-IP data
Summary
1. Real Learning
2. Real Technology: Social Tools and Experience
   Portals
3. Real Reading – not just eBooks
4. Context: Real Content Drives Programming
5. Real Questions Drive Program Portfolio
6. Statistics become Impact Measurements and
   Stories tell the story
Stephen Abram, MLS, FSLA
VP strategic partnerships and markets
               Cengage Learning (Gale)
                     Cel: 416-669-4855
        stephen.abram@cengage.com
           Stephen’s Lighthouse Blog
       http://stephenslighthouse.com
             Facebook: Stephen Abram
      LinkedIn / Plaxo: Stephen Abram
                        Twitter: sabram
           SlideShare: StephenAbram1

More Related Content

Viewers also liked

Viewers also liked (6)

Il stats workshop
Il stats workshopIl stats workshop
Il stats workshop
 
Workbook
WorkbookWorkbook
Workbook
 
Cildc13 engaging teens in libraries b_pichman_final
Cildc13 engaging teens in libraries b_pichman_finalCildc13 engaging teens in libraries b_pichman_final
Cildc13 engaging teens in libraries b_pichman_final
 
Alallama2011
Alallama2011Alallama2011
Alallama2011
 
Hyperlib mooc success
Hyperlib mooc successHyperlib mooc success
Hyperlib mooc success
 
Eos ala vendor choice
Eos ala vendor choiceEos ala vendor choice
Eos ala vendor choice
 

Similar to Ala2012 bridge to somewhere (20)

Ebslg cambridge june 2013
Ebslg cambridge june 2013Ebslg cambridge june 2013
Ebslg cambridge june 2013
 
Lasko
LaskoLasko
Lasko
 
Belfast sla june 2013
Belfast sla june 2013Belfast sla june 2013
Belfast sla june 2013
 
Mexico cityunam
Mexico cityunamMexico cityunam
Mexico cityunam
 
Oglc april29 2014
Oglc april29 2014Oglc april29 2014
Oglc april29 2014
 
Epl feb 2013 public lecture
Epl feb 2013 public lectureEpl feb 2013 public lecture
Epl feb 2013 public lecture
 
Hancock county feb 2013
Hancock county feb 2013Hancock county feb 2013
Hancock county feb 2013
 
Cla2013 frankenlibraries
Cla2013 frankenlibrariesCla2013 frankenlibraries
Cla2013 frankenlibraries
 
Burnaby trusteesandpublic
Burnaby trusteesandpublicBurnaby trusteesandpublic
Burnaby trusteesandpublic
 
Nola m arch 2013 long
Nola m arch 2013 longNola m arch 2013 long
Nola m arch 2013 long
 
Lwb feb2013
Lwb feb2013Lwb feb2013
Lwb feb2013
 
Web2.012 speech
Web2.012 speechWeb2.012 speech
Web2.012 speech
 
Sla 2016 presentation
Sla 2016 presentationSla 2016 presentation
Sla 2016 presentation
 
Digital Literacy Lens for the SCONUL 7 pillars model of IL
Digital Literacy Lens for the SCONUL 7 pillars model of ILDigital Literacy Lens for the SCONUL 7 pillars model of IL
Digital Literacy Lens for the SCONUL 7 pillars model of IL
 
Technology that enhances classroom learning
Technology that enhances classroom learningTechnology that enhances classroom learning
Technology that enhances classroom learning
 
Burnaby staff final
Burnaby staff finalBurnaby staff final
Burnaby staff final
 
Montreal nov26 2013
Montreal nov26 2013Montreal nov26 2013
Montreal nov26 2013
 
Njla2013 frankenlibraries
Njla2013 frankenlibrariesNjla2013 frankenlibraries
Njla2013 frankenlibraries
 
Fort bend tx may 2013 staff day
Fort bend tx may 2013 staff dayFort bend tx may 2013 staff day
Fort bend tx may 2013 staff day
 
Guelph public presentation
Guelph public presentationGuelph public presentation
Guelph public presentation
 

More from Stephen Abram

More from Stephen Abram (20)

Hub Design Inspiration Graphics May 24 2024.pdf
Hub Design Inspiration Graphics May 24 2024.pdfHub Design Inspiration Graphics May 24 2024.pdf
Hub Design Inspiration Graphics May 24 2024.pdf
 
Honeycomb for The Hive Design Inspirations
Honeycomb for The Hive Design InspirationsHoneycomb for The Hive Design Inspirations
Honeycomb for The Hive Design Inspirations
 
CrossWalksInspirations for Brockville***
CrossWalksInspirations for Brockville***CrossWalksInspirations for Brockville***
CrossWalksInspirations for Brockville***
 
Hub Design Inspirations for B-Hive Zone
Hub Design Inspirations for B-Hive  ZoneHub Design Inspirations for B-Hive  Zone
Hub Design Inspirations for B-Hive Zone
 
Passive Interactive Programming and Surveys 2.pptx
Passive Interactive Programming and Surveys 2.pptxPassive Interactive Programming and Surveys 2.pptx
Passive Interactive Programming and Surveys 2.pptx
 
Hub Design Inspiration Graphics for inspiration
Hub Design Inspiration Graphics for inspirationHub Design Inspiration Graphics for inspiration
Hub Design Inspiration Graphics for inspiration
 
Hub Design Inspiration Graphics for Community Hubs
Hub Design Inspiration Graphics for Community HubsHub Design Inspiration Graphics for Community Hubs
Hub Design Inspiration Graphics for Community Hubs
 
Passive Interactive Programming and Surveys 2.pptx
Passive Interactive Programming and Surveys 2.pptxPassive Interactive Programming and Surveys 2.pptx
Passive Interactive Programming and Surveys 2.pptx
 
Hub Design Inspiration Graphics for Brockville Hub
Hub Design Inspiration Graphics for Brockville HubHub Design Inspiration Graphics for Brockville Hub
Hub Design Inspiration Graphics for Brockville Hub
 
Hub Design Inspiration Graphics second draft
Hub Design Inspiration Graphics second draftHub Design Inspiration Graphics second draft
Hub Design Inspiration Graphics second draft
 
Brockville-Active-Transportation-Full-Plan.pdf
Brockville-Active-Transportation-Full-Plan.pdfBrockville-Active-Transportation-Full-Plan.pdf
Brockville-Active-Transportation-Full-Plan.pdf
 
Draft Employment Lands 140530 L&G Front Cover.pdf
Draft Employment Lands 140530 L&G Front Cover.pdfDraft Employment Lands 140530 L&G Front Cover.pdf
Draft Employment Lands 140530 L&G Front Cover.pdf
 
BrockvilleHubDesignInspirationGraphics.pptx
BrockvilleHubDesignInspirationGraphics.pptxBrockvilleHubDesignInspirationGraphics.pptx
BrockvilleHubDesignInspirationGraphics.pptx
 
Caregiver Presentation and Product Inspirations Sep 2023 PDF.pdf
Caregiver Presentation and Product Inspirations Sep 2023 PDF.pdfCaregiver Presentation and Product Inspirations Sep 2023 PDF.pdf
Caregiver Presentation and Product Inspirations Sep 2023 PDF.pdf
 
Caregiver Presentation and Product Inspirations Sep 2023 PPT.pptx
Caregiver Presentation and Product Inspirations Sep 2023 PPT.pptxCaregiver Presentation and Product Inspirations Sep 2023 PPT.pptx
Caregiver Presentation and Product Inspirations Sep 2023 PPT.pptx
 
CEEED May 24 2023.pdf
CEEED May 24 2023.pdfCEEED May 24 2023.pdf
CEEED May 24 2023.pdf
 
CEEED May 24 2023.pptx
CEEED May 24 2023.pptxCEEED May 24 2023.pptx
CEEED May 24 2023.pptx
 
CEED Mindfulness in a time of Turbulence.pdf
CEED Mindfulness in a time of Turbulence.pdfCEED Mindfulness in a time of Turbulence.pdf
CEED Mindfulness in a time of Turbulence.pdf
 
CEEED Webinar June 22.pdf
CEEED Webinar June 22.pdfCEEED Webinar June 22.pdf
CEEED Webinar June 22.pdf
 
CIL Stats Workshop April1 2022 Abram Silk.pdf
CIL Stats Workshop April1 2022 Abram Silk.pdfCIL Stats Workshop April1 2022 Abram Silk.pdf
CIL Stats Workshop April1 2022 Abram Silk.pdf
 

Recently uploaded

Adversarial Attention Modeling for Multi-dimensional Emotion Regression.pdf
Adversarial Attention Modeling for Multi-dimensional Emotion Regression.pdfAdversarial Attention Modeling for Multi-dimensional Emotion Regression.pdf
Adversarial Attention Modeling for Multi-dimensional Emotion Regression.pdf
Po-Chuan Chen
 
Additional Benefits for Employee Website.pdf
Additional Benefits for Employee Website.pdfAdditional Benefits for Employee Website.pdf
Additional Benefits for Employee Website.pdf
joachimlavalley1
 

Recently uploaded (20)

Sha'Carri Richardson Presentation 202345
Sha'Carri Richardson Presentation 202345Sha'Carri Richardson Presentation 202345
Sha'Carri Richardson Presentation 202345
 
Introduction to Quality Improvement Essentials
Introduction to Quality Improvement EssentialsIntroduction to Quality Improvement Essentials
Introduction to Quality Improvement Essentials
 
UNIT – IV_PCI Complaints: Complaints and evaluation of complaints, Handling o...
UNIT – IV_PCI Complaints: Complaints and evaluation of complaints, Handling o...UNIT – IV_PCI Complaints: Complaints and evaluation of complaints, Handling o...
UNIT – IV_PCI Complaints: Complaints and evaluation of complaints, Handling o...
 
Palestine last event orientationfvgnh .pptx
Palestine last event orientationfvgnh .pptxPalestine last event orientationfvgnh .pptx
Palestine last event orientationfvgnh .pptx
 
The Art Pastor's Guide to Sabbath | Steve Thomason
The Art Pastor's Guide to Sabbath | Steve ThomasonThe Art Pastor's Guide to Sabbath | Steve Thomason
The Art Pastor's Guide to Sabbath | Steve Thomason
 
Salient features of Environment protection Act 1986.pptx
Salient features of Environment protection Act 1986.pptxSalient features of Environment protection Act 1986.pptx
Salient features of Environment protection Act 1986.pptx
 
NLC-2024-Orientation-for-RO-SDO (1).pptx
NLC-2024-Orientation-for-RO-SDO (1).pptxNLC-2024-Orientation-for-RO-SDO (1).pptx
NLC-2024-Orientation-for-RO-SDO (1).pptx
 
[GDSC YCCE] Build with AI Online Presentation
[GDSC YCCE] Build with AI Online Presentation[GDSC YCCE] Build with AI Online Presentation
[GDSC YCCE] Build with AI Online Presentation
 
Basic Civil Engg Notes_Chapter-6_Environment Pollution & Engineering
Basic Civil Engg Notes_Chapter-6_Environment Pollution & EngineeringBasic Civil Engg Notes_Chapter-6_Environment Pollution & Engineering
Basic Civil Engg Notes_Chapter-6_Environment Pollution & Engineering
 
Adversarial Attention Modeling for Multi-dimensional Emotion Regression.pdf
Adversarial Attention Modeling for Multi-dimensional Emotion Regression.pdfAdversarial Attention Modeling for Multi-dimensional Emotion Regression.pdf
Adversarial Attention Modeling for Multi-dimensional Emotion Regression.pdf
 
Synthetic Fiber Construction in lab .pptx
Synthetic Fiber Construction in lab .pptxSynthetic Fiber Construction in lab .pptx
Synthetic Fiber Construction in lab .pptx
 
Mattingly "AI & Prompt Design: Limitations and Solutions with LLMs"
Mattingly "AI & Prompt Design: Limitations and Solutions with LLMs"Mattingly "AI & Prompt Design: Limitations and Solutions with LLMs"
Mattingly "AI & Prompt Design: Limitations and Solutions with LLMs"
 
Solid waste management & Types of Basic civil Engineering notes by DJ Sir.pptx
Solid waste management & Types of Basic civil Engineering notes by DJ Sir.pptxSolid waste management & Types of Basic civil Engineering notes by DJ Sir.pptx
Solid waste management & Types of Basic civil Engineering notes by DJ Sir.pptx
 
How to Create Map Views in the Odoo 17 ERP
How to Create Map Views in the Odoo 17 ERPHow to Create Map Views in the Odoo 17 ERP
How to Create Map Views in the Odoo 17 ERP
 
Ethnobotany and Ethnopharmacology ......
Ethnobotany and Ethnopharmacology ......Ethnobotany and Ethnopharmacology ......
Ethnobotany and Ethnopharmacology ......
 
Additional Benefits for Employee Website.pdf
Additional Benefits for Employee Website.pdfAdditional Benefits for Employee Website.pdf
Additional Benefits for Employee Website.pdf
 
Forest and Wildlife Resources Class 10 Free Study Material PDF
Forest and Wildlife Resources Class 10 Free Study Material PDFForest and Wildlife Resources Class 10 Free Study Material PDF
Forest and Wildlife Resources Class 10 Free Study Material PDF
 
aaaaaaaaaaaaaaaaaaaaaaaaaaaaaaaaaaaaaaaaa
aaaaaaaaaaaaaaaaaaaaaaaaaaaaaaaaaaaaaaaaaaaaaaaaaaaaaaaaaaaaaaaaaaaaaaaaaaaaaaaaaa
aaaaaaaaaaaaaaaaaaaaaaaaaaaaaaaaaaaaaaaaa
 
NCERT Solutions Power Sharing Class 10 Notes pdf
NCERT Solutions Power Sharing Class 10 Notes pdfNCERT Solutions Power Sharing Class 10 Notes pdf
NCERT Solutions Power Sharing Class 10 Notes pdf
 
aaaaaaaaaaaaaaaaaaaaaaaaaaaaaaaaaaaaaaaaaaaaaaaaaaaaaaa
aaaaaaaaaaaaaaaaaaaaaaaaaaaaaaaaaaaaaaaaaaaaaaaaaaaaaaaaaaaaaaaaaaaaaaaaaaaaaaaaaaaaaaaaaaaaaaaaaaaaaaaaaaaaaa
aaaaaaaaaaaaaaaaaaaaaaaaaaaaaaaaaaaaaaaaaaaaaaaaaaaaaaa
 

Ala2012 bridge to somewhere

  • 1. Digital Bridge to Somewhere Stephen Abram Gale, Cengage Learning ALA, Anaheim June 2012
  • 2. COMMUNITY IMPACT Stephen Abram
  • 3. In Other Words… Meaningful and sustainable strategies based on the needs of your libraries and your communities.
  • 4. 6 Sustainable Library Strategies for 21st Century Libraries
  • 6.
  • 7.
  • 8.
  • 9.
  • 11. 1. Real Learning • Not random and opportunistic • Scalable and Repeatable • Attainable
  • 12. ed2go Overview Public Library Solutions February 2012
  • 13. What is Ed2Go for Libraries? • Ed2Go for Libraries is Life Long Learning in Action! • Ed2Go for Libraries delivers engaging, interesting online courses on a variety of popular topics with a subscription model designed for libraries. • Hundreds of courses • Expert instructors • Unlimited course registrations • Annual subscription
  • 14. A closer look: Product Specs • Ed2Go for Libraries • Expert instructors lead each course • Flexible course model that keeps students accountable and engaged • 12-lesson format • 20 - 24 course-hours over 6 weeks • Courses kick-off 3rd Wednesday of every month • Student discussion area with instructor interaction • Written in “conversational style” • Download a certificate of completion • Courses added monthly • Turn-key product administration for the library • Easy to track successful student outcomes • ed2go hosts robust website for library administrators packed with usage reports, site customization options, and customizable marketing collateral • Ed2Go Basic for Libraries • All the above MINUS 19 additional courses offering accredited continuing education credits
  • 17. Four Broad Categories Computers and Technology Personal Development Career and Professional Writing and Publishing 17
  • 19. 30+ Courses Added Annually • Web Design and • Advanced Microsoft • Courses for Teaching Professionals Programming Excel 2010 • Singapore Math Strategies: Advanced • Macintosh, iPhone, • Introduction to Model Drawing for Grades 6-9 and iPad Microsoft Word 2011 • Creating Classroom Centers Programming for the Mac • Creating WordPress • Introduction to • Websites II Photoshop CS6 • Personal Enrichment • Creating Mobile Apps • Introduction to Chemistry with HTML5 • Introduction to Biology • • Business Finance for Non-Finance • Computer Courses Personnel • Intermediate • Introduction to Digital Scrapbooking Microsoft Access • Introduction to Screenwriting 2010 • Introduction to • Managing Life as a Single Parent Microsoft Publisher • Living Well on a Budget 2010 • Publish and Sell Your E-Books • Introduction to Adobe Acrobat X 19
  • 20. Ed2Go 19 High Value Courses Advanced CompTIA A+ Certification Prep Basic CompTIA A+ Certification Prep Certificate in Complementary and Alternative Medicine Certificate in End of Life Care Certificate in Gerontology Certificate in Growth and Development Through the Lifespan Certificate in Holistic and Integrative Health Certificate in Integrative Mental Health Certificate in Issues in Oxygenation Certificate in Legal and Ethical Issues in Nursing Certificate in Pain Assessment and Management Certificate in Perinatal Issues Certificate in Spirituality, Health, and Healing CompTIA A+ Network+ Certification Prep CompTIA Â+ Security+ Certification Prep Intermediate CompTIA A+ Certification Prep PMP® Certification Prep 1 PMP® Certification Prep 2 20
  • 21. 2. Real Reading • eBooks and Beyond • The reading experience • Reviews, commentary, communities
  • 22.
  • 23. READING EXERCISE Why do people read?
  • 24. Why do people read? 1. To learn 2. To engage in hearing other’s opinions (to agree or disagree or understand) 3. To develop more knowledge about myself and develop as a whole person 4. To be entertained and laugh, to engage and interact 5. To address boredom and the inexorable progress of time 6. To research and keep up-to-date 7. To participate well in civil society (everything from news to voting) 8. To be informed (and maybe smarter) 9. To understand others (individually and culturally) 10. To escape our day-to-day lives 11. To stimulate the imagination and be inspired or spiritual 12. To write and communicate better through reading others 13. To teach 14. To have something to talk about 15. To connect with like-minded people
  • 25. 3 .Real Programs • Scalable • Repeatable • Staffed • Train the trainer • Aligned with collections and communities • Partnerships and Alliances
  • 26. 4. Real Technology • Experience Portals • eLearning • Mobile first • eBooks • Technology enhanced but not tech-centric spaces (gesture computing, holograms, laser tag, iPhone balls, Legobots, Smartboards, Cloud computing, monitors, etc.)
  • 27. 5. Real Stories and Measurements • Stop playing games
  • 28. Academic Libraries: Central Michigan University Grand Valley State University Public Libraries: Clinton Macomb Public Library Howell District Library Kent District Library Portage District Library
  • 29.
  • 30. • Goals? • Who are your potential partners and potential funders? (Who, What, Where, Why, When and How to reach them?) • GO AFTER STORIES! • Get the whole story (permissions) • Test your Story (brief, succinct, complete, upbeat, appropriate, personable, actionable) • Get your story out!
  • 31.
  • 32.
  • 34. The Present The Future The Past Letting People Letting People Building Libraries Know About Know What We and Collections Them Can Do For Them It’s All About It’s All About It’s All About Numbers Marketing Outcomes
  • 36. Why do people ask questions? Is your library experience conceptually organized around answers and programs? Or collections, technology and buildings?
  • 37. Why do people ask questions?  Who, What, When, Where  How & Why  Data – Information – Knowledge - Behavior  To Learn or to Know  To Acquire Information, Clarify, Tune  To Decide, to Solve, to Choose, to Delay  To Interview, Delve, Interact, Progress  To Entertain or Socialize  To Reduce Fear  To Help, Aid, Cure, Be a Friend  To Win A Bet
  • 38. Sample Charts of Top Library Questions Stephen Abram, MLS Gale Cengage Learning
  • 39. Advance Survey Data for the Library of Virginia Prepared by Stephen Abram and the Gale, Cengage Learning Statistical Analysis Research Team
  • 40. Reference Facet of the Library of Virginia Story September 2010 Survey Data 62 of 91 LVA library systems (68%)
  • 41. Respondent Role 0.0% 1.7% Senior Management Was Engaged! 25.0% Director / Management Team Reference Staff Circulation Staff Technology Staff 73.3%
  • 42. Respondent Experience 0.0% 5.1% You have deep Experience and 11.9% Talent.! Less than 1 year 1-5 years 6-10 years Over 10-years 83.1%
  • 43. Degree of Urbanization There was 18.2% Diversity of 21.8% Libraries in the sample. Urban Small Town Rural Regional Center / Consortia Staff 21.8% 38.2%
  • 44. Yep – You Get Questions • Health and Wellness / Community Health / Nutrition / Diet / Recovery DIY Do It Yourself Activities and Car Repair Genealogy Test prep (SAT, ACT, occupational tests, etc. etc.) Legal Questions (including family law, divorce, adoption, etc) Hobbies, Games and Gardening Local History Consumer reviews (Choosing a car, appliance, etc.) Homework Help (grade school) Technology Skills (software, hardware, web) Government Programs, Services and Taxation Self- help/personal development Careers (jobs, counselling, etc.) Reading Choices and recommendations, books & authors Travel and Vacation, Tourism Support Supporting College credits, Distance Education, and Adult Continuing Education Personal Finance and Investments / Financial Literacy Religion and spirituality Retirement and Seniors Services General Reference / Quick Answer Questions (e.g. telephone numbers, addresses, definitions, locations, library hours and services, etc.) Coming to America or our Community (Immigration, Moving) Book Clubs / Community Reading / Summer Reading Business. Leadership and Management Parenting and Child Development Adult Literacy / ESL Entrepreneurship and Consulting Small and Medium-sized Business Support World Cultures/Understanding Our World History Studies (Civil War, WW2, etc.) Choosing a School, Program/Degree, College or University / College Planning Finding People / Biographies , language learning
  • 45. Relative Patron Interest in Various Areas Finding People / Biographies Choosing a School, Program/Degree, College or University / College Planning History Studies (Civil War, WW2, etc.) World Cultures/Understanding Our World Small and Medium-sized Business Support Entrepreneurship and Consulting Adult Literacy / ESL Parenting and Child Development Business. Leadership and Management Book Clubs / Community Reading / Summer Reading Coming to America or our Community (Immigration, Moving) General Reference / Quick Answer Questions (e.g. telephone … Retirement and Seniors Services Religion and spirituality Personal Finance and Investments / Financial Literacy Supporting College credits, Distance Education, and Adult Continuing Education Travel and Vacation, Tourism Support Reading Choices and recommendations, books & authors Careers (jobs, counseling, etc.) Self-help/personal development Government Programs, Services and Taxation Technology Skills (software, hardware, web) Top 13 Homework Help (grade school) Consumer reviews (Choosing a car, appliance, etc.) Local History Hobbies, Games and Gardening Legal Questions (including family law, divorce, adoption, etc) Test prep (SAT, ACT, occupational tests, etc. etc.) Genealogy DIY Do It Yourself Activities and Car Repair Health and Wellness / Community Health / Nutrition / Diet / Recovery 0.00 0.20 0.40 0.60 0.80 1.00 1.20
  • 46. The Baker’s Dozen: LVA Top 13 1. Health and Wellness / Community Health / Nutrition / Diet / Recovery 2. DIY Do It Yourself Activities and Car Repair 3. Genealogy 4. Test prep (SAT, ACT, occupational tests, etc. etc.) 5. Legal Questions (including family law, divorce, adoption, etc) 6. Hobbies, Games and Gardening 7. Local History 8. Consumer reviews (Choosing a car, appliance, etc.) 9. Homework Help (grade school) 10. Technology Skills (software, hardware, web) 11. Government Programs, Services and Taxation 12. Self-help/personal development 13. Careers (jobs, counselling, etc.) 14. Readers Advisory was 14th
  • 47. Resource Levels for Top Ten Areas of Patron Interest (Question 1) Technology Skills (software, hardware, Internet/web) 51.7% 48.3% 0.0% Test prep (SAT, ACT, occupational tests, etc.) 58.3% 41.7% 0.0% Legal Questions (including family law, divorce, adoption, etc) 60.0% 35.0% 5.0% Genealogy 60.0% 31.7% 8.3% DIY Do It Yourself Activities and Car Repair 67.8% 30.5% 1.7% Enough Not Enough Homework Help (grade school) 72.9% 25.4% 1.7% Not Applicable Local History 75.9% 22.4% 1.7% Health and Wellness / Community Health / Nutrition / Diet / Recovery 81.7% 16.7% 1.7% Consumer reviews (choosing a car, appliance, etc.) 83.1% 15.3% 1.7% Hobbies and Gardening 88.3% 10.0% 1.7% 0% 10% 20% 30% 40% 50% 60% 70% 80% 90% 100%
  • 48. Student Homework Support - Level of Requests by Area 100% 0.0% 1.7% 0.0% 1.7% 0.0% 1.7% 1.7% 0.0% 1.7% 1.7% 3.4% 10.0% 11.7% 13.3% 13.3% 90% 22.0% 80% 20.0% 44.1% 70% 56.9% 43.3% 38.3% 38.3% 60% N/A 42.4% 35.0% Not at all Common 50% Slightly Common Common 40% Very Common 39.0% 30% 22.4% 45.0% 46.7% 46.7% 20% 32.2% 33.3% 12.1% 10% 11.9% 5.2% 3.4% 0% History / Social Studies Science / Science fairs) Biographies Special Events (Black (or Hispanic, Asian, Native American) Studies Month) Literature Women’s History Religion
  • 49. Areas of World Which Generate Most Questions 100% 0.00% 1.67% 0.00% 0.00% 1.75% 0.00% 1.67% 0.00% 1.89% 1.69% 0.00% 1.69% 0.00% 1.69% 6.90% 11.67% 17.24% 14.04% 17.24% 17.54% 90% 18.97% 23.33% 22.03% 28.30% 31.03% 30.51% 80% 39.66% 34.48% 42.37% 28.33% 70% 36.21% 41.38% 60% 47.37% 56.90% 57.89% 50% 50.00% 55.93% 49.06% 51.72% 40% 52.54% N/A 39.66% 38.33% 46.55% Not at all Popular 45.76% 30% Slightly Popular 37.93% 32.76% 22.81% Popular 20% Very Popular 14.04% 24.14% 20.00% 18.87% 16.95% 10.34% 10% 18.97% 20.00% 14.04% 15.25% 13.79% 10.53% 8.47% 6.90% 8.62% 6.90% 5.00% 3.39% 0% 1.72% 1.89% 0.00% 0.00% 1.69%
  • 50. The Strategic Collection Issue •List includes top 10 subjects for each group. •Most popular subject for each group is denoted by 10, least popular (within top 10) is denoted by 1. •Items that did not make the top 10 for a particular group are denoted by 0 for that group. •Since not all items were included in the top 10 of all groups, the sum of scores is taken across groups, rather than the average, to provide the overall rankings (higher being better). •The overall top 10 items are the same as those represented in the chart, but rank differs due to the fact that only 55 respondents are included above (others did not indicate a location type).
  • 51. Top Hobbies Survey From Stephen’s Lighthouse
  • 52. Top 12 Patron Hobbies Recreational Reading Cooking & Recipes Computers Movies & Film Exercise, Cycling & Walking Traveling, Tourism & Vacations Music Pets Gardening Television Shows Arts & Crafts Knitting & Needlecrafts 0 10 20 30 40 50 60 70 I made a mistake and left out photography as a hobby.
  • 53. Patron Hobbies - All Recreational Reading Cooking & Recipes Computers Movies & Film Exercise, Cycling & Walking Traveling, Tourism & Vacations Music Pets Gardening Television Shows Arts & Crafts Knitting & Needlecrafts Diet & Nutrition Religion & Spiritual Activities Genealogy Carpentry, Home Repair & Additions Antiques & Collectibles Video Gaming Volunteer Work Outdoor Life Creative Writing Cars, Motorcycles Board & Card Games Summer Sports Painting & Sculpture / Art Appreciation Adult Individual Sports Other Home Entertaining, Picnics & Parties Live Theatre Sewing Adult Team Sports Children's Sports Golf Woodworking Winter Sports Stamp collecting
  • 54. Other Hobbies 1 Bird Feeding 1 Genealogy Homesteading 5 1 Internet social games Learning to use my I-POD 1 Politics 1 Hiking 1 1 Photography/Photojournalism
  • 55. Other Hobbies Bird Feeding Genealogy Homesteading Internet social games Learning to use my I-POD Politics Hiking Photography/Photojournalism
  • 56.
  • 57.
  • 58.
  • 59.
  • 60. National Library Customer Satisfaction Data Specific Database Results from Usage Year One: Aug. 2009 – Sept. 2010 Sample: More up to date and local data is available
  • 61. What do we need to know? • How do library databases compare with other web experiences and expectations? • Who are our core virtual users? • What are user expectations for satisfaction? • How does library search compare to consumer search like Google? • How do people find and connect with library virtual services? • What should we ‘fix’ as a first priority? • Are end users being successful in their POV? • Are they happy? Will they come back? Tell a friend?
  • 62. Top-Level Benchmarks Gale-Cengage Browse Survey August 01, 2010 - August 31, 2010 90 90 90 89 90 90 90 90 90 88 87 87 85 84 78 77 71 75 76 73 74 74 72 72 72 71 Gale Library 70 68 70 69 65 62 Databases Compare 59 59 48 41 Very Well 48 30 30 to Other 30 33 37 30 30 Web Experiences 0
  • 63. Digging Into Satisfaction 3 4 5 9 6 8 7 2 1 Element High Univers/ Other, Other Middle ary School College please Profess- Profess- School School Student Student Librar’n specify Teacher ional or Student Student Overall Responses: 3,043 2,920 1,570 709 576 576 488 477 148 10,507 29% 28% 15% 7% 5% 5% 5% 5% 1% Content 70 77 79 69 Users will 77 74 67 68 40 73 Look and Feel Navigation 64 65 74 71 74 69 64 60 Return and 72 69 70 66 61 60 63 63 37 45 68 66 Search 61 73 73 60 Recommend 71 67 59 59 35 66 Site Performance 73 79 77 72 Once Hooked 77 76 68 72 52 75 Satisfaction 63 74 72 60 72 66 59 62 35 67 Likelihood to 72 82 85 71 82 78 66 69 36 76 Return Primary 63 73 68 56 70 60 51 60 33 65 Resource Recommend 63 78 83 66 80 72 63 61 36 71
  • 64. Gale-Cengage Browse Survey Priority Map October 01, 2009 - October 31, 2009 STATUS QUO REQUIRED MAINTAIN OR IMPROVE High Site Performance 74, 0.4 Content 73, 1.1 Library SCORE 72 Search Look and Feel 68, 0.4 Needs to Navigation 67, 0.9 Improve Search 67, 2.8 Low 62 0.2 Low MONITOR 1.2 TOP PRIORITY 2.2 High Key: Position of each bubble indicates its score and impact IMPACT Size of each bubble also indicates the relative size of impact
  • 65. Who uses e-Resources? High School Student 29% University/ College Student 28% Librarian The Core User 15% Other, please specify 7% For Library Teacher 5% E-Resources Other Professional 5% is Clear Professor 5% Middle School Student 5% Elementary School Student 1% 0% 5% 10% 15% 20% 25% 30% 35
  • 66. Gale-Cengage Browse Survey Did you find what you were looking for? August 01, 2009 - September 06, 2010 (N: 10486) Don't know yet 20% Database Users No Are Being 20% Yes Successful 60%
  • 67. Gale-Cengage Browse Survey Which search engine do you primarily use to do online research? August 01, 2009 - September 06, 2010 (N: 10486) Ask.com Yahoo.com 3% 6% Other, please specify 10% Google.com 81%
  • 68. Gale-Cengage Browse Survey What type of difficulty, if any, did you encounter with the navigation process on this website? August 01, 2009 - September 06, 2010 (N: 10486) Links/labels are Had technical difficulties difficult to understand (e.g. broken links, error 4% messages) 4% Too many links or navigational choices 5% There are Could not navigate back to previous information 8% Would often feel lost, not know where I was Training and Did not have any difficulty navigating the site Communication 8% 52% Other, please specify 9% Opportunities Links did not take me where I expected 10%
  • 69. Gale-Cengage Browse Survey What is your gender? August 01, 2009 - September 06, 2010 (N: 10484) Prefer not to respond 8% More Males Use Male 33% Library Databases Female 59% Than Usual
  • 70. Gale-Cengage Browse Survey What is your age? August 01, 2009 - September 06, 2010 (N: 10486) Prefer not to respond 7% 26-35 10% There is Not 18 and under 30% 19-25 11% A Demographic Swing in Online 36-50 19% Usage 51+ 23%
  • 71. Gale-Cengage Browse Survey Do you trust the content on this website more than the content you find through web search engines? August 01, 2009 - September 06, 2010 (N: 10486) No 9% Library Users Trust Library Haven't thought about it 18% Databases More. Yes 73%
  • 72. Gale-Cengage Browse Survey Which best describes the purpose of your research today? August 01, 2009 - September 06, 2010 (N: 10486) Just browsing Other, please specify 5% 6% Personal interest 10% School is the Sweet Spot – Professional project But Other Users 17% School assignment 62% Abound Too.
  • 73. Gale-Cengage Browse Survey Which best describes your role on this website today? August 01, 2009 - September 06, 2010 (N: 10486) High School Student 29% University/ College 28% Student Librarian 15% Library’s Other, please specify 7% Natural Allies Teacher 5% Are Big Users Other Professional 5% Professor & Potential 5% Middle School Student 5% Partners. Elementary School 1% Student 0% 5% 10% 15% 20% 25% 30% 35%
  • 74. Gale-Cengage Browse Survey How did you find out about this website? August 01, 2009 - September 06, 2010 (N: 10486) Other, please specify Web search 5% engine 3% Used in the past 7% Wow! Only 29% of Librarian Users Find 32% E-Resources Teacher 24% Through Our School or library website Websites. 29%
  • 75. Gale-Cengage Browse Survey How frequently do you use this website? August 01, 2009 - September 06, 2010 (N: 10486) Every 6 months or less 7% Daily 7% About once every 3 months And 39% of Your 8% Users Are in Your First time 36% Databases for About once a month 10% For the Very Several times a week Several times a month 14% First Time! 18%
  • 76. Gale-Cengage Browse Survey Recommend - Scores and Distributions August 01, 2009 - September 06, 2010 (Avg. Score: 71) Your Users Will Recommend Your Databases How likely are you to recommend this site to someone else? 12% 2%3%3% 5% 5% 7% 11% 14% 39% Avg Score: 7.4 N*: 10486 0% 20% 40% 60% 80% 100% * N values exclude "Don't Know" 1 2 3 4 5 6 7 8 9 10
  • 77. Gale-Cengage Browse Survey Primary Resource - Scores and Distributions August 01, 2009 - September 06, 2010 (Avg. Score: 65) Your Users Respect Your Databases How likely are you to As Primary use this site as your primary resource for your research needs? 12% 3% 4% 4% 6% 7% 10% 14%Sources 13% 27% Avg Score: 6.9 N*: 10486 0% 20% 40% 60% 80% 100% * N values exclude "Don't Know" 1 2 3 4 5 6 7 8 9 10
  • 78. Gale-Cengage Browse Survey Likelihood to Return - Scores and Distributions August 01, 2009 - September 06, 2010 (Avg. Score: 76) Your Users Are Likely to Return How likely are you to return to this site? 9% 2% 2% 4% 4% 2% 7% 11% 14% 46% Avg Score: 7.9 N*: 10486 0% 20% 40% 60% 80% 100% * N values exclude "Don't Know" 1 2 3 4 5 6 7 8 9 10
  • 79. Gale-Cengage Browse Survey Satisfaction - Scores and Distributions August 01, 2009 - September 06, 2010 (Avg. Score: 67) Your Users How does this site compare to your idea of Evaluate an ideal website? 10% 3% 4% 4% 7% 8% 13% 18% 15% 19% Avg Score: 6.8 N*: 10486 Your Services as Meeting Expectations. How well does this site meet your expectations? 10% 2%3% 4% 6% 6% 11% 18% 18% 22% Avg Score: 7.1 N*: 10486 What is your overall satisfaction with this site? 9% 2% 3% 5% 3% 7% 11% 18% 19% 23% Avg Score: 7.2 N*: 10486 0% 20% 40% 60% 80% 100% * N values exclude "Don't Know" 1 2 3 4 5 6 7 8 9 10
  • 80. Gale-Cengage Browse Survey Site Performance - Scores and Distributions August 01, 2009 - September 06, 2010 (Avg. Score: 75) Please rate the ability to load pages without getting error messages 7% 1% 2%3% 4% 2% 6% 14% 19% 42% on this site. Avg Score: 8 N*: 4659 Please rate the consistency of speed from page to page on 7% 1% 2% 5% 2% 6% 11% 19% 20% 28% this site. Avg Score: 7.7 N*: 4661 Please rate how quickly pages load on this site. 7% 1% 3% 5% 2% 5% 12% 18% 20% 27% Avg Score: 7.6 N*: 4660 0% 20% 40% 60% 80% 100% * N values exclude "Don't Know" 1 2 3 4 5 6 7 8 9 10
  • 81. Gale-Cengage Browse Survey Search - Scores and Distributions August 01, 2009 - September 06, 2010 (Avg. Score: 66) Please rate how well the search feature helps you to narrow the 11% 3% 4% 4% 6% 8% 12% 17% 15% 21% results to find what you want. Avg Score: 6.8… Please rate how well the search results help you decide what to 11% 2% 3% 4% 6% 8% 12% 18% 15% 21% select. Avg Score: 6.9 N*: 10486 Please rate the organization of search results on this site. 9% 2% 3% 5% 3% 7% 12% 19% 16% 24% Avg Score: 7.2 N*: 4659 Please rate the relevance of search results on this site. 9% 3% 3% 4% 6% 8% 11% 17% 17% 22% Avg Score: 7 N*: 4661 0% 20% 40% 60% 80% 100% * N values exclude "Don't Know" 1 2 3 4 5 6 7 8 9 10
  • 82. Gale-Cengage Browse Survey Navigation - Scores and Distributions August 01, 2009 - September 06, 2010 (Avg. Score: 66) Please rate the number of clicks to get where you want on this site. 10% 3% 6% 6% 7% 8% 11% 17% 13% 19% Avg Score: 6.6 N*: 4661 Please rate how well the site layout helps you find what you are 9% 2%3% 4% 6% 8% 13% 19% 16% 21% looking for. Avg Score: 7 N*: 4658 Please rate the options available for navigating this site. 9% 2%3% 4% 7% 7% 13% 20% 15% 21% Avg Score: 7 N*: 4663 Please rate how well the site is organized. 9% 1% 3% 6% 2% 6% 12% 21% 16% 24% Avg Score: 7.3 N*: 4661 0% 20% 40% 60% 80% 100% * N values exclude "Don't Know" 1 2 3 4 5 6 7 8 9 10
  • 83. Gale-Cengage Browse Survey Look and Feel - Scores and Distributions August 01, 2009 - September 06, 2010 (Avg. Score: 68) Please rate the readability of the pages on this site. 7% 1% 2% 5% 2% 5% 11% 19% 18% 30% Avg Score: 7.7 N*: 4659 Please rate the balance of graphics and text on this site. 8% 2%3% 5% 8% 9% 13% 19% 15% 20% Avg Score: 7 N*: 4658 Please rate the visual appeal of this site. 9% 2% 4% 5% 8% 10% 13% 16% 14% 20% Avg Score: 6.9 N*: 4663 0% 20% 40% 60% 80% 100% * N values exclude "Don't Know" 1 2 3 4 5 6 7 8 9 10
  • 84. Gale-Cengage Browse Survey Content - Scores and Distributions August 01, 2009 - September 06, 2010 (Avg. Score: 73) Please rate the freshness of content on this site. 9% 1% 3% 6% 2% 7% 12% 18% 18% 26% Avg Score: 7.4 N*: 4662 Please rate the quality of information on this site. 8% 1% 2% 4% 5% 2% 9% 18% 20% 31% Avg Score: 7.7 N*: 4661 Please rate the accuracy of information on this site. 8% 1% 2% 5% 4% 2% 8% 18% 22% 31% Avg Score: 7.8 N*: 4660 0% 20% 40% 60% 80% 100% * N values exclude "Don't Know" 1 2 3 4 5 6 7 8 9 10
  • 85. There’s Great News! We have Room for Improvement BUT Library Databases Compete Very Well with User Expectations and Needs Fulfillment.
  • 86. Gale-Cengage Browse Survey Future Behaviors with Satisfaction Trendlines August 01, 2009 - September 06, 2010 100 90 80 Score 70 60 50 40 Aug-09 Sep-09 Oct-09 Nov-09 Dec-09 Jan-10 Feb-10 Mar-10 Apr-10 May-10 Jun-10 Jul-10 Aug-10 Sep-10 Likelihood to Return 82 76 77 76 77 75 77 75 76 76 77 83 81 77 Primary Resource 69 63 64 66 65 64 67 65 65 65 64 68 66 63 Recommend 77 71 72 70 71 70 72 70 70 70 74 79 77 74 Satisfaction 70 66 68 67 68 65 68 66 67 67 68 72 71 67 Time Periods
  • 87. Gale-Cengage Browse Survey Elements with Satisfaction Trendlines August 01, 2009 - September 06, 2010 100 90 80 70 Score 60 50 40 Aug-09 Sep-09 Oct-09 Nov-09 Dec-09 Jan-10 Feb-10 Mar-10 Apr-10 May-10 Jun-10 Jul-10 Aug-10 Sep-10 Content 75 74 73 72 73 71 74 73 73 73 74 78 79 78 Look and Feel 71 69 68 68 68 67 68 68 68 68 72 76 74 70 Navigation 69 66 67 66 67 64 67 66 66 66 68 73 70 62 Search 70 66 67 66 66 65 67 66 66 66 69 72 72 68 Site Performance 78 75 74 74 75 73 75 75 75 77 82 80 81 81 Satisfaction 70 66 68 67 68 65 68 66 67 67 68 72 71 67 Time Periods
  • 88. Gale-Cengage Browse Survey Satisfaction Trendlines August 01, 2009 - September 06, 2010 100 90 80 Satisfaction Score 70 60 50 40 Aug-09 Sep-09 Oct-09 Nov-09 Dec-09 Jan-10 Feb-10 Mar-10 Apr-10 May-10 Jun-10 Jul-10 Aug-10 Sep-10 Satisfaction 70 66 68 67 68 65 68 66 67 67 68 72 71 67 Time Periods
  • 89. Gale-Cengage Browse Survey Number of Survey Respondents August 01, 2009 - September 06, 2010 1,800 The School 1,600 Cycle Drives 1,400 1,200 Many Usage Scenarios Number of Respondents 1,000 800 600 400 200 0 Aug-09 Sep-09 Oct-09 Nov-09 Dec-09 Jan-10 Feb-10 Mar-10 Apr-10 May-10 Jun-10 Jul-10 Aug-10 Sep-10 N 203 1,153 1,611 1,391 760 814 1,081 1,138 1,059 691 168 170 192 55 Time Periods
  • 90. Lego™ Pieces • Counter Sushi data • Database usage (unique user, session, length of session, hits, downloads, etc.) • Google Analytics • Foresee satisfaction and demographic data • Search Samples • ILS Data • Geo-IP data
  • 91.
  • 92.
  • 93.
  • 94. Summary 1. Real Learning 2. Real Technology: Social Tools and Experience Portals 3. Real Reading – not just eBooks 4. Context: Real Content Drives Programming 5. Real Questions Drive Program Portfolio 6. Statistics become Impact Measurements and Stories tell the story
  • 95.
  • 96. Stephen Abram, MLS, FSLA VP strategic partnerships and markets Cengage Learning (Gale) Cel: 416-669-4855 stephen.abram@cengage.com Stephen’s Lighthouse Blog http://stephenslighthouse.com Facebook: Stephen Abram LinkedIn / Plaxo: Stephen Abram Twitter: sabram SlideShare: StephenAbram1

Editor's Notes

  1. IntroductionHi everyone – I’m Kathy Gawronski – Director of Marketing for Gale Cengage Learning Thank you for having me today to talk a bit about how libraries can tell their stories - the stories of how they transform lives in the communities they serve
  2. So how do libraries tell their stories? Last fall we reported out on a study we completed -- working with MLA and the research division of Information Today. This study involved these pilot libraries in Michigan that would consider how the right quantitative measures combined with the a meaningful “story” could transform the conversation about libraries and lead to better funding and stronger support for libraries.
  3. What we found was that the libraries needed some help in compiling outcome-based stories that could be considered “Springboard Stories “ – these are the stories that are very impactful – Stephen Denning – author of “The Springboard” says they are “The stories that can spark a leap in understanding” – A guide was created that walks library staff through the process of collecting and promoting their “Springboard stories” – I have copies of the guide that you can take to use as a guide to create your own outcome-based stories (can work thru workbook together if time permits)
  4. In support of this project --A Facebook page has also been setup where all Michigan libraries can post outcome-based stories – It would be great if you could LIKe the page and make sure to post your stories there
  5. How libraries tell the story of the value they add to their communities has been changing. In the past the story was about building brick and mortar bulldings and buildings collections. We know today that all libraries are looking for creative ways to get the word about the resources available at libraries and the depth, breadth and quality of the resources. And we know libraries are looking to the future – looking for ways to let people know that what they find at the library can really impact their lives.