This document discusses air pollution in Uttar Pradesh, India, with a focus on Lucknow. Some key points:
- Lucknow is the 9th most polluted city in the world based on PM2.5 levels, and 4 cities in Uttar Pradesh are among the 10 most polluted in India.
- Major sources of air pollution in Lucknow are vehicles (87%), road dust (2%), garbage and agricultural burning (4%).
- Air pollution is a leading cause of death in India, with Uttar Pradesh having the most deaths attributed to air pollution in 2017 at 260,028.
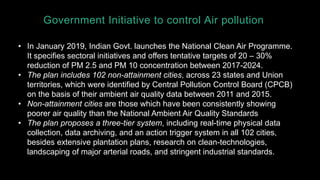
- The Indian government launched a National Clean Air Programme to reduce PM 2.5