Gasping for Fresh Air?
•Download as PPT, PDF•
0 likes•2,320 views

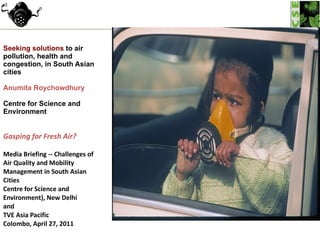
Seeking solutions to air pollution, health and congestion, in South Asian cities

Recommended
Recommended
More Related Content
What's hot
What's hot (20)
Similar to Gasping for Fresh Air?
Similar to Gasping for Fresh Air? (20)
Recently uploaded
Recently uploaded (20)
Gasping for Fresh Air?
- 1. Seeking solutions to air pollution, health and congestion, in South Asian cities Anumita Roychowdhury Centre for Science and Environment Gasping for Fresh Air? Media Briefing -- Challenges of Air Quality and Mobility Management in South Asian Cities Centre for Science and Environment), New Delhi and TVE Asia Pacific Colombo, April 27, 2011
- 2. Cities under global spotlight 1950-2006: Urban population of the world has increased from 739 million to 3.2 billion. By 2025 around 65 per cent of the world’s population is projected to live in cities. By 2010 more than 75 per cent of the world’s urban population will live in poorer countries ( State of the World 2007 ). More than 40 per cent of the world children are estimated to be living in polluted cities of developing world ( WHO ). A billion more will be added over the next three decades in Asia – almost adding a whole new India. More than half of them will be living in cities What about South Asia?
- 5. Right to clean air campaign: 1996
- 6. Imprint of growth Our lungs at risk CSE Poster
- 9. We dared to test the lung of our Chief Minister in the midst of an Auto Show in Delhi
- 10. Children demanded clean air from the Prime Minister
- 11. First generation reforms….. Soft options are now all exhausted Delhi has fought hard to get breathing space On vehicles Introduced low sulphur fuels and p etrol with 1 per cent benzene Mandated pre-mix petrol to two - and three-wheelers Moved from Euro I to Euro IV over the last decade Implemented largest ever CNG based public transport programme Capped the number of three-wheelers Phased out 15 year old commercial vehicles Strengthened vehicle inspection programme (PUC) Efforts made to divert transit traffic Set up independent fuel testing laborator ies to check fuel adulteration On industry Relocated polluting units Tighter controls on power plants. No new power plants. Air quality monitoring Adopted new ambient air quality standards Expanded air quality monitoring and reporting Other sources Emissions standards for generator sets Ban on open burning of biomass This now needs scale and stringent enforcement
- 12. Delhi got cleaner air: it avoided pollution CPCB reported 24% drop in PM10 levels in 2002 compared to 1996 levels.
- 13. Source: CSE: based on NAMP data, CPCB, and World Bank 2004 Evidence of action: Health Benefits Downward PM10 trend in some cities* have led to 13,000 less premature deaths and reduction in respiratory illness 1 * * * * * Lives saved: Delhi: 3,629 Hyderabad: 125 Kolkata: 3,293 Mumbai: 5,308 Chennai: 484
- 14. India: Proliferating pollution hotspots Source: Estimated based on CPCB data, comparison with residential area standard Half of the cities are critically polluted due to high PM10, even NO2 is rising in many of them – a twin trouble
- 15. Pollution hotspots: Cities with high NO2 levels in 2009 (Annual average concentrations in micrograms per cubic meter) Source: Based on “Most Polluted Cities, Government Of India, Ministry Of Environment And Forests, Lok Sabha, Unstarred Question No 1644, Answered On 04.08.2010” Cities with high PM10 levels in 2009 (Annual average concentrations in micrograms per cubic meter) Cities Name Annual average 1 Howrah 81 2 Asansol 62 3 Kolkata 56 4 Delhi 49 5 Jamshedpur 49 6 Raipur 46 7 Mumbai 42 8 Navi Mumbai 42 9 Jharia 41 Safe level 40 microgramme/cum Cities Name Annual average 1 Jharia 261 2 Ludhiana 254 3 Khanna 249 4 Delhi 243 5 Ghaziabad 236 6 Kanpur 211 7 Gobindgarh 206 8 Lucknow 197 9 Amritsar 190 10 Gwalior 187 11 Firozabad 187 12 Kolkata 187 Safe level 60 microgramme/cum
- 16. Delhi has lost its gains. After a short respite pollution curve turns upward RSPM Nitrogen dioxide Source: Based on CPCB data
- 17. Most locations in Delhi have Unhealthy levels of PM10, PM2.5 and NO2. CO level is also unhealthy for sensitive groups Ozone levels are moderately high in 5 locations Daily dose of poison in Delhi…
- 19. Annual average PM10 levels in Colombo Fort station (1998-2009) Source: Data of Central Environmental Authority (2010), cited in: Asian Development Bank and CAI–Asia Center. Knowledge management on air quality: Case studies. Mandaluyong City, Philippines: Asian Development Bank and CAI–Asia Center, 2010 Air quality in Colombo? Limited monitoring shows mixed trends in particulate matter and a dip
- 20. Nitrogen dioxide (Fort Station, 1997-2001) Source NOx problem is expected to grow. Reported to be high in high traffic areas already Colombo: N ewer problems Source: Sunil Chandrasiri, 2006,Health Impact Of Diesel Vehicle Emissions: The Case Of Colombo City University of Colombo
- 26. Our health must matter………….
- 27. The myth of safe air Ultrafine particles 0.65 microns Magnified 200,000 times How far tiny particles penetrate our lungs Our health is at serious risk……. Particulate matter: Special worries: Acute and chronic effects; Cause premature deaths. Studies show association of PM with mortality at much lower level (less than 50 microgramme per cum (HEI) WHO says -- no safe level Global evidences abound: Clinching evidences from American Cancer Society study that tracked effects in 600,000 people over 18 years. Observed large effects….-- A mere increase of 10 microgramme per cum of PM2.5 can increase the risk of lung cancer by 8%, cardiopulmonary deaths by 6%, all deaths by 4%. Other cocktail of pollutants -- A Killer mix : Ozone, Nitrogen oxides, hydrocarbons, Carbon monoxide…Air toxics: -- Aldehydes, formaldehydes, acetedehydes, benzene, 1,3 butadiene, metals, PAH etc……..Dangerous at trace levels
- 28. Scourge
- 29. Alveolar macrophage - biomarker of air pollution Exposed group; Kolkata taxi driverIncrease in AM number Larger AM – particle laden Control area: Sundarbans Source: CNCI More evidences…….
- 32. Pollution comes from a variety of sources…… Why are we specially worried about vehicles?
- 33. People living close to roads are most exposed to vehicular fume Evidence from Delhi…. Given the large number of people living within 300- 500 meters of a major road, the Panel concluded that exposures to primary traffic generated pollutants are likely to be of public health concern and deserve attention.
- 34. Vehicles: Significant contributor amongst the combustion sources in Indian cities ( CSE analysis ) Kanpur Bangalore Pune Chennai Delhi Mumbai If road dust is taken out from the PM10 inventory results – vehicles share increase dramatically to 83% in Chennai, 63% in Bangalore and 53% in Pune. Vehicles become the second major contributor in Delhi and Kanpur.
- 40. Indian metros today (Euro IV). But rest of the country Euro III Technology–lag in India
- 44. Check dieselisation of car segment Diesel’s increased market share is a reality in India Number of cars (by fuel type) in different weight categories as given in fuel economy database
- 45. One diesel car emits as much NOx as 3 to 5 petrol cars. PM is several times higher Source: MP Walsh NOx norms for cars PM norms for cars Why are we worried about dieselisation? License to Pollute Diesel cars are legally allowed to emit three times more NOx than petrol cars under the Euro norms Toxicity of diesel emissions
- 46. Toxic risk of diesel emissions NOx PM Toxics CO2 Emissions vs efficiency remains unresolved in India……………. Source ARAI
- 48. Breaking industry resistance with science Convoluting science “ ...(the) threshold for the onset of the health effects has not yet been detected for particulate emissions. This means that the safe levels have not yet been identified which is totally different from stating (as EPCA has done) that there is no safe level of particulate pollution.” — -Major automobile manufacturer, Supreme Court affidavit, October 99 WHO clarifies “ This interpretation is certainly not correct. Effects occur at any concentration. There is no threshold for the onset of the effects meaning that for each concentration of particulate matter, there are already observed effects, starting from the lowest concentration of about 10 microgrammes per cubic metre and going to 150-200 microgrammes per cubic metre.” — WHO Expert, October 99 The challenge Be on top of information to counter disinformation.
- 49. Countries are moving towards Clean diesel technology to reduce harmful diesel emissions drastically. But India is dieselising without clean diesel Source: ICCT What experts say? Do not replace a new petrol car with a diesel, unless they meet: • US Tier 2 or Euro 5 Standards • And ULSD is Available
- 51. CNG helped Delhi to leapfrog and fight poor quality diesel Source: Teri Euro II diesel bus emits nearly 46 times higher PM than Euro II CNG bus in India.
- 56. Vehicles make us more energy insecure…. Climate insecure……. Resolve efficiency vs emissions trade-off
- 57. Source: KCAI ASIA 2008 New generation challenge Pollution, energy guzzling and warming…
- 58. Vehicles threaten energy security in India Source: SIM Air Total vehicular CO2 emissions by categories in Kolkata --If the dependence on personal vehicles continues to increase in India, transport oil consumption will increase thrice by 2030 with largest increase expected from four wheelers.
- 65. MOBILITY CRISIS Cities are losing battle of car-bulge : The rapid increase in vehicles is destroying all gains of air pollution and health
- 66. It took 30 years to reach the first million mark for personal vehicles in 1971. Another 20 years to add two more million Then in 10 years (1981-91) increased by 14 million Another 10 years (1991-2001) – jumped by 28 million This decade just in four years (2001 to 2004) we have added 16 million Explosive numbers in India Source: Computed on the basis of MOSRTH motor vehicle registration data Vehicle registration in India : India’s urban population has grown 4.6 times, vehicle numbers have increased 158 times
- 67. Galloping vehicle numbers in Indian cities Vehicle registration in selected cities Source: Compiled from statistics by transport departments and Road transport year books of Ministry of road transport and highways, Delhi
- 69. Indian cities are paralyzed The Crawling Traffic Source: Anon 2008, Study on traffic and transportation policies and Strategies in Urban Areas in India, MOUD, p63 The average journey speed in Delhi (16 km/hr), Mumbai (16 km/hr) and Kolkata (18 km/hr): Abysmally poor compared to smaller cities
- 72. Vehicle Emissions vis-à-vis Speed Congestion leads to more pollution
- 74. Source: On the basis of Economic Survey, Delhi Govt Can building more roads help? Delhi has failed to solve the problem of congestion by widening road network …… We can never build enough roads
- 77. Source TRIPP, 2010 Strength of our cities….
- 79. This strength is reflected at the global level Modal split for passenger transport in selected countries *India Note 1: automobile include cars, two wheelers, IPT. Note 2: Passenger mobility in India relies heavily on rail and road. Passenger travel by air and water is negligible in comparison to rail and road. Source: 1. First Review of Available Data: Modal Split in Different Countries (2000), Fachgebiet Verkehrsplanung und Verkehrstechnik Prof. Dr.-Ing. Manfred Boltze Institut für Verkehr Fachbereich 13 Bauingenieurwesen und Geodäsie 2. CO2 EMISSIONS FROM PASSENGER TRANSPORT IN INDIA: 1950-51 TO 2020-21 Sanjay Kumar Singh, IIM Lucknow
- 80. Even with fewer vehicles congestion is very high. Why? Source: Compiled from SIM AIR, and MOUD report
- 81. Delhi Kolkata Bangalore Mumbai London -- In a typical city the core can just be 5 km across and easily walkable within a reasonable time. -- Studies show more than 40 to 50% of the daily trips in many cities have distances less than 5 kilometers. -- These have enormous potential to convert to walking and non-motorised trips. Source: Urban age Our cities are built differently High density, mixed land use, and narrow streets -- an opportunity to plan mobility differently
- 82. This slide has already begun in Delhi … .. Public transport losing ground Source: Anon 2008, transport demand forecast study: study and development of an integrated cum multi modal public transport network for NCT of Delhi, RITES, MVA Asia Ltd, TERI, September
- 84. Reality Check…. The Annual Average Growth in % in STU Bus Fleet (2000 to 2007) Source: Anon 2008, Study on traffic and transportation policies and Strategies in Urban Areas in India, MOUD Falling load factor In per cent
- 85. City bus corporations in India: In the red What ails bus transport? -- Unorganised – large number of small time operators -- Obsolete and poorly maintained fleet -- Routes not rationalised -- Poor level of service -- Lack of performance and service standards -- Lack of coordination between operating agencies All city governments are under pressure to reform the bus sector
- 87. But bus needs its space….. Bus caught in congestion is even more unattractive. You may ask – where is the space? But the current road space is used inefficiently. Look at Delhi. How much road space is wasted. Only one lane available to motorists.
- 88. Need equity in the usage of road space Reorganise the road space according to road users Bus Rapid Transport in Delhi: Right of the way segregated according to users --- bus users, walkers, cyclists and motorised vehicles. Bus speed increased from 11km/h to 19km/h. Benefits nearly 60% of road users. Delhi working on the next phase of the network. Nearly 400 km of BRT lanes sanctioned…..
- 90. Who must get the priority – People or Vehicle? Plan for people. Not vehicles. Chirag Delhi Junction Morning Peak Hour AK to MC 4,916 Vehicles 11,480 People Source: Dario Hidalgo study for CSE, 2008 Mimeo Understand the BRT corridor in Delhi…. -- -- Buses are 2% of the fleet but carries 55% of the trips -- Cars and two-wheelers are 75% of the fleet but carry 33% of the trip. -- Important to take buses out of congestion
- 91. Other governments are doing this as well……. Taipei Photos: Jason Chang, 2002
- 93. Delhi is developing guidelines for modal interchange location Delhi-- UTTIPEC/DDA guidelines Bus stop, cycle rental: within 50 meter level walk from station exit Cycle and two wheeler parking : within 100 meter level walk from station exit Auto rickshaw stand: within 150 meter level walk from station exit Private car/taxi/auto rickshaw “drop off”: with barrier-free of exiting pedestrians and NMT Pedestrian exits, bus-stops and Cycle-rickshaw stands must be closest to main pedestrian exits from station . Car parking i f provided, must be BEYOND 250 M distance of Station/ or PT interchange point Pairing of Origin-Destination (O-D) Nodes: Provide cycle/ auto stands at nearby important destinations. Signages at both end locations. Private car parking only at Terminal Stations. Discourage car parking at Stations within inner-city urbanized areas. Metro station/Public transport interchange point
- 94. Para transit : Small informal public transport -- autos, tempos, cycle rickshaws – Unique in South Asia ….Useful in closely built cities where most trips fall in 0 to 5 km range. Even big buses may not be convenient for such distances. Delhi is reorganising this sector: -- Technology upgrades : Replaced two-stroke engines with four-stroke engines; introduced CNG feet; Electric 3-wheelers -- Organisational changes: All three-wheeler drivers to get public service vehicle badge and smart cards. -- GPS connectivity to improve the meters and compliance. -- In-use vehicle fitness and emission testing systems --Integrate with mass transit system. -- Cycle rickshaw policy -- Public transport and para-transit must integrate not compete Uniqueness of the public transport in South Asian cities…. Mixed traffic – cycle rickshaws, tempos, auto-rickshaws, buses … but environmentally sustainable.
- 96. We built walkable cities…….Most people in our cities walk to work Substantial number of people in our cities walk to work….. 16-58% in our cities. In Delhi nearly half of education and even business trips are walk trips Walking and urban poor……. A great part of urban people live in low income localities and slums. Many of them are too poor to even take a bus…. Disability and walking…… Survey in Delhi shows 58% of the disabled people find steps, ramps, difficult to negotiate; 45% of elderly find steps and ramps daunting; 20% find uneven, narrow sidewalks difficult. Engineering guidelines for disables are not implemented Public transport can be successful only if our cities walkable: Urbanity and life style…… Co-relation between active transportation (walking and cycling) and obesity. China – 1.8kg weigh gain after and twice as likely to get obese for a Chinese who acquired a car. King County – people weigh 7 pounds less on an average in walkable neighbourhoods
- 97. Captive walker in poor neighbourhood ( Govindpuri and Zaffrabad) : Traffic and people on collision course….. - Discontinuous, poorly paved footpaths, and not easily accessible - Height and width of pavements violate norms - Poor signages, no pedestrian refuge islands -- crosswalks are ordeal - No kerbed ramps or blended crossings to access the crosswalk facilities - Exposure to traffic very high. Lessons from Delhi Poor walking infrastructure in Delhi Source: CSE
- 98. Mismatch in demand and supply Aurangzeb Road and Govindpuri We have counted 3 persons per 10 minutes in Aurangzeb Road and 100 person per five minutes in Govindpuri Urban planning does not keep people in focus Source: CSE
- 99. Cloverleaf flyover disrupt at-grade continuity and direct shortest route, increase walking distance for the ailing visitors using public transport At least in one direction use of subway is unavoidable Car infrastructure severing neighbourhoods and pedestrian routes (All India Institute of Medical Sciences intersection) Before After Source: CSE
- 100. Seamless and signal free traffic is interrupting shortest direct route for pedestrians. This is inciting jay walking Jay walking….asserting their right to cross where convenient But car centric design does not allow safe, quick and shortest crossing Sai Chowk, Patparganj Scindia House, CP Source: CSE
- 101. Unusable infrastructure: Wasteful Unusable infrastructure: Wasteful Guidelines of Indian Road Congress are inadequate Eg. In the absence of proper guidelines on height of pavements unacceptably high pavements without proper gradients are being made….. Source: CSE
- 102. Highly encroached walkways Don’t let cars take over walkways…..
- 104. Source: Pradeep Sachdeva It is possible to change Redesigned streets in a small town of Nanded in Maharashtra Before After
- 105. While car owners resent expansion of walk space ….. …public voice gets stronger for liveable walking city Public protest against PWD road-widening for the Commonwealth Games at Siri Fort to save the footpaths Need to change the practice Source:Times of India
- 106. Walking needs policy strategy Reform and enforce mandatory pedestrian guidelines for new roads as well as rebuild, beautification of existing roads – transform the entire city network Delhi has adopted pedestrian guidelines. These are the basis of approval of road projects infrastructure funding. Public transport plan needs linkage with pedestrian plan Urban local bodies must conduct periodic walkability and safety audits Legislate right to walk : Should we have comprehensive road users act? Need zero tolerance policy for accidents Involve communities on decisions on use of road space Need pedestrian network plan Adopt traffic volume reduction plan
- 107. Bicycles and cycle rickshaws – the ultimate zero emitters and feeders for multi-modal integration Bicycles are personal feeders to public transport, cycle rickshaws are zero emissions intermediate transport. Momentous court order in Delhi recently to protect these vehicles….. Enormous captive ridership of bicycles but declining in all Indian cities: 1980 - 2000: -- Bicycle ridership declined from 20% to 5% in Delhi; 45% to 35% in Nagpur; 33% to 18% in Indore; 3% to 16% tn Ahmedabad. Need well designed and safe NMT infrastructure under urban renewal missions programmes to induce NMT traffic Bus-bike integration: Delhi experiment with BRT- rented bicycles as optional feeders Need priority access to NMT. Eg. Delhi to implement bicycle master plan
- 110. Use parking policy to reduce demand for parking and cars. Influence commuter choice Source: CSE estimates based on CRRI report: (2006), New Delhi, Example from Delhi: Yawning gap between peak parking demand and supply and short fall Should we keep supplying more parking? Is that the solution? International experience shows just he opposite : Tokyo has highest car ownership in Asia – 350 cars per 1000 people. But its parking standards in commercial areas is 0.5 parking slots per 100 sqm. But Delhi with 84 cars per 1000people provides 3 parking slots per 100 sqm.
- 111. Understanding cost of multi level parking Example from Delhi Delhi the cost of providing multi level parking is nearly Rs 4 lakh to 6 lakh per car space. Accordingly parking fee should be Rs 30-39 per hour . But people are used to paying paltry sum. This is a hidden subsidy to rich car owners. BKM multi level parking HT multi level parking Parking and commercial Parking only Parking and commercial Parking only ECS 941 780 1,209 1,025 Cap. Cost Rs in lakh per ECS 4 4 4 4 Total Cost in lakhs (including cap, working, taxes etc) (Net Present Value) 5,290 (Rs 1672 per sq feet) 3,849 7,523 5,310 Revenue in lakhs (NPV) 6,724 4,168 9,352 5,574 IRR in % 12.68 12.67 12.68 12.69 Parking charges Rs 10/h Rs 30.25/h Rs 10/h Rs 39/h
- 112. Lesson from Mumbai: Discrepancy in rates can lead to underutilisation of parking structure INOX the multiplex in Nariman Point Before construction of MLP: No. of surface parking spaces: 140 , Utilisation: 100% during office hours After: No. of parking spaces: 540 , Utilisation during office hours: 10% Parking rates are Rs 5 per 30 minutes or Rs 10 per hour. Surface parking rates : Rs 5 per hour and Rs 3 for every additional hour. Poor utilization of multi level lot Source: Mumbai Environmental Social Network Need parity of rates between structured and surface parking Principles that must guide parking pricing Graded parking rates according to Peak hour, duration of stay; c ommercial importance of areas; Weekdays when demand is high and weekends when low. -- Fix parking rates at a level to influence commuter choice -- Higher rates at convenient places than the inconvenient places -- Limit parking duration for short term users. This can lead to higher customer turnover -- Free parking for cycles and cycle rickshaws and reduced/free rates for battery operated vehicles and public transport vehicles. -- Parking rates should be higher for big cars and SUVs
- 116. Delhi: Do we see any inconsistency here? Percentage share of allocation to transport Percentage share of public transport in total transport allocation Rationalise budgetary allocation
- 117. National urban renewal mission for transport in India: Disproportionate focus on roads In India National Urban Renewal Mission has a reform based funding scheme for transport. But….. The investment so far is heavily biased towards road infrastructure. More than 71% of the transport related projects are road related projects. Little on public transport and barely any in cycling and walking infrastructure. Funding ignores sustainable modes Source: CSE
- 118. Indian style socialism We tax our public transport more than cars… Correct distortions... Buses bear high tax burden than cars and two-wheelers. If lifetime tax is amortised then car pays roughly Rs 300 per year. But buses pay about Rs 13,000 per year – 43 times more than cars. Thus, penalised for carrying more passengers If bus fares are raised, a substantial public transport ridership can be lost to two wheelers with running cost of just Re 1/km For example -- Delhi with nearly the highest per capita income and car pays the lowest taxes.
- 119. India setting its reform agenda….. JNNURM mandates dedicated urban transport fund Identifies the following as the possible sources of funds that can act as a fiscal brake on car centric growth…… Waive off/reimburse all its taxes on urban buses and city bus service Need advertisement policy to tap newer source of revenues Need parking policy as a car restraint measure Additional cess on automotive fuels Additional registration fees on cars especially diesel cars and two-wheelers Annual renewal fee on driving license, vehicle registration Congestion tax
- 121. Make informed and sustainable choice Source: Report of the Committee on Sustainable Transport, Government of Delhi, 2002 In Delhi, Metro 1-1.5 million passengers/day (2010), Buses carry ~ 9 million passengers / day (2008) Criteria Bus rapid transit system Light railway Metro Passenger carrying capacity (peak hour peak direction trips) 10,000 to 25,000 More flexible 2,000 to 20,000 Fixed lines More than 40,000 Fixed lines Speed in km per hour 18 to 26 19 to 29 29 to 36 Capital costs per route kilometer (in Rs) 9 to 45 crore 45 – 135 crore 180 – 405 crore Operating costs (Rs per passenger km) 3.6 to 5.4 5.4 to 6.75 6.75 to 10.35
- 122. Learn from global approaches to tax reforms Annual registration or road fees on personal vehicles. US – Cars pay more taxes and also differentiates the tax according to engine size – fuel inefficient bigger cars pay more. Singapore – Road tax differentiated by engine size, fuel type Germany – Cars complying with older emissions standards pay more than the current standards. China has a range of taxes on vehicles – On purchase- Excise, VAT, Tariff, Vehicle acquisition tax On ownership – New car check out fee, License plate fee, Vehicle usage fee, Vehicle use – Insurance fee, Road maintenance fee, Consumption tax London, Singapore -- Direct fees for using roads and congestion. London reduced congestion by 26%. Increased in public transport ridership. There is no one silver bullet. Need a package of fiscal strategy to make the difference
- 123. Other governments calculate hidden Subsidies for Urban Car transportation and public funds for private transport Source ICLEI, Hidden Subsidies for Urban Car Transportation
- 124. Other global cities are dismantling car centric infrastructure……….
- 125. Our cities need upscaled transition Avoid future emissions Shift to sustainable modes of mobility Leapfrog technology Accelerate emissions standards roadmap Set fuel economy standards Opportunity to provide scaled up alternatives Upgrade and upscale public transport and integration Infrastructure for walking and cycling Reduce demand for travel and vehicle usage Integrate transportation with land-use planning Road pricing Tax rationalisation Parking policy and charges Fund the transition : Need tax measures to allocate resources efficiently and raise revenue. Taxes on public transport is 2.6 times higher. This needs support. Must not be allowed to fail.. Otherwise what???
- 126. Thank You…
Editor's Notes
- Entitlements built on per capita emissions A convergence principle towards a just and sustainable norm Trading allowed only after entitlements have been fixed
- ONLY ONE LANE BEING USED BY CARS
- Taipei has developed a bus lane network of 57 km since March 1998 (at an average cost of US$500,000 per kilometre), in the context of a wider policy framework emphasising: A network of dedicated bus lanes; High quality transfer environments; Green buses; Intelligent Transport System (ITS) applications, including innovative passenger information systems; Transit-oriented development. Taipei has pursued a number of innovative solutions to finding lane spaces for buses.
- ONLY ONE LANE BEING USED BY CARS
- ONLY ONE LANE BEING USED BY CARS
- ONLY ONE LANE BEING USED BY CARS
- ONLY ONE LANE BEING USED BY CARS
- ONLY ONE LANE BEING USED BY CARS
- ONLY ONE LANE BEING USED BY CARS
- ONLY ONE LANE BEING USED BY CARS
- ONLY ONE LANE BEING USED BY CARS