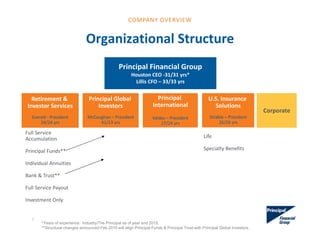
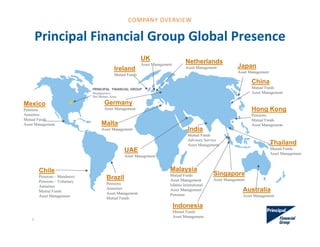
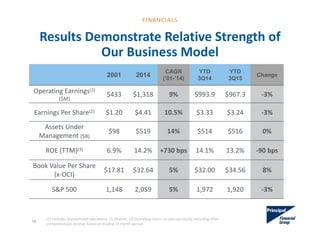
Principal Financial Group is a 136-year-old Fortune 500 company that provides retirement and investment services, asset management, and insurance solutions. It has $516 billion in assets under management from its divisions, which include Retirement and Investor Services, Principal Global Investors, Principal International, and U.S. Insurance Solutions. The company uses non-GAAP measures to evaluate performance alongside GAAP, and provides reconciliations between the two. It operates globally and has over 20 million customers.
The document discusses Principal Financial Group's use of non-GAAP financial measures in its financial reporting. It states that the company uses several non-GAAP measures that management believes are useful for investors to evaluate performance, but notes they are not a substitute for GAAP measures. The company provides reconciliations of non-GAAP measures to the most directly comparable GAAP measures. It also notes some operational measures used that do not qualify as non-GAAP financial measures.
This document provides highlights from Aimia's Q1 2017 results, including forward-looking statements about certain financial metrics for 2017. Such statements involve assumptions and are subject to risks and uncertainties that could cause actual results to differ materially. It also contains non-GAAP financial measures and reconciliations to GAAP measures. The document cautions that the assumptions used to make forward-looking statements about 2017 may prove incorrect or inaccurate.
Principal Financial Group reported strong second quarter 2015 earnings, with operating earnings up 11% year-over-year on a trailing twelve month basis. Key highlights included record assets under management of $540 billion, driven by $8.2 billion of net cash flows in the quarter. 87% of investment options were in the top two Morningstar quartiles over 1- and 3-year periods. The company also announced capital deployment for the year would be at the upper end of the $800 million to $1 billion range.
This document provides highlights from Aimia's Q4 2016 results, including forward-looking statements about Aimia's financial metrics and performance in 2017. It also defines and reconciles several non-GAAP financial measures used by Aimia to measure performance, such as adjusted EBITDA and free cash flow, noting that these measures are not comparable to similar measures used by other companies. Finally, it cautions that Aimia's forward-looking statements are based on assumptions that may prove to be incorrect and are subject to various risks and uncertainties.
The document provides highlights from Aimia's Q2 2017 results, including forward-looking statements about certain financial metrics for 2017. These statements involve assumptions that may prove to be incorrect. In addition, the statements do not reflect the potential impact of non-recurring items, transactions, or changes that could occur after the date of the document. Actual results could differ materially from the forward-looking statements. The document also contains non-GAAP financial measures and provides definitions and reconciliations to the most comparable GAAP measures.
The document summarizes Principal Financial Group's fourth quarter 2013 earnings call. It provides non-GAAP financial measures to help investors evaluate performance. All business segments saw increased revenue and earnings compared to fourth quarter 2012. Principal Global Investors saw strong performance fees while Principal International had favorable returns, offset by tax law changes. The company deployed over $480 million in 2013 through dividends, share repurchases, and acquisitions and expects $500-700 million in deployment in 2014.
Principal Financial Group reported strong financial results for the fourth quarter of 2014 and full year. Operating earnings per share increased 14% year-over-year for the quarter and normalized earnings per share grew 11%. For the full year, normalized EPS increased 15%. Business segments such as Retirement and Investor Services, Principal Global Investors, and Principal International experienced revenue growth and margin expansion over the trailing twelve months. Capital deployment in 2014 totaled $855 million, more than 75% of net income, and similar levels of capital return are expected in 2015.
Principal Financial Group reported third quarter 2015 earnings. Non-GAAP financial measures are used to illustrate ongoing operations and are reconciled to GAAP measures. Strong investment performance continued with 86% of funds in the top two Morningstar quartiles. Normalized operating earnings were $1.04 per share after adjusting for assumption reviews and asset impairments. Business segments like retirement services and Principal International reported earnings growth on both a reported and currency-adjusted basis.
This document provides an overview and summary of Principal Financial Group's third quarter 2016 earnings call. It discusses several key themes from the call, including strong investment performance across many of Principal's investment options, record assets under management, and continued growth in earnings and revenues despite accounting for significant variances. Business segments such as Retirement and Income Solutions, Principal Global Investors, and Specialty Benefits saw increases in revenues and earnings on both a reported and adjusted basis. Principal also continued deploying capital through dividends and share repurchases.
- The document discusses Aimia's Q1 2016 highlights and financial results. It provides forward-looking statements and cautions that actual results may differ materially from expectations.
- Gross billings decreased 3.7% to $573.0 million due to lost contracts, lower reward fulfillment activity, and wind downs, partially offset by new client wins. Adjusted EBITDA was $50.6 million.
- Key highlights included stability in Aeroplan's financial cards business, a new ISS win with Aeon Retail, and progress on Aimia's operating cost reduction initiatives.
This document highlights Aimia's Q2 2016 results and provides forward-looking statements about Aimia's financial metrics and performance in 2016. It cautions that these forward-looking statements are based on assumptions that may prove to be incorrect and are subject to various risks and uncertainties. It also notes that Aimia's actual results could differ materially from the forward-looking statements presented. The document defines various non-GAAP financial measures used by Aimia and refers readers to Aimia's MD&A for reconciliations of these measures to comparable GAAP measures.
This document provides a summary of Principal Financial Group's fourth quarter 2016 earnings call. It discusses strong financial results including record quarterly and annual after-tax operating earnings. Several business segments saw growth in assets under management, net cash flows, sales, and pre-tax operating earnings. The company also deployed capital through dividends, share repurchases, and debt restructuring to enhance financial flexibility and shareholder value. Non-GAAP reconciliations are provided in an appendix.
This document provides a summary of Principal Financial Group's second quarter 2013 earnings call. It discusses the use of non-GAAP financial measures to evaluate performance alongside GAAP measures. The company uses non-GAAP measures to illustrate normal ongoing operations, but also provides reconciliations to GAAP measures. It notes strong investment performance across many of its mutual funds and separate accounts. The document also summarizes key points regarding the company's accumulation and guaranteed retirement businesses, noting growth in net revenue and operating earnings for both segments compared to the prior year.
The document summarizes Principal Financial Group's third quarter 2017 earnings results. Some key points:
- Operating earnings were $374 million and operating EPS was $1.28. Excluding significant variances, EPS increased 16% year-over-year to $1.42.
- Assets under management reached a record $656 billion, with $5 billion in net cash flows during the quarter.
- 88% of investment options were in the top two Morningstar quartiles over five years.
- The company continued returning capital to shareholders through dividends and share repurchases.
Aimia reported its Q3 2016 highlights. Gross billings decreased 3.8% year-over-year but were down only 0.4% excluding foreign exchange impacts. Adjusted EBITDA increased to $60.5 million compared to $46.1 million in Q3 2015, with the margin expanding to 10.8% from 7.9%. Free cash flow before dividends paid was $86.7 million compared to $59 million driven by higher EBITDA, lower capital expenditures and tax refunds. On a trailing twelve-month basis, free cash flow per share increased over 20% to $0.55 compared to $0.67 in Q3 2015.
Principal Financial Group reported first quarter 2015 earnings. Operating earnings were up 3% year-over-year to $1.09 per share. Several business segments performed well. Retirement and Investor Services accumulation net revenue was up 7% over the past 12 months. Principal Global Investors revenue was up 1% over 12 months with record unaffiliated assets under management. Individual Life returned to expected claims experience. Specialty Benefits premiums and fees were up 9% over 12 months. Principal expects to deploy $800 million to $1 billion in capital in 2015 through dividends, share repurchases, and acquisitions.
Principal Financial Group uses non-GAAP financial measures to illustrate the performance of its normal, ongoing operations. These measures are consistent with what investors use to evaluate performance but are not a substitute for GAAP measures. Principal provides reconciliations of non-GAAP measures to the most directly comparable GAAP measure. It also uses some operational measures that do not have GAAP counterparts.
This document summarizes Principal Financial Group's earnings results for the first quarter of 2017. It discusses strong investment performance across funds, with over 80% in the top two Morningstar quartiles. It also discusses positive results in key business segments like Retirement and Income Solutions and Principal Global Investors, with revenue growth, strong cash flows, and continued strong investment returns. The document emphasizes that Principal is executing on its strategy to deliver sustainable, profitable growth through its diversified businesses.
This document provides key information from Principal Financial Group's second quarter 2016 earnings call:
- Principal reported its second highest quarterly after-tax operating earnings on record.
- Over 90% of Principal's investment options are in the top two Morningstar quartiles over three and five years.
- Principal continues to generate capital that it deploys to create shareholder value through dividends, share repurchases, and ownership in its boutiques.
- Principal's diversified business model positions it for long-term growth.
Principal Financial Group reported earnings results for the fourth quarter of 2017. While 2017 was a strong year overall with record non-GAAP operating earnings of $1.5 billion, fourth quarter results declined from the prior year quarter. The tax cuts and Jobs Act resulted in a $568 million benefit to net income. For 2018, the company expects to deploy $900 million to $1.3 billion of capital and announced an increase to the first quarter common stock dividend.
Principal Financial Group reported strong financial results for the first quarter of 2014, with record total company operating earnings and assets under management. Several business segments saw improved performance, including Retirement and Investor Services which saw growth in net revenue and margins. Principal Global Investors also had solid results with record assets under management. Principal International reported record operating earnings despite some macroeconomic headwinds. The company deployed capital through dividends, share repurchases, and debt redemption and expects full-year capital deployment to be at the high end of its $500-700 million target range.
This document provides highlights from Aimia's Q4 2015 results and includes forward-looking statements about Aimia's financial metrics and performance in 2016. It cautions that Aimia's statements involve assumptions that may prove to be incorrect and do not account for special items or new transactions. It also defines several non-GAAP financial measures used by Aimia to evaluate performance and measure compliance with debt covenants.
This document provides highlights from Aimia's Q3 2017 results, including forward-looking statements about certain financial metrics for 2017. Such statements involve assumptions and are subject to risks and uncertainties that could cause actual results to differ materially. Slides 13-14, 19, 27, 38-39, 41, 43 and 54 contain specific forward-looking statements about 2017 financial metrics, based on general economic assumptions that may prove incorrect. The document also contains non-GAAP financial measures and reconciliations to GAAP measures.
Principal Financial Group reported strong second quarter 2014 earnings. Some key points:
- Record total company operating earnings were up 19% over second quarter 2013.
- Approximately 90% of investment options are in the top half of Morningstar rankings over 3 and 5 years.
- Assets under management surpassed $518 billion, a record high.
- International operations grew operating earnings by 13% on a normalized local currency basis.
- The company continued strong capital deployment including a 31% increased dividend and $61 million in share repurchases in the quarter.
Owens Corning presented at various investor events in Q1 2017 to discuss their focus on shareholder value. The presentation included information on their three business segments (insulation, roofing, composites), financial results for 2016, and their investment thesis of having market leading businesses, improved portfolio/earnings/cash flow, and attractive macroeconomic drivers. It also included details on strategies around capital allocation, portfolio improvement enhancing margins, and financial profiles of the business segments.
SemGroup reported fourth quarter and full-year 2017 results. Key highlights include $111 million in Adjusted EBITDA for Q4 and $328 million for the full year. SemGroup also executed several strategic transactions including a $350 million preferred equity raise, selling its interest in Glass Mountain Pipeline for $300 million, and estimated proceeds of $140 million from selling SemMaterials Mexico and SemLogistics assets. SemGroup provided 2018 Adjusted EBITDA guidance of $385-$415 million and capital expenditures guidance of $40 million for maintenance spending.
The document provides an overview of The Principal Financial Group, a Fortune 500 company that offers retirement savings, investment, and insurance solutions. It discusses the company's non-GAAP financial measures and reconciliations, organizational structure with business segments, global presence across 18 countries, and 135 year history of experience in the financial services industry. Forward-looking statements and associated risks are also included.
In 3 sentences:
Aimia reported strong financial results for Q4 2014 and FY 2014, meeting or exceeding guidance across key metrics like gross billings and adjusted EBITDA. The Aeroplan program transformation delivered exceptional growth results but also impacted margins as expected due to factors like welcome bonus miles and marketing programs. While some challenges were expected from economic factors in certain regions, Aimia provided guidance for continued growth in 2015 supported by its global coalition programs and proprietary loyalty solutions.
EY Technical Line - update on non-GAAP financial measuresJulien Boucher
In the nearly six months since the SEC staff updated its Compliance and Disclosure Interpretations (C&DIs) on non-GAAP financial measures, the staff has focused on compliance with that guidance in its reviews of earnings releases and SEC filings. The clear message is that companies need to reevaluate their use and presentation of non-GAAP financial measures. This publication discusses the SEC staff’s main areas of focus in comment letters seeking compliance with the updated C&DIs, changes companies have made to their disclosures and challenges companies are encountering with their non-GAAP disclosures.
Anixter November 2016 Investor Presentationanixterir
This document provides an overview and summary of Anixter's business for investors. It discusses Anixter's strategic actions that have repositioned and strengthened the business, including acquisitions that have improved its geographic and product mix. The document then summarizes Anixter's business model, highlighting its leading market positions, strong supplier and customer relationships, competitive advantages, and counter-cyclical cash flow. It also provides overviews of Anixter's three business segments - Network & Security Solutions, Electrical & Electronic Solutions, and Utility Power Solutions - discussing quarterly performance, growth opportunities, and synergies from acquisitions.
This document provides an overview of Anixter Inc.'s business for investors. It summarizes Anixter's financial results for 2016, outlines its three business segments (Network & Security Solutions, Electrical & Electronic Solutions, and Utility Power Solutions), and discusses strategic actions taken to reposition and strengthen the business through acquisitions. It also reviews growth opportunities across segments, synergy targets from acquisitions, and goals around capitalizing on growth levers and delivering synergies to achieve long-term financial targets.
The document provides an overview of different sources of financial information that can be used for lending decisions and their relative strengths and weaknesses. It discusses management-prepared financial statements, CPA-prepared financial statements at different assurance levels (compiled, reviewed, audited), income tax returns, and other sources of data. CPA-prepared financial statements provide varying levels of assurance depending on whether they are compiled, reviewed, or audited. Compiled statements provide no assurance, reviewed provide limited assurance, and audited provide an opinion that the statements are not materially misstated. The costs for the different levels of CPA-prepared statements are also summarized.
This document provides an investor presentation for Anixter Inc. It includes:
- An overview of Anixter's business segments and key metrics for 2016.
- Details on strategic actions taken from 2014-2015 that transformed and strengthened the business through acquisitions and geographic expansion.
- An explanation of Anixter's business model strengths, including leading market positions, diverse suppliers and customers, barriers to entry, and digital marketing capabilities.
- Financial performance trends and targets for synergies and cost savings from acquisitions.
This document provides an investor presentation for Anixter Inc. It includes an overview of Anixter, details on its business model and key strengths, and financial performance. Anixter operates globally across three business segments: Network & Security Solutions, Electrical & Electronic Solutions, and Utility Power Solutions. It has a leading market position, strong supplier and customer relationships, and provides technical expertise and customized supply chain solutions. Anixter aims to drive organic growth above market levels and achieve $40 million in annual cost synergies by 2018 through integration of recent acquisitions.
This document discusses the usefulness and limitations of financial ratio analysis in evaluating a firm's performance. It begins by defining common ratios like liquidity, leverage, profitability, and valuation ratios. While ratios can help analyze statements, judge efficiency, locate weaknesses, and compare performance, the document notes they are limited by factors like inflation, seasonal changes, different industries, and conflicting ratios. However, the document argues ratios still serve an important role by facilitating analysis of financial statements, judging efficiency, locating weaknesses, formulating plans, comparing performance over time, and assessing operating efficiency. Therefore, despite limitations, financial ratio analysis remains an important tool for evaluating a firm's performance.
This document provides an overview of Anixter's business for investors, including:
- Anixter is a global distributor of network & security solutions, electrical & electronic solutions, and utility power solutions.
- Recent acquisitions have strengthened Anixter's business by improving its geographic and end market exposure.
- Anixter's business model relies on its leading industry positions, supplier and customer relationships, barriers to entry, and cash flow generation.
1) The document is Anixter's May 2017 investor presentation that provides an overview of the company, its business model, financial performance, and strategic actions taken to reposition itself.
2) Anixter transformed its business through acquisitions and divestitures from 2014-2015 that created a more focused portfolio, improved its geographic mix, and expanded its product and service offerings.
3) The company exceeded its synergy targets from integrating the acquisitions, with cumulative synergies of around $40 million expected by 2018 through revenue growth, gross margin expansion, and operating expense reductions.
EY - SEC reporting update - 2017 trends in SEC comment lettersJulien Boucher
Our SEC Reporting Update publication highlights the SEC staff’s increased focus on non-GAAP financial measures over the last year and discusses emerging topics such as the new revenue standard and cybersecurity. The publication also explains the nature of the staff’s common comments on segment reporting, income taxes and management’s discussion and analysis. It also notes the continuing trend for the SEC staff to issue fewer comment letters than in the previous year.
This document is an investor presentation for Anixter Inc. providing an overview of the company. It discusses Anixter's business model strengths including leading market positions, strong supplier and customer relationships, and competitive advantages. It also outlines Anixter's financial performance trends, capital allocation priorities, and operating results for the second quarter of 2017. The presentation provides details on Anixter's business segments and growth strategies with goals of achieving $40 million in cumulative synergies by 2018 through integration of recent acquisitions.
The document provides an overview of financial statement analysis, including the different types of analysis. It discusses internal and external analysis, short-term and long-term analysis, horizontal and vertical analysis. It also defines various accounting ratios used in analysis, such as liquidity ratios, profitability ratios, leverage ratios, and activity/efficiency ratios. Specific types of ratios discussed include the current ratio, debt-to-equity ratio, gross profit margin, and inventory turnover ratio. The document also covers limitations of financial statements and how to prepare horizontal and vertical analyses.
Aimia's Q2 2015 highlights document includes forward-looking statements about financial metrics for 2015 that are based on assumptions and subject to various risks and uncertainties. It also contains non-GAAP financial measures to provide additional metrics to evaluate performance. The document provides definitions and reconciliations for adjusted EBITDA, adjusted net earnings, adjusted net earnings per share, free cash flow, and other non-GAAP measures.
- Q3 2015 highlights document from Aimia provides forward-looking statements and cautions that actual results may differ materially from projections.
- It outlines Aimia's non-GAAP financial measures including Adjusted EBITDA and Adjusted Net Earnings which are used to evaluate performance but are not comparable to GAAP measures.
- The document reports Q3 2015 consolidated Adjusted EBITDA of $49.1 million, down from $63.9 million in Q3 2014, and updates 2015 guidance for lower Gross Billings and Adjusted EBITDA compared to previous targets.
This document defines key performance indicators (KPIs) and discusses how they are used. KPIs are quantifiable measures that help organizations track progress towards strategic goals. They are directly linked to overall company objectives and allow measurement of success. The document outlines several types of KPIs including process, input, output, leading, lagging, qualitative, and quantitative. It also provides examples of KPIs for different industries like shipping/logistics and infrastructure. Overall, KPIs help organizations evaluate performance, focus efforts, and make decisions to improve over time.
Metrics are quantitative measures used to evaluate performance. Key performance indicators (KPIs) are critical metrics chosen to measure progress towards organizational goals. KPIs can differ between companies and should be specific, measurable, achievable, relevant and time-bound. Implementing KPIs can be challenging as they require integrating metrics into a company's culture and processes, and managers may not understand limitations. A balanced scorecard approach uses metrics from financial, customer, internal business, and learning/growth perspectives for a more well-rounded evaluation.
The document discusses performance evaluation and control. It outlines the basic performance pyramid with mission, vision, goals/objectives, strategies, and success drivers at the top feeding into performance measures at the bottom. It emphasizes that performance measures should aim for the long-term and be forward-thinking. Both financial and non-financial measures are needed, with an emphasis on lead indicators over lag indicators. A comprehensive performance measurement system addresses financial performance, customer satisfaction, internal business processes, and organizational learning and growth.
Management accounting by unity tutorialsHARSH BAZAJ
Management accounting provides analysis of business activities for internal management use in facilitating decision making. It differs from financial accounting which presents accounting information for external stakeholders. Management accounting aids planning, decision making, problem identification, and strategy through tools like forecasts, budgets, variance analysis, and by presenting both financial and non-financial information regularly. Its benefits include profitability analysis, break even analysis, forecasting, new product analysis, and aiding financial accounting and management control.
Hemant Kumar has over 15 years of experience in finance, accounting, budgeting, and auditing roles in the healthcare sector. He has a strong track record of developing and implementing financial planning and budgeting systems, maintaining financial controls, and preparing financial reports. Currently, he works as a Senior Financial Associate at Mercer Consulting, where he is responsible for financial reporting, budget preparation, and analysis.
This document provides an overview of financial statement analysis. It begins by defining business analysis as the process of evaluating a company's prospects and risks, which includes analyzing its environment, strategies, and financial position. Financial statement analysis is then introduced as applying analytical tools to financial statements to derive useful estimates for business analysis. The chapter outlines the major components of business analysis and the role of financial statements. It previews various tools for financial statement analysis, including comparative analysis, ratio analysis, and cash flow analysis. The objectives are to explain the relationship between financial statement analysis and business analysis, describe how financial statements reflect business activities, and introduce basic analysis techniques.
- Principal Financial Group reported third quarter 2019 non-GAAP operating earnings of $345 million and earnings per share of $1.23.
- Results were impacted by an annual actuarial assumption review that lowered earnings by $39.8 million across business units. Higher expenses also lowered earnings by $10.7 million.
- The acquisition of Wells Fargo's retirement business closed on July 1st, adding $876 billion in assets under administration. Integration is on track.
Principal Financial Group reported its second quarter 2019 earnings results. Some key highlights included:
- Non-GAAP operating earnings of $427M, up 9% from the second quarter of 2018.
- Record assets under management of $696B for the company.
- The company continued to deploy capital through acquisitions totaling $1.2B and common stock dividends of $150M in the second quarter.
- For the third quarter of 2019, the company announced a common stock dividend of $0.55 per share, a 4% increase over the third quarter of 2018.
- Principal Financial Group reported first quarter 2019 earnings results on April 25, 2019
- Key highlights included non-GAAP operating earnings of $400 million and $1.43 per share, driven by better than expected equity market performance and higher actual versus expected encaje performance
- The company continued deploying capital through $150 million in common stock dividends and $130 million in share repurchases while announcing the planned acquisition of Wells Fargo's institutional retirement and trust business
This document summarizes Principal Financial Group's fourth quarter 2018 earnings results. It provides key financial metrics including record full year 2018 non-GAAP operating earnings of $1.6 billion, up 8% over the prior year. It discusses significant variances that impacted 4Q18 results, including higher DAC amortization from equity market performance and lower than expected performance in Brazil. The document also provides details on the company's investment performance, asset management business results, and retirement and income solutions business results.
The document summarizes Principal Financial Group's third quarter 2018 earnings results. Some key points:
- Non-GAAP operating earnings were $481 million, down from the prior year primarily due to actuarial assumption changes and variable investment income.
- Assets under management totaled $668 billion. Net cash flows were $0.2 billion.
- Segments like Retirement and Income Solutions saw higher revenue offset by increased expenses including from digital investment. Fixed annuities and pension risk transfer sales remained strong.
- Principal Global Investors benefited from an accelerated real estate performance fee but also had elevated expenses.
The document provides financial results and highlights from Principal Financial Group's second quarter of 2018. Some key points include:
- Non-GAAP operating earnings of $391 million and earnings per share of $1.35.
- Assets under management of $667 billion despite $16 billion in foreign exchange headwinds.
- Business fundamentals remain strong, with continued capital deployment to create shareholder value through share repurchases, dividends, and mergers and acquisitions.
The document provides an earnings summary for Principal Financial Group for the first quarter of 2018. Some key highlights include:
- Record quarterly non-GAAP operating earnings of $409 million and earnings per share of $1.40.
- Record assets under management of $674 billion despite $1.5 billion in net cash outflows.
- The company deployed $410 million in capital through share repurchases, dividends, and mergers and acquisitions.
- Business segments like Retirement and Income Solutions, Principal Global Investors, and Principal International saw increased revenues and earnings compared to the prior year quarter.
The document provides an agenda for an investor workshop on December 7, 2017. The agenda includes presentations on Principal's spread and risk businesses, capital management, and a panel Q&A session. It also includes forward-looking statements and discusses the use of non-GAAP financial measures.
Principal Financial Group reported second quarter 2017 earnings results. Some key highlights included:
- Record quarterly operating earnings of $384 million and record quarterly operating earnings per share of $1.31.
- Assets under management reached a record high of $629 billion, despite negative net cash flows in the second quarter.
- Over 80% of investment options performed in the top two Morningstar quartiles over three and five-year periods, demonstrating strong investment performance.
- The company continued to deploy capital through dividends, share repurchases, and increased ownership in a PGI boutique, while announcing a 15% increase to the third quarter dividend.
The document discusses Principal Financial Group's use of non-GAAP financial measures to evaluate performance. It states that these measures are useful to investors but are not a substitute for GAAP measures. It also notes that the company provides reconciliations of non-GAAP measures to the most directly comparable GAAP measures. The document also distinguishes non-GAAP measures from other operational measures used by the company that do not have GAAP counterparts.
The document discusses Principal Financial Group's use of non-GAAP financial measures to evaluate performance. It states that these measures are useful to investors because they illustrate the company's normal ongoing operations, but are not a substitute for GAAP measures. It also notes that the company provides reconciliations of non-GAAP measures to the most directly comparable GAAP measures. The document also distinguishes non-GAAP financial measures from other operational measures that do not have GAAP counterparts, such as assets under management.
The document discusses Principal Financial Group's use of non-GAAP financial measures to evaluate performance. It states that these measures are useful to investors as they illustrate normal ongoing operations, but are not substitutes for GAAP measures. It also notes that the company provides reconciliations of non-GAAP measures to the most directly comparable GAAP measures. The document also distinguishes non-GAAP financial measures from other operational measures that do not have GAAP counterparts, like assets under management.
This document summarizes Principal Financial Group's first quarter 2016 earnings call. Some key points:
- Outstanding investment performance with over 90% of investment options in the top two Morningstar quartiles.
- Record assets under management of $548 billion with $3.3 billion in net cash flows for the quarter.
- Deployed $196 million in capital through share repurchases and dividends. Announced an increase in the second quarter dividend.
- Underlying fundamentals remain strong despite macroeconomic headwinds.
This document provides a summary of Principal Financial Group's fourth quarter 2015 earnings call. It discusses Principal's use of non-GAAP financial measures to evaluate performance alongside GAAP measures. The document also highlights themes from the earnings call, including strong investment performance, work on the Department of Labor regulation, and segment results for Retirement and Income Solutions and Principal Global Investors. Forward-looking statements are presented along with risks that may affect future performance.
Principal Financial Group held an investor workshop on November 6, 2015 to discuss the company's strategy and integration of its retail and institutional investment platforms. Principal Global Investors manages $354 billion in assets across equity, fixed income, alternatives, and other asset classes through a global network of offices. The company aims to drive growth through top-tier investment performance, offering the right active strategies, and leveraging its multi-channel distribution network.
The document discusses Principal Financial Group's use of non-GAAP financial measures to evaluate performance. It states that these measures are useful for investors to understand the company's normal operations, but are not a substitute for GAAP measures. The company provides reconciliations between non-GAAP and GAAP measures. Management also uses non-GAAP measures for goal setting and compensation.
Principal Financial Group reported first quarter 2015 earnings. While operating earnings grew 16% over the last twelve months, the company faced macroeconomic pressures. Several metrics demonstrated strong performance, including return on equity of 14.0% and 85% of investment options in the top half of Morningstar rankings. Total assets under management reached a record $530 billion, up from $173 billion a year ago. The earnings call highlighted continued strong investment performance, operational excellence in areas like client satisfaction, and new product innovations. Normalized earnings per share grew 5% compared to the first quarter of 2014.
UnityNet World Environment Day Abraham Project 2024 Press ReleaseLHelferty
June 12, 2024 UnityNet International (#UNI) World Environment Day Abraham Project 2024 Press Release from Markham / Mississauga, Ontario in the, Greater Tkaronto Bioregion, Canada in the North American Great Lakes Watersheds of North America (Turtle Island).
Methanex is the world's largest producer and supplier of methanol. We create value through our leadership in the global production, marketing and delivery of methanol to customers. View our latest Investor Presentation for more details.
Cleades Robinson, a respected leader in Philadelphia's police force, is known for his diplomatic and tactful approach, fostering a strong community rapport.
ZKsync airdrop of 3.6 billion ZK tokens is scheduled by ZKsync for next week.pdfSOFTTECHHUB
The world of blockchain and decentralized technologies is about to witness a groundbreaking event. ZKsync, the pioneering Ethereum Layer 2 network, has announced the highly anticipated airdrop of its native token, ZK. This move marks a significant milestone in the protocol's journey, empowering the community to take the reins and shape the future of this revolutionary ecosystem.
8. Name Age* Title (Industry/PFG)*
Daniel J. Houston 54 President & Chief Executive Officer 31/31
Nora M. Everett 56 President ‐ Retirement & Investor Services 24/24
James P. McCaughan 62 President ‐ Global Asset Management 41/13
Deanna D. Strable 47 President ‐ U.S. Insurance Solutions 26/26
Luis E. Valdes 58 President ‐ International Asset Management and Accumulation 27/24
Timothy M. Dunbar 58 Executive VP & Chief Investment Officer 34/29
Terrance J. Lillis 63 Executive VP & Chief Financial Officer 33/33
Gary P. Scholten 58 Executive VP & Chief Information Officer 35/35
Karen E. Shaff 61 Executive VP, General Counsel & Secretary 33/33
Rex Auyeung 63 Chairman ‐ Principal Financial Group – Asia 38/21
David M. Blake 49 Senior Executive Director & Head Global Fixed Income 26/15
Elizabeth S. Brady 55 Senior VP & Chief Marketing Officer 31/2
Ned A. Burmeister 56 Senior VP & COO – Principal International 36/36
Gregory J. Burrows 53 Senior VP ‐ Retirement & Investor Services 29/29
Gregory B. Elming 55 Senior VP & Chief Risk Officer 33/33
Amy C. Friedrich 45 Senior VP – Specialty Benefits Division 18/15
Patrick G. Halter 56 Senior Executive Director – Principal Real Estate Investors 31/31
Julia M. Lawler 55 Senior Executive Director ‐ Multi Asset Allocation 33/31
Gregory A. Linde 59 Senior VP – Individual Life 36/23
Barbara A. McKenzie 55 Senior Executive Director & COO – Boutique Operations 31/31
Dennis J. Menken 52 Senior VP & Chief Investment Officer – Principal Life 21/21
Gerald W. Patterson 49 Senior VP ‐ Retirement & Investor Services 27/14
Elizabeth L. Raymond 49 Senior VP & Chief Human Resources Officer 24/15
Angela R. Sanders 52 Senior VP & Controller 26/26
Ellen W. Shumway 52 Senior Executive Director – Strategy & Boutique Operations 25/10
Roberto A. Walker 50 Senior VP & President, Principal Financial Group – LatAm 26/19
*As of 12/2015
8
Experienced Management Team
COMPANY OVERVIEW
9. Retirement and Investor Services
•#3 provider of DC plans1
•#1 provider of DB plans2
•#1 provider of ESOP plans3
•#6 manager of Target Date Funds4
Industry Leadership
Sources: 1 PLANSPONSOR Recordkeeping Survey, June 2015, 2 PLANSPONSOR Defined Benefit Administration Survey, May 2015; 3 PLANSPONSOR
Recordkeeping Survey, June 2015; 4 In the United States. Strategic Insight Lifecycle FlowWatch report July 2015; 5Pensions & Investments, “The Best
Places to Work in Money Management among companies with our size category”, PFG recognition 12/08/2014. 6 Managers ranked by total worldwide
real estate assets (net of leverage), as of June 30, 2015. “Largest Real Estate Managers”, PENSIONS & INVESTMENTS, October 19, 2015.; 7Managers
ranked by U.S. institutional, tax‐exempt assets managed internally, as of 12/31/14, “Largest Money Managers”, Pensions & Investments, May 2015.
8Commercial Property Executive Published April 2015 “2015 Greenest CRE Companies” list”. 9Fenaprevi, March 2015; 10Asociacion de Administradóras
de Fondos Mutuos De Chile, 10/2014; 11Lipper. Percentage of market share as of 12/2014; 12Towers Watson. Based on AUM as of 09/2014; 13CONSAR &
PROCESAR, October 2014; 14PLANSPONSOR NQDC Buyer’s Guide, July 2015; 15LIMRA 2015 survey: Non‐medical based on fully insured employer
contracts in force. 16 LIMRA 2014 survey: Individual Disability Insurance (IDI) rank based on in‐force policies
Principal Global Investors
•Best Place to Work in Money
Management 5
•Top 10 manager Real Estate 6
•15th largest manager High Yield7
•#4 Greenest CRE Company8
Principal International
•#1 market share – Brazil (Brasilprev)9
•#1 APV – Chile10
•#2 asset management – Malaysia11
•Top ten MPF provider – Hong Kong12
•#5 AFORE – Mexico13
U.S. Insurance Solutions
•#1 Non‐qualified deferred
compensation14
•#4 Non‐medical coverages15
•#5 IDI coverages16
9
COMPANY OVERVIEW
10. Financial Strength:
Current Ratings
(as of October 2015)
• Moody's Investors Service
'A1', Good – fifth highest of 21
rating levels.
Outlook: Stable
• FitchRatings
'AA‐‘, Very Strong ‐ fourth highest of
19 rating levels.
Outlook: Stable
• Standard & Poor's
‘A+’, Strong ‐ fifth highest of 24
rating levels.
Outlook: Stable
• A.M. Best
'A+', Superior ‐ second highest of
16 rating levels.
Outlook: Stable
Ratings related to Principal Life Insurance Company and Principal National Life Insurance Company.10
COMPANY OVERVIEW
19. 1.9%
4.5% 4.2%
3.1%
6.7%
18.1%
12.5%
8.5%
2011 2012 2013 2014
Industry net flows Principal Funds net flows
1.0%
0.7%
0.3%
-0.9%
3.5%
6.3%
1.7%
0.4%
2011 2012 2013 2014
401k Industry net flows Principal FSA net flows
Full Service Accumulation (FSA)
Net cash flows as % of beginning of year assets 2011‐2014. Sources of industry data: 401(k) industry – Department of Labor & Cerulli
Associates 2014 (for 2014, industry 401(k) is an estimate); Funds – Strategic Insight Mutual Fund Industry Review (long‐term funds).
Principal Funds net flows represent long‐term funds only.
Net Cash Flow Consistently
Outpaces Industry
Principal Funds
19
RETIREMENT AND INVESTOR SERVICES
20. TOP SELLING FUNDS
TTM
3Q15
MidCap Fund $3.1B
Global Diversified Income $2.9B
Preferred Securities $2.1B
High Yield Fund $1.8B
Sam Portfolio Combined $1.5B
TOTAL FOR TOP 5 $11.3B
ASSET ALLOCATION LEADERSHIP
• #6 largest lifecycle fund manager*
• Target date & target risk
• Multi‐manager solutions
• Portfolio construction strategies:
*Based on $41.4B in assets Strategic Insight 6/30/15 Lifecycle Report
Needs‐Driven Investment Solutions
Broad and unique asset allocation strategies
20
RETIREMENT AND INVESTOR SERVICES
Principal Funds
23. Driving Industry Recognition
and Advisor Engagement
16th largest advisor-sold fund family(1)
Best Global Real
Estate Fund Over
the 5-Year Period
23
(1) Strategic Insights Mutual Fund Management Companies Rankings and Analysis, September 2015
#3 for Small Plan
Investment Options
with Strong
Performance
RETIREMENT AND INVESTOR SERVICES
Principal Funds
2014 Best Mutual Fund Families:
#5 Ranking
25. Innovative Solutions:
Solving Income Needs
ACCUMULATION
OUR APPROACH:
• Education
• Planning assistance
(RetireSecure®)
• Full array of options
• Innovative solutions
MULTI‐PRODUCT
SOLUTION SET
•“Through Retirement” Lifecycle Funds
•Mutual Funds that:
‒Generate income
‒Preserve capital
‒Protect against inflation
‒Address market volatility
•Annuities to provide:
‒Fixed returns
‒Guaranteed income
‒Protection against volatility
•Bank products
•Full Service Payout
‒Defined Benefit plan terminations
RETIREMENT
INCOME
25
RETIREMENT AND INVESTOR SERVICES
26. INDIVIDUAL LIFE
•Non‐Qualified Plans* 13.9% #1
•Total Life New Sales Premium 1.7% #19
SPECIALTY BENEFITS
•Total Group In‐Force Contracts 7.1% #4
‐ Life 9.5% #3
‐ Disability 7.1% #5
‐ Dental 5.0% #8
•Individual Disability
In‐force Premium
8.4% #5
•Individual Disability
New Sales Premium
15.8% #3
Success Reflects Expertise Serving SMB Market
2014
Industry
Rank
2014
Market
Share
26
Nonqualified Plans ranking from PLANSPONSOR Buyers Guide Survey, July 2015. All other rankings are from LIMRA 2013/2014.
*Excludes governmental 457 plans.
U.S. INSURANCE SOLUTIONS
28. 5.0%
9.4%
3.1%
1.9%
Group Benefits Individual DI
The Principal Industry
Dental/
Vision
47% Group
Life
27%
Balanced Portfolio
plus Above Industry Premium Growth
2014 Total Premium & Fees
3 Year In‐Force Premium Growth
(2011 – 2014 CAGR)
Group
Benefits
83%Individual
Disability
17%
Group
Disability
26%
28
U.S. INSURANCE SOLUTIONS
•Stable loss ratios
•Attractive margins
•ROE of 14% +
Industry source: LIMRA 2011‐2014
29. U.S. Distribution Overview
PRINCIPAL
CONNECTION
• 70 counselors
with focus on
education
CAREER
• 1,000 agents
• Sell all products
• Career places
80‐85% of sales
within The
Principal family
products
BANKSINSURANCE-
ORIENTED
INVESTMENT-
ORIENTED
• Wirehouses
• Regional
Broker/Dealers
• Planners
• Insurance
Producers
• Banks
• Broker/
Dealers
• Marketers
THIRD PARTYPROPRIETARY
ALLIANCE MANAGEMENT GROUP (AMG)
Select 3rd party distributors with dedicated support
STRENGTHENS RELATIONSHIPS AND FUELS SALES GROWTH
All supported by DEDICATED SERVICE TEAMS providing education, training, counseling and retention
11 WHOLESALE CHANNELS
Group
Benefits
Retirement Investment
Solutions
Annuities NQDC Disability
Insurance
Retail
Life
AMG WorksiteESOP Wellness
29
DISTRIBUTION
32. Broad and Deep Distribution
Proprietary provides foundation; 3rd party provides accelerated growth
Rankings and percentages as of 12/31/2014
Product Line
New Sales
1st 2nd 3rd Top 3
represent
NQ Life 33%
Retail Life 59%
Individual Disability Plus Group 39%
Group Benefits Gallagher 14%
Fixed Annuities 52%
Variable Annuities
KeyCorp Ins.
Agency 94%
Mutual Funds 23%
FSA – New Sales Assets 35%
FSA – New Sales Case
Counts
Edward D.
Jones 33%
32
DISTRIBUTION
Principal
Advisor
Network
Principal
Advisor
Network
Principal
Advisor
Network
Principal
Advisor
Network
Principal
Advisor
Network
Principal
Advisor
Network
Principal
Advisor
Network
Principal
Advisor
Network
35. Asset Management Expertise Wins Mandates
$82.4
$98.2
$109.4 $114.0
$120.2
2011 2012 2013 2014 3Q15
Principal Global Investors
Unaffiliated AUM
(in billions)
• Best Global Real Estate
Fund over the 5‐year
period
(1)
• Top 10 Manager of Real
Estate
(2)
• 15th Largest manager of
High Yield
(3)
• PFG ranked No.1 company
among the Best Places to
Work in Money
Management(4)
Sources: (1) The Principal Real Estate Investors portfolio management team subadvises the Principal Global Real Estate Securities
Fund‐Class l, which received the award from Lipper, Inc. for the third year in a row, March 2015. (2) Managers ranked by total
worldwide real estate assets (net of leverage), as of June 30, 2015, “Largest Real Estate Managers”, PENSIONS & INVESTMENTS,
October 19, 2015. (3) Managers ranked by U.S. institutional, tax‐exempt assets managed internally, as of 12/31/14 “Largest
Money Managers”, Pensions & Investments, May 2015. (4) Pensions & Investments, “The Best Places to Work in Money
Management among companies with our size category”, PFG recognition 12/08/2014.(5) Managers ranked by total assets under
management. America’s Top 300 Money Manager, Institutional Investor, July 2015, data as of 12/31/2014.
35
PRINCIPAL GLOBAL INVESTORS
36. Strong Investment Performance
Morningstar Rankings
Percentage of Principal Funds in the top two quartiles
85% 85%
88%
87% 87%
91%
86%
91% 91%
1‐Year 3‐Year 5‐Year
Sep. 30, 2014 Jun. 30, 2015 Sep. 30, 2015
36
Represents $164 billion of assets under management of which 75% is managed by Principal Global Investors. Principal “I” shares; if no “I”
share class then “A” share class; separate accounts use “R6” rate level; Includes Principal mutual funds, separate accounts and collective
investment trusts (CITs); Excludes money market, stable value and U.S. Property separate account.
PRINCIPAL GLOBAL INVESTORS
37. PRINCIPAL FINANCIAL
GROUP
Mexico (1993)
• Annuities, Mutual
Funds, Pensions,
Asset Management
• AUM of $10.5B
• Wholly owned
Chile (1995)
• Annuities, Mutual Funds, Asset
Management, Mandatory Pensions,
Voluntary Pensions
• AUM of $37.8B
• Wholly owned
• Cuprum – a 98% owned joint venture
AUM of $32.6B
Brazil (1999)
• Annuities, Pensions,
Mutual Funds, Asset
Management
• Brasilprev – a 25%
owned joint venture with
Banco do Brasil
AUM of $35.3B
• Claritas – 71% indirectly
owned mutual fund
company
AUM of $0.9B
India (2000)
• Asset Management,
Mutual Funds
• AUM of $0.7B
• 79% owned joint venture
with Punjab National
Malaysia (2003)
• Conventional & Islamic Asset
Management, Mutual Funds,
Pensions
• AUM of $11.4B
• CIMB‐Principal – 40% owned
joint venture with CIMB
Group; 50% owned Islamic
company with CIMB
China (2005)
• Asset Management, Mutual
Funds
• AUM of $41.5B
• CCB‐Principal – a 25%
owned joint venture with
China Construction Bank
Hong Kong (1996)
• Asset Management, Mutual
Funds, Pensions
• AUM of $7.1B
• AXA – Transaction closed on
9/1/2015 adding AUM of
$3.1B
• Wholly owned
Thailand (2010)
• Asset Management, Mutual Funds
• AUM of $2.2B
• Wholly owned subsidiary of Malaysian JV
Indonesia (2007)
• Asset Management,
Mutual Funds
• AUM of $0.3B
• Wholly owned
subsidiary of Malaysian
JV
Singapore (2006)
• Asset Management
• AUM of $1.8M
• Wholly owned subsidiary
of Malaysian JV
AUM as of 09/30/2015
PRINCIPAL INTERNATIONAL
37
38. We’re in the Right Countries
SOURCE: IMF, Standard Chartered Research.
TEN LARGEST ECONOMIES BY DECADE
Current Principal International locations: Asia Latin America
38
1990
US$
trn
1 U.S. 5.9
2 Japan 3.1
3 Germany 1.7
4 France 1.2
5 Italy 1.1
6 UK 1.0
7 Canada 0.6
8 Spain 0.5
9 Brazil 0.5
10 China 0.4
2000
US$
trn
U.S. 10.3
Japan 4.7
Germany 1.9
UK 1.5
France 1.3
China 1.2
Italy 1.1
Canada 0.7
Brazil 0.6
Mexico 0.6
2010
US$
trn
U.S. 15.0
China 5.9
Japan 5.5
Germany 3.3
France 2.5
UK 2.3
Italy 2.0
Brazil 2.1
Canada 1.6
Russia 1.5
2020E
US$
trn
U.S. 23.5
China 21.9
Japan 6.1
Germany 5.1
India 4.5
Brazil 3.9
France 3.9
UK 3.7
Italy 2.7
Russia 2.6
2030E
US$
trn
China 53.8
U.S. 38.5
India 15.0
Japan 9.3
Germany 7.4
Brazil 6.3
UK 5.8
France 5.7
Indonesia 4.7
Russia 4.6
PRINCIPAL INTERNATIONAL
40. Pensions
Mutual
Funds
Asset
Mgmt
Annuities
Brazil
Chile
Mexico
China
Hong
Kong
India
Malaysia/
SE Asia
Our Markets and Product Offering
= Where we
have a product
offering today
Targeted
Markets
= Targeted
expansion
= 10% of market
share or Top 25% of
providers
40
PRINCIPAL INTERNATIONAL
44. Corporate Public
Bonds
27%
Corporate Private
Bonds
17%
Commercial
Mortgages
16%
CMBS
5%
Cash
3%
MBS
6%
ABS
5%
Government, Agency,
State & Political
10%
Other*
11%
Diversified Portfolio
$72.1 Billion
* Other includes Equity Securities, Residential Mortgages, Real Estate, Policy Loans, Investment in Equity Method subs,
Direct Finance Leases and Other Investments
44
Invested Assets & Cash
As of 09/30/15
GAAP carrying value
INVESTMENTS
• Liability‐driven investment
approach
• Active asset/liability management
• Optimized risk adjusted yields and
returns
• High quality, well‐diversified
portfolio
• Global collaboration and best
practices
• Portfolio responsibility remains at
local country
Investment Philosophy
& Strategy
REMAINS THE SAME
47. 40%
30%
30%
33%
33%
34%
Returning Capital to Shareholders
2007 Current 2018E
• Less capital needed to support organic growth
• Moving to higher dividend payout ratio
• Diligently pursuing active acquisition pipeline
• Opportunistically buying back shares
47
(Acquisitions & share buybacks)
Organic Growth Dividends Available Capital
25%
25%
50%
FINANCIALS
51. Capital Deployment
Strategic
Acquisitions:
$350M
Share
Repurchases:
$550M
2011 2012
Over $1.1 billion
in total
Allocated $2.1 billion
Common Stock
Dividends: $230M
Share Repurchases:
$300M
Strategic
Acquisitions:
$1,595M
2013
Allocated $480 million
Share
Repurchases:
$150M
Strategic Acquisition:
$44M
Common
Stock
Dividends:
$288M
Common Stock
Dividends: $215M
51
2014
Allocated $855 million
Share
Repurchases:
$200M
Strategic
Acquisition:
$180M
Surplus Note
Redemption: $100M
Common
Stock
Dividends:
$375M
Long term: expect to deploy 65–70 percent of our net income
with fluctuations in any given year
FINANCIALS
52. Capital Deployment
• As of today, we have deployed $885M of capital, outlined below:
− $330M in common stock dividends
Paid 1Q15, 2Q15, and 3Q15 dividends of 36, 38, and 38 cents per
share respectively
− $200M shares repurchased
− $335M for AXA’s Hong Kong pension business
− $20M for increased ownership in PGI boutiques
• With the announced 4Q15 dividend of 38-cents, a 12% increase over 4Q14,
we have committed to deploy nearly $1B in 2015
• In addition, we accelerated our 2016 capital deployment plans by announcing
a new $150M share repurchase program
• Long term: expect to deploy 65–70 percent of our net income with fluctuations
in any given year
FINANCIALS
52
53. 5‐Year 2015E
Accumulation
Net revenue
growth
6‐8% 4‐6%
Pre‐tax RONR 28‐32% 30‐33%
Guaranteed
Net revenue
growth
6‐8% (2)‐2%
Pre‐tax RONR 75‐80% 78‐80%
Net revenue = operating revenues less benefits, claims & settlement expenses less dividends to policyholders.
RONR = Return on Net Revenue. Pre-tax operating margin = pre-tax operating earnings / premium and fees.
*Combined basis includes all Principal International companies at 100%.
Retirement & Investor Services
U.S. Insurance Solutions
5‐Year 2015E
Individual
Life
Premium & fee
growth
4‐8% 3‐5%
Pre‐tax operating
margin
16‐21% 13‐16%
Specialty
Benefits
Premium & fee
growth
8‐10% 6‐8%
Pre‐tax operating
margin
8‐12% 10‐12%
Loss ratio 65‐71% 64‐70%
53
Key Business Drivers Outlook
5‐Year 2015E
Revenue growth 14‐17% 7‐10%
Pre‐tax margin 30+% 26‐28%
Principal Global Investors
Principal International
5‐Year 2015E
Combined* net revenue growth
(normalized local basis)
15‐20% 14‐16%
Combined net revenue growth
(in reported USD)
15‐20% 8‐10%
Combined pre‐tax RONR 55‐60% 50‐52%
Principal’s share of
combined pre‐tax earnings
N/A 35%
Estimated After-tax operating losses for Corporate of $130-$150 million in 2015
FINANCIALS