Download to read offline
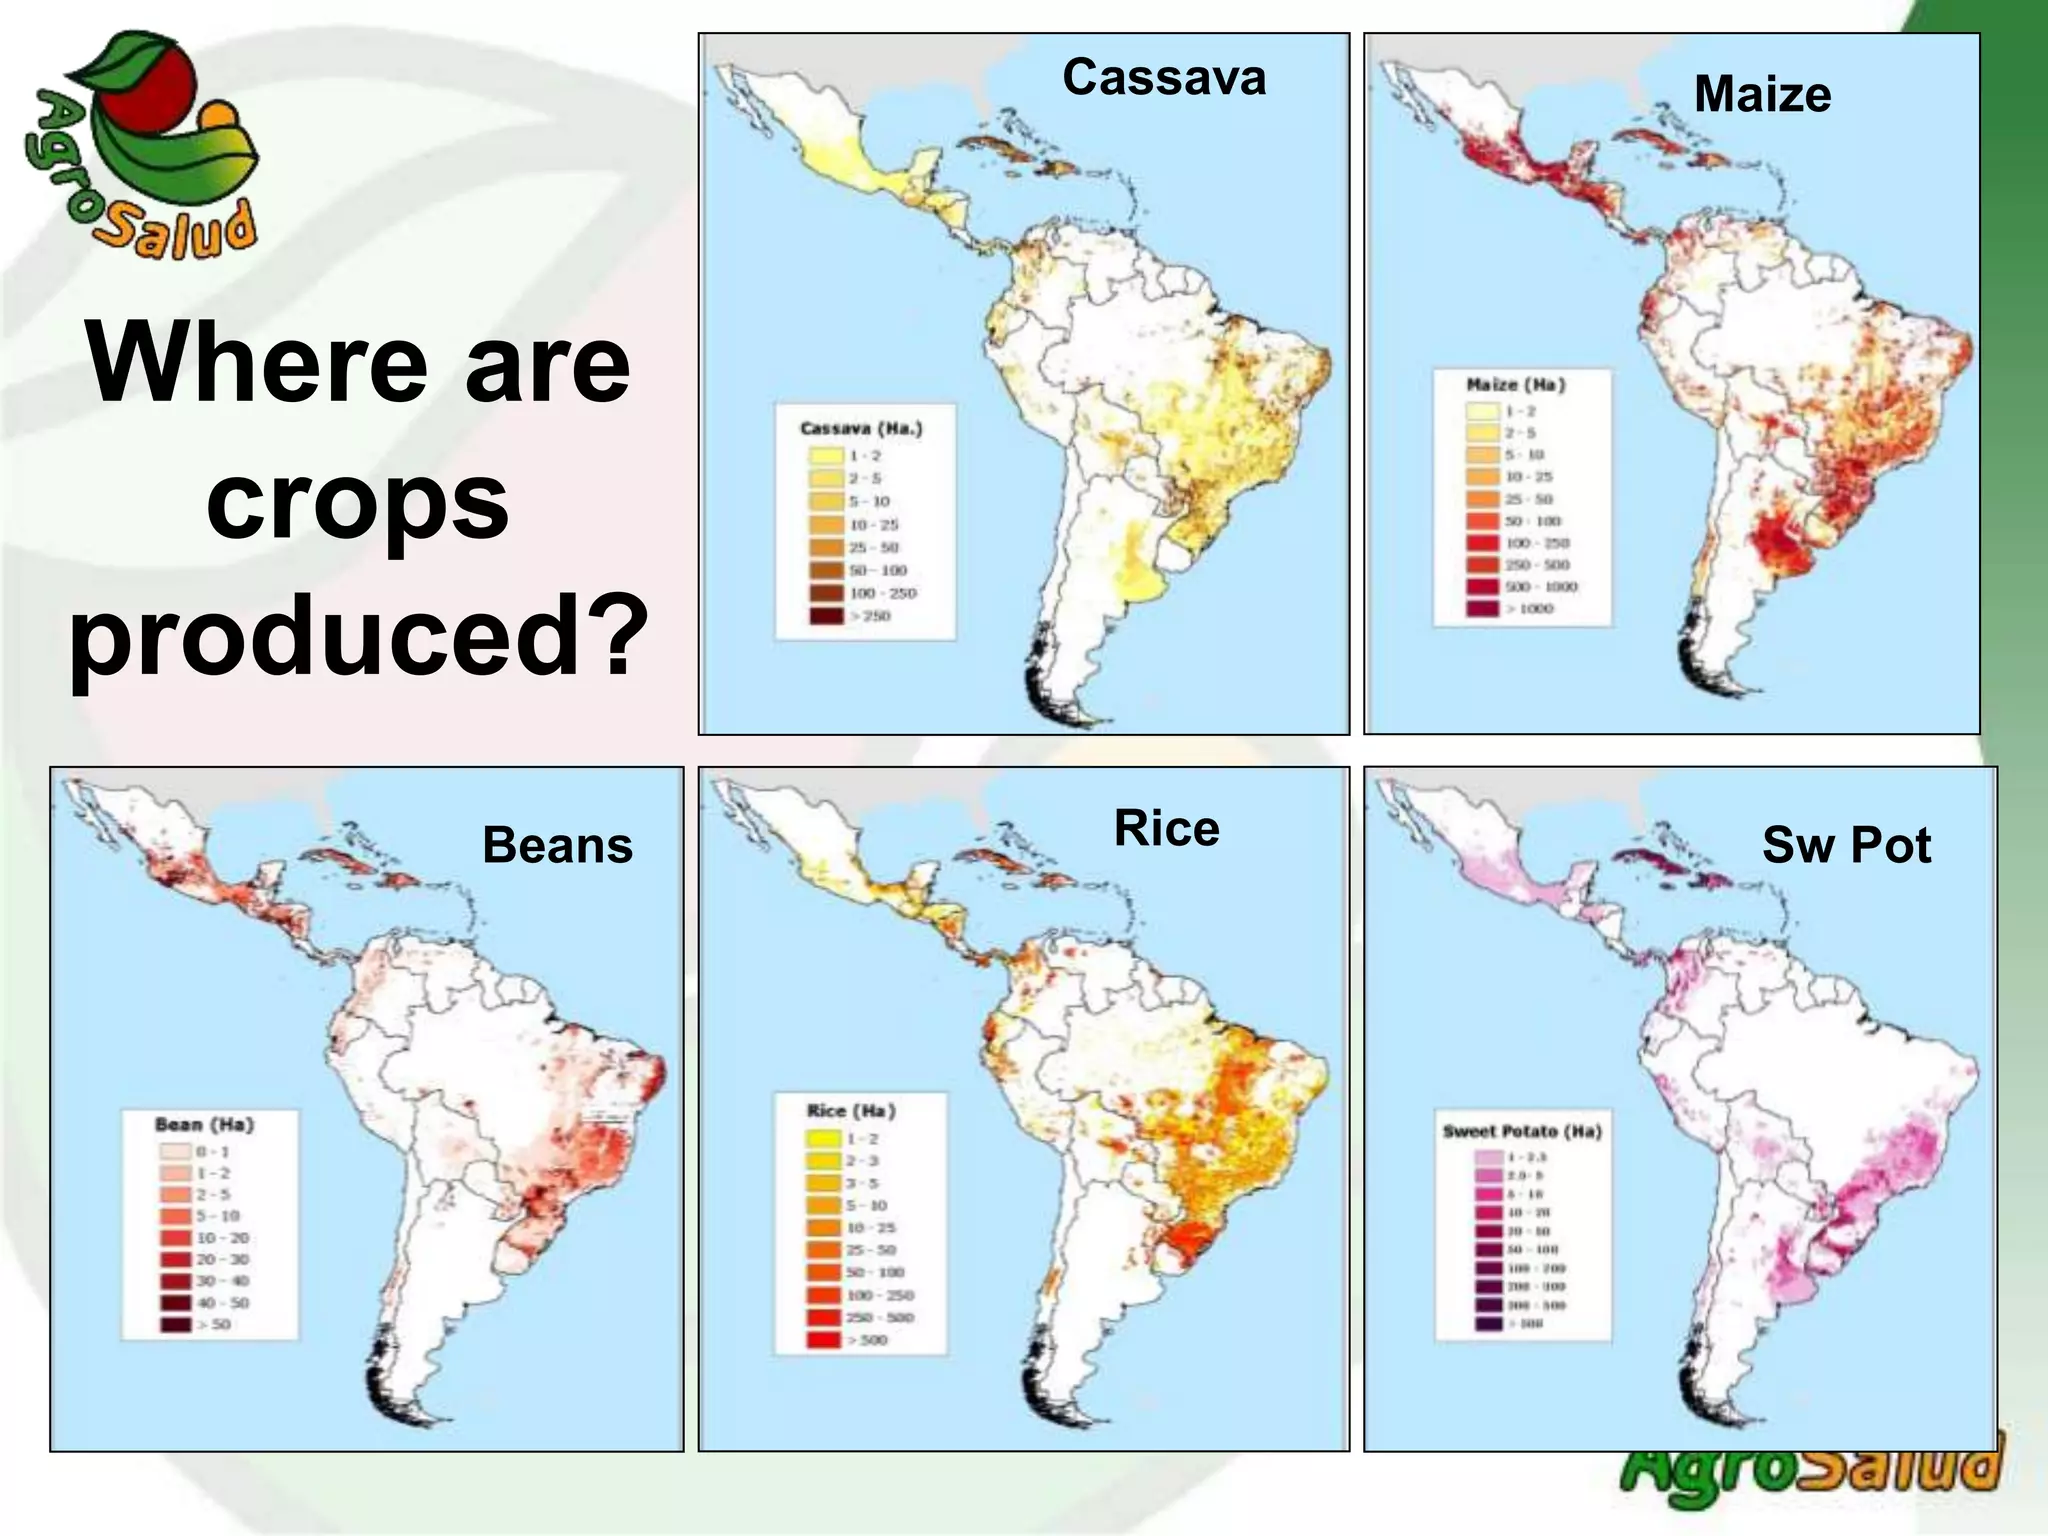
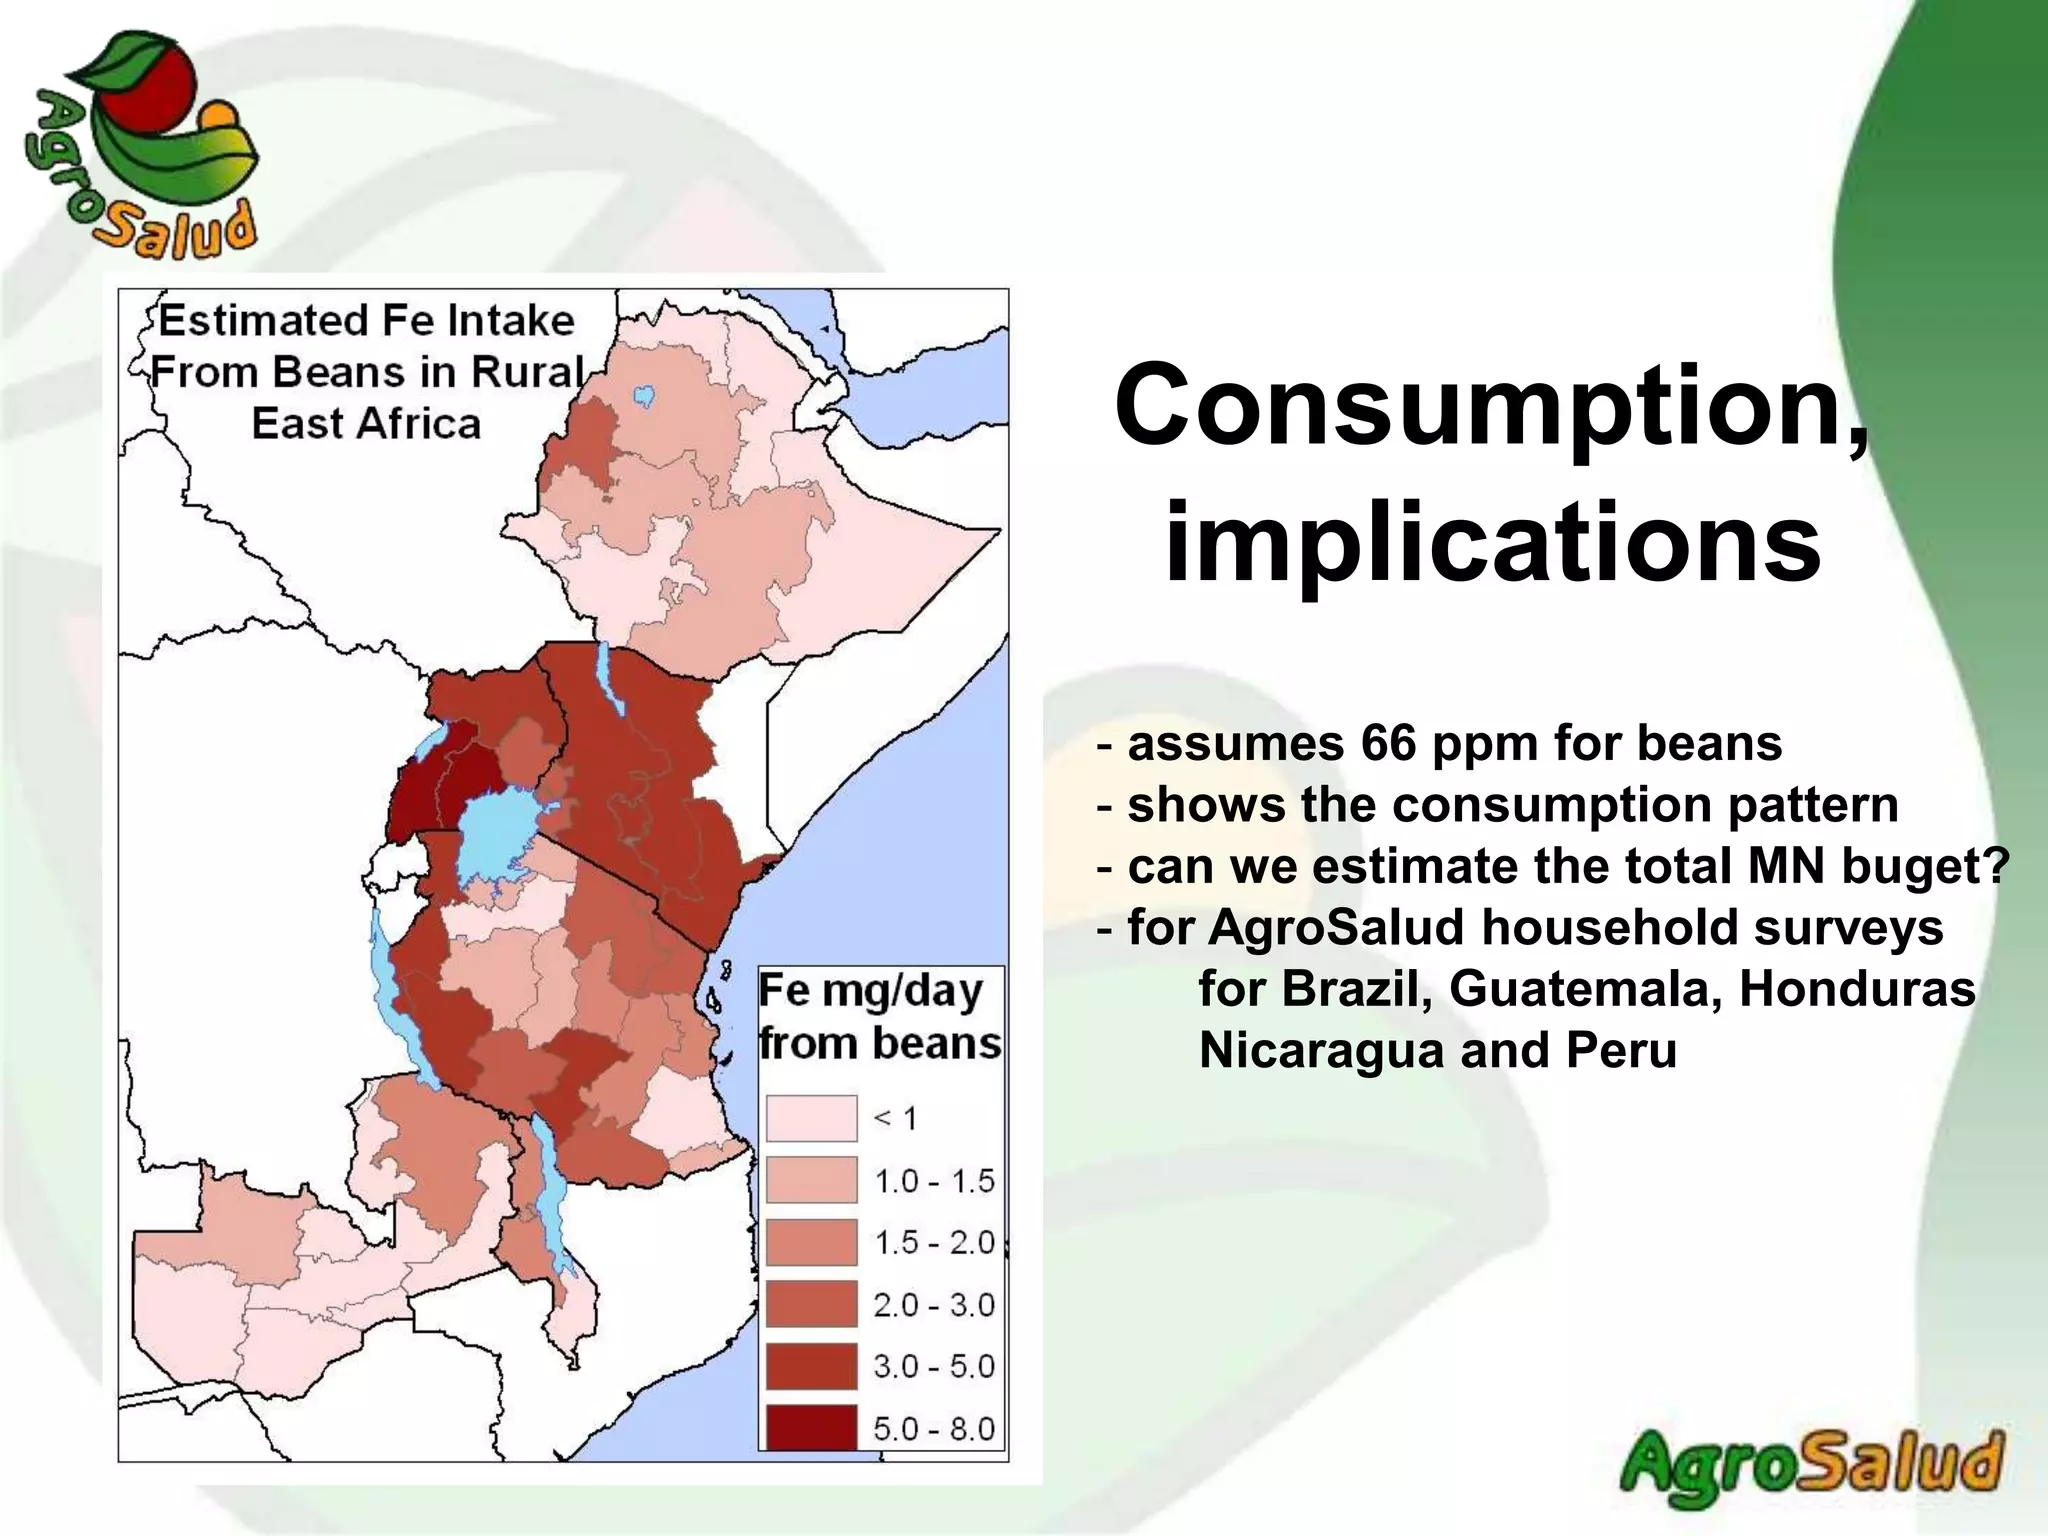
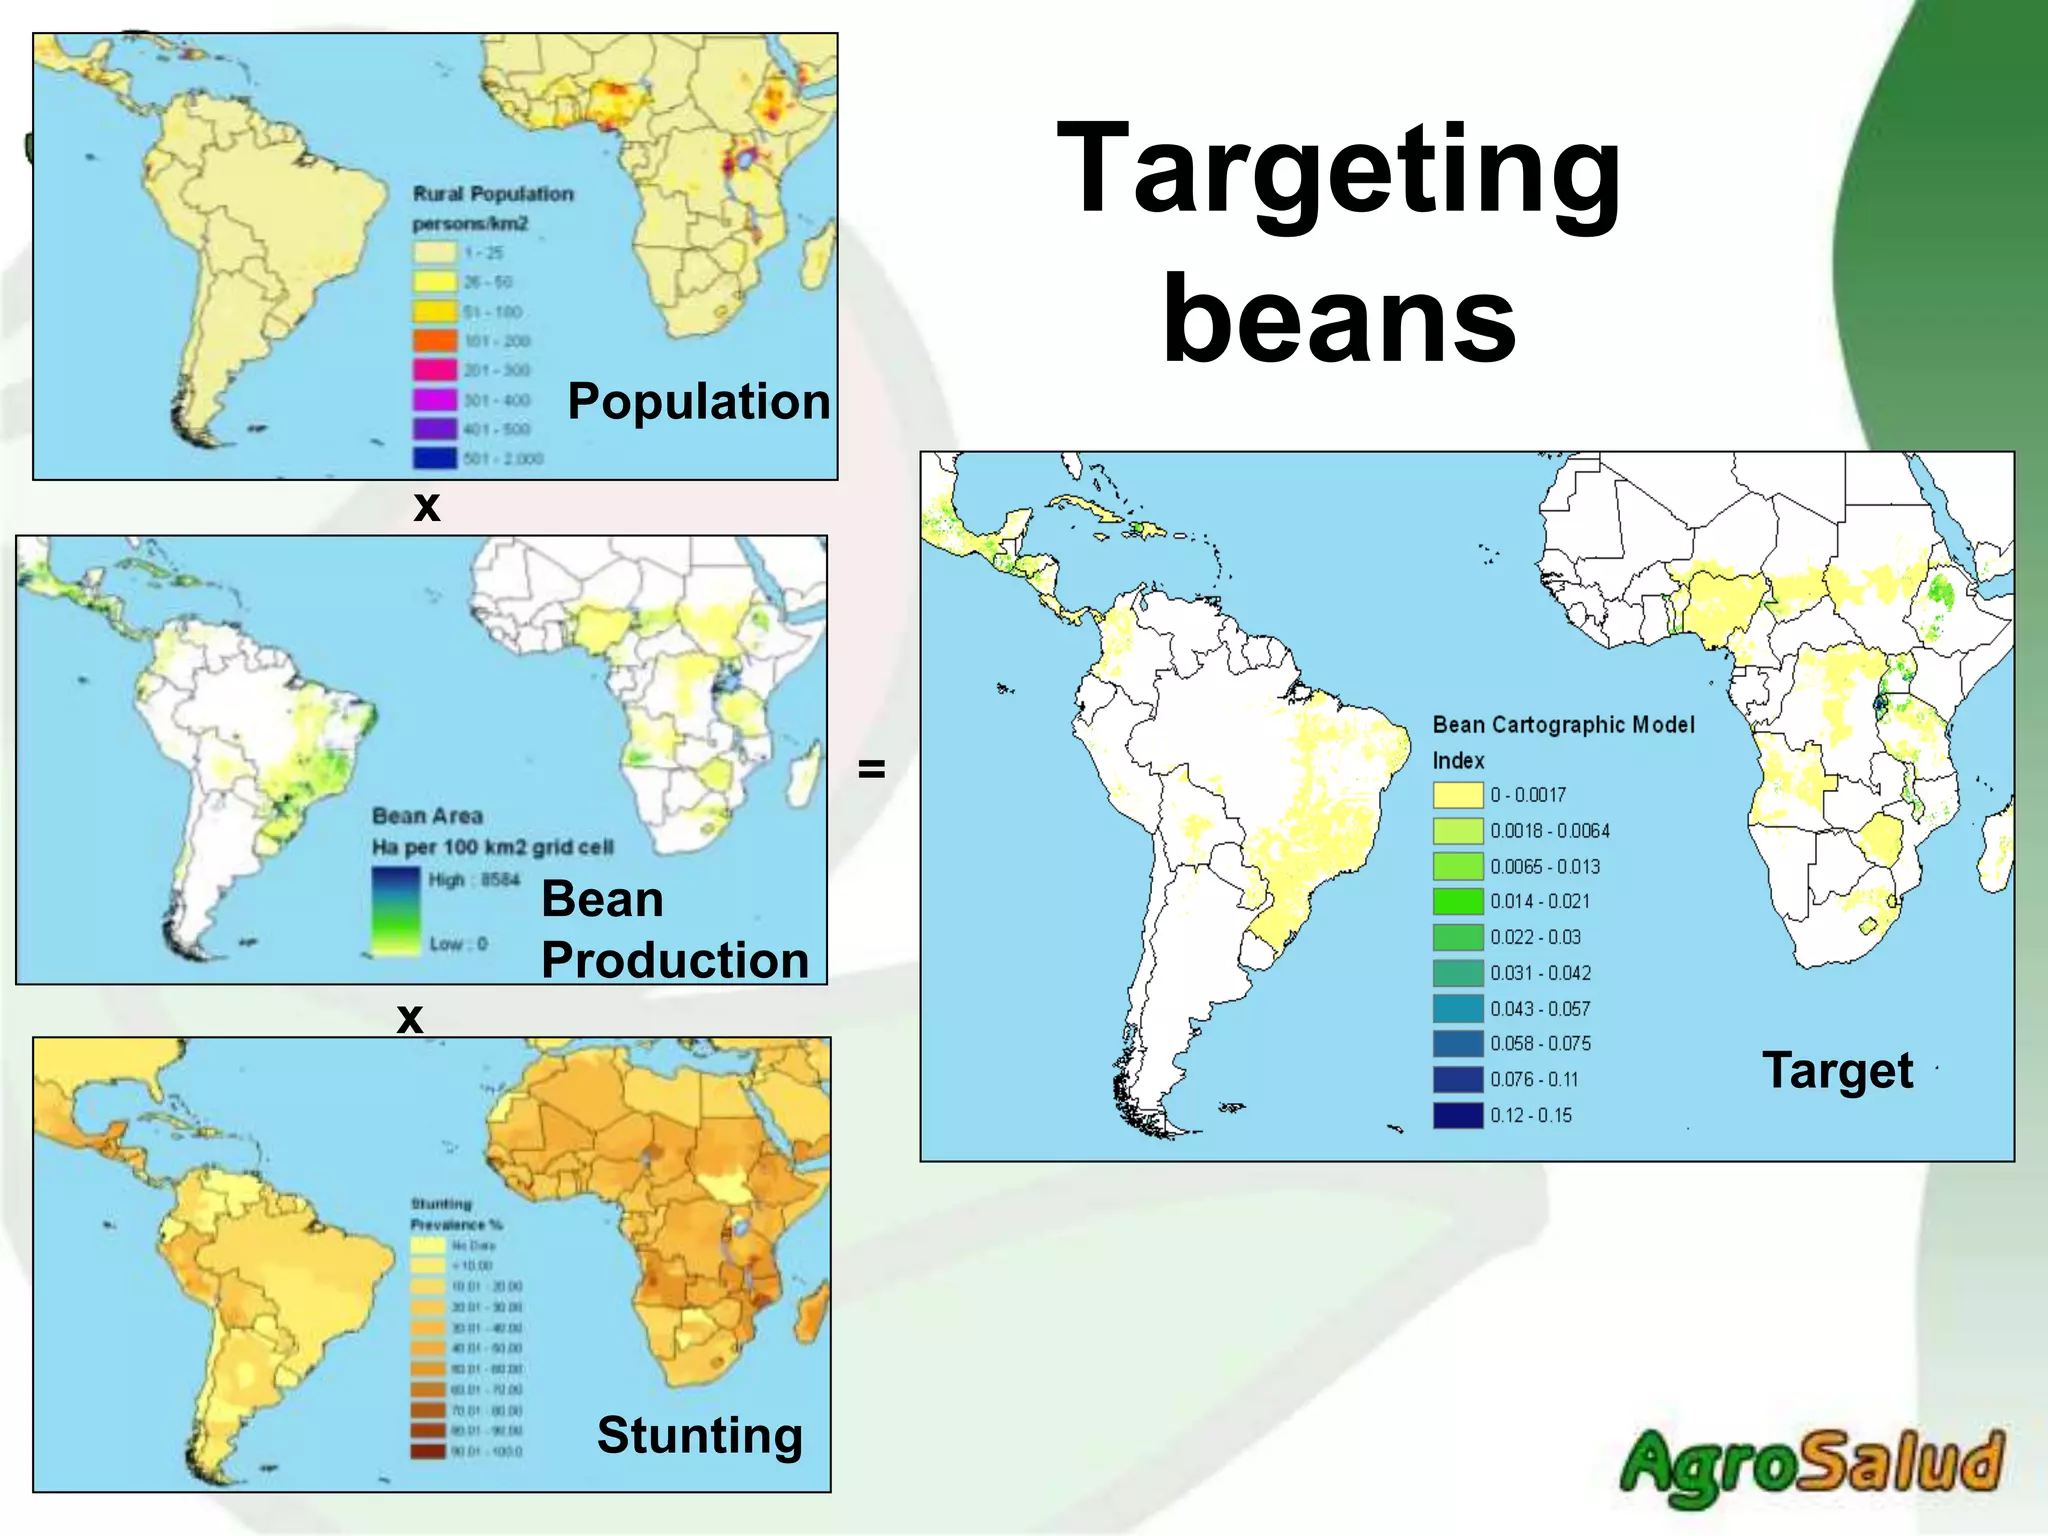
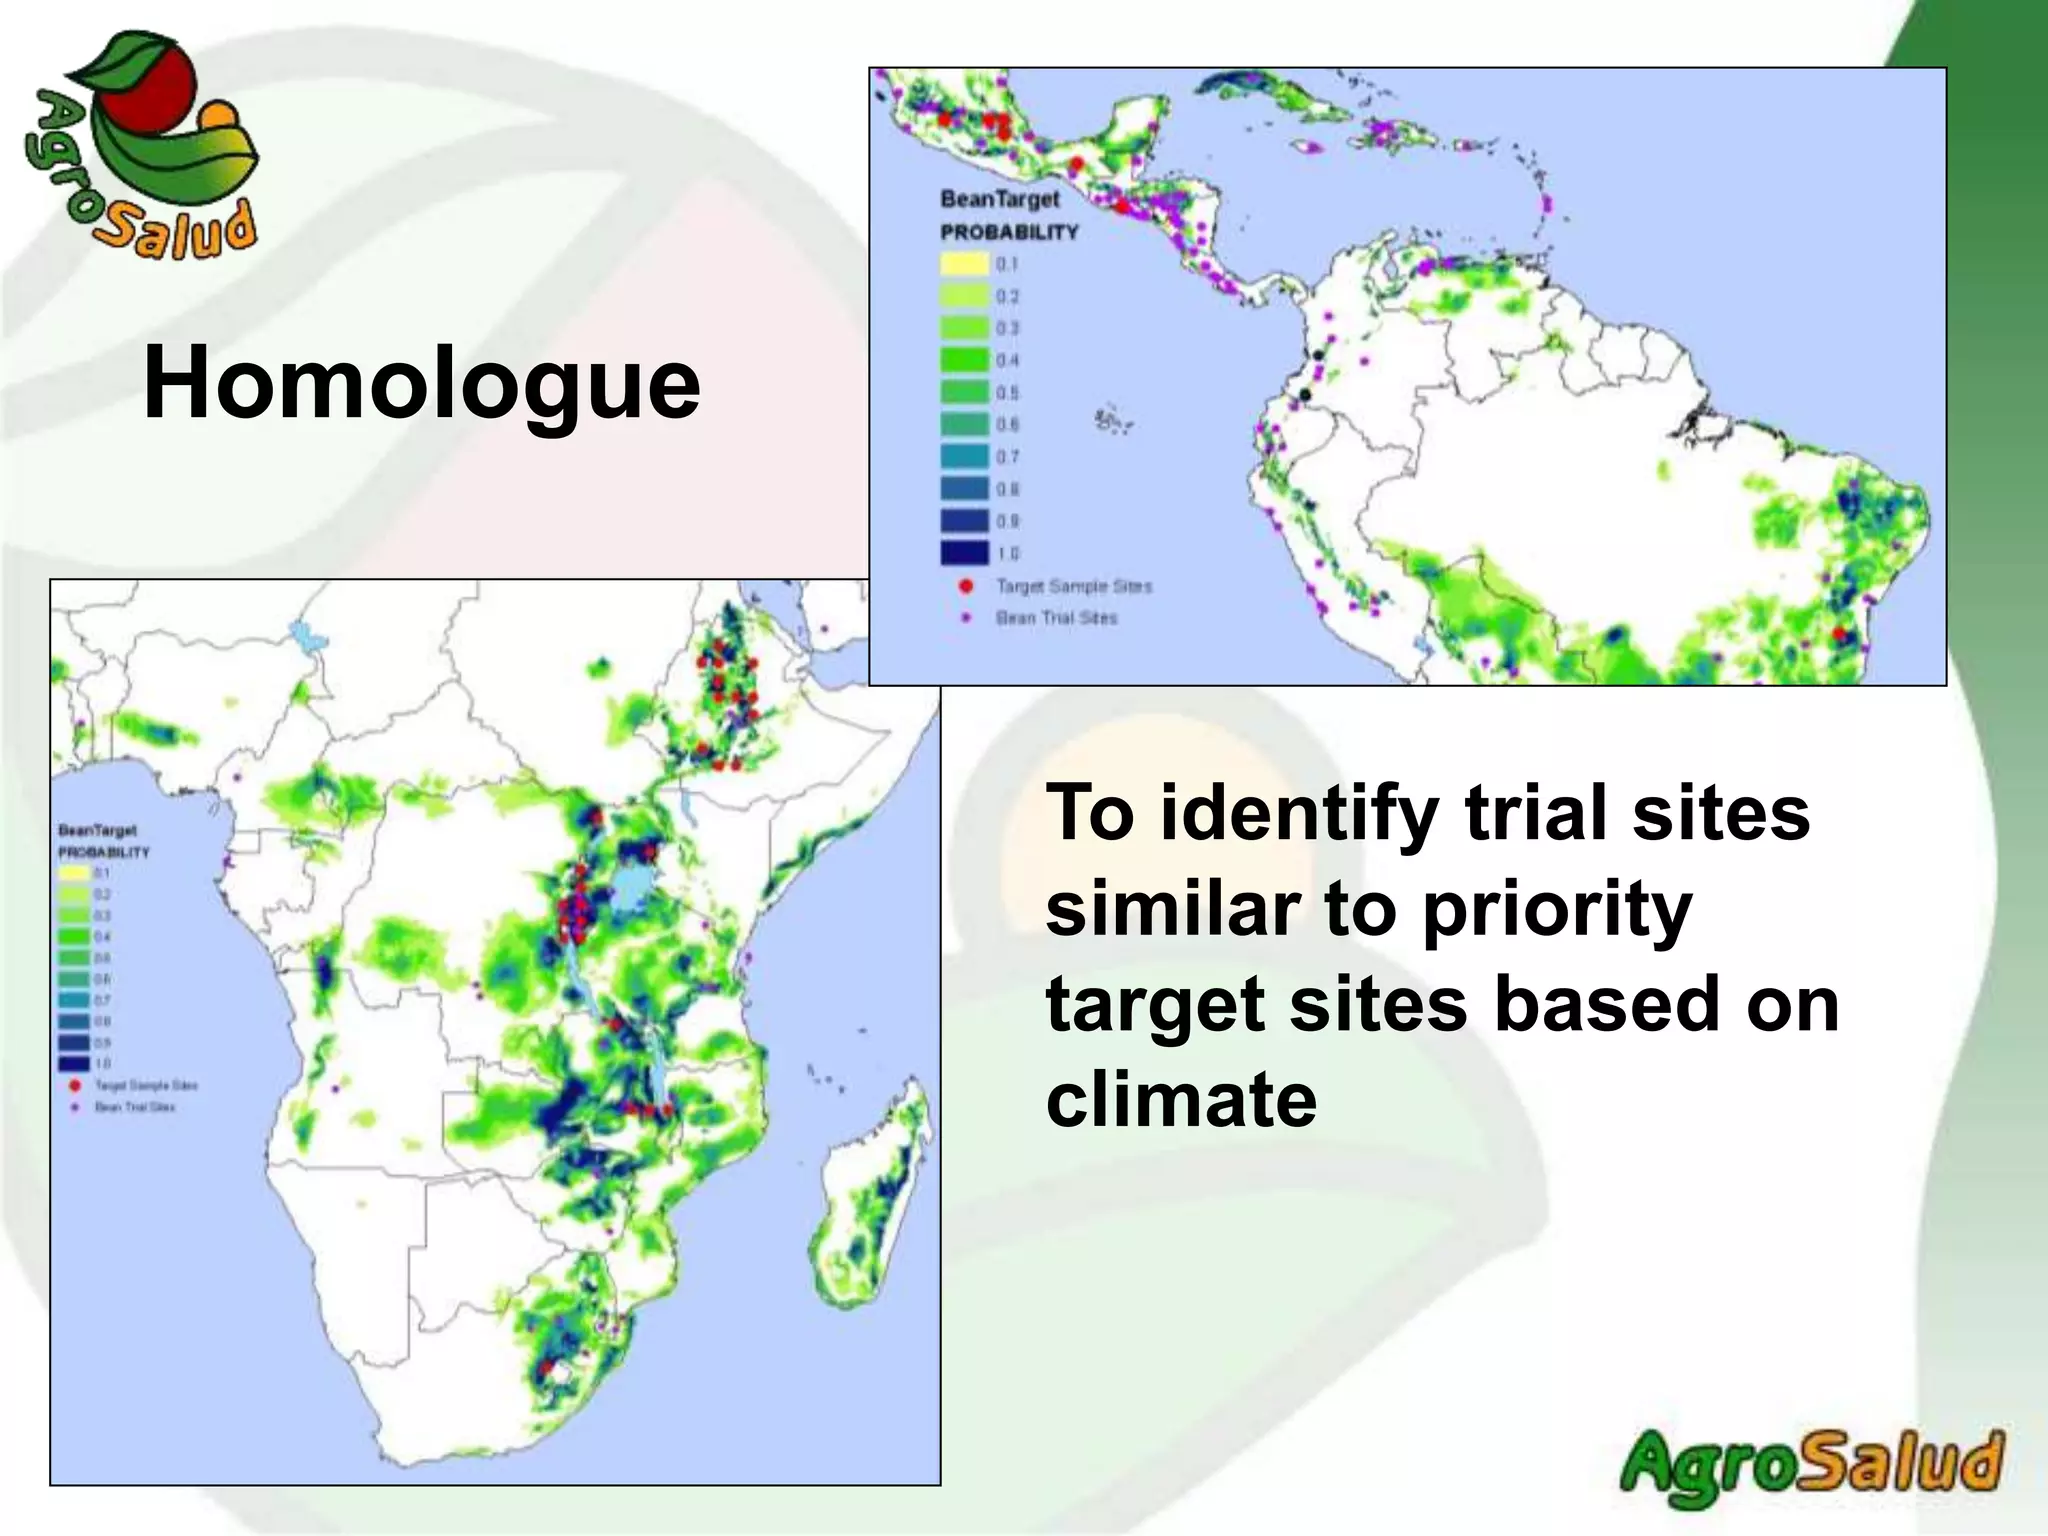
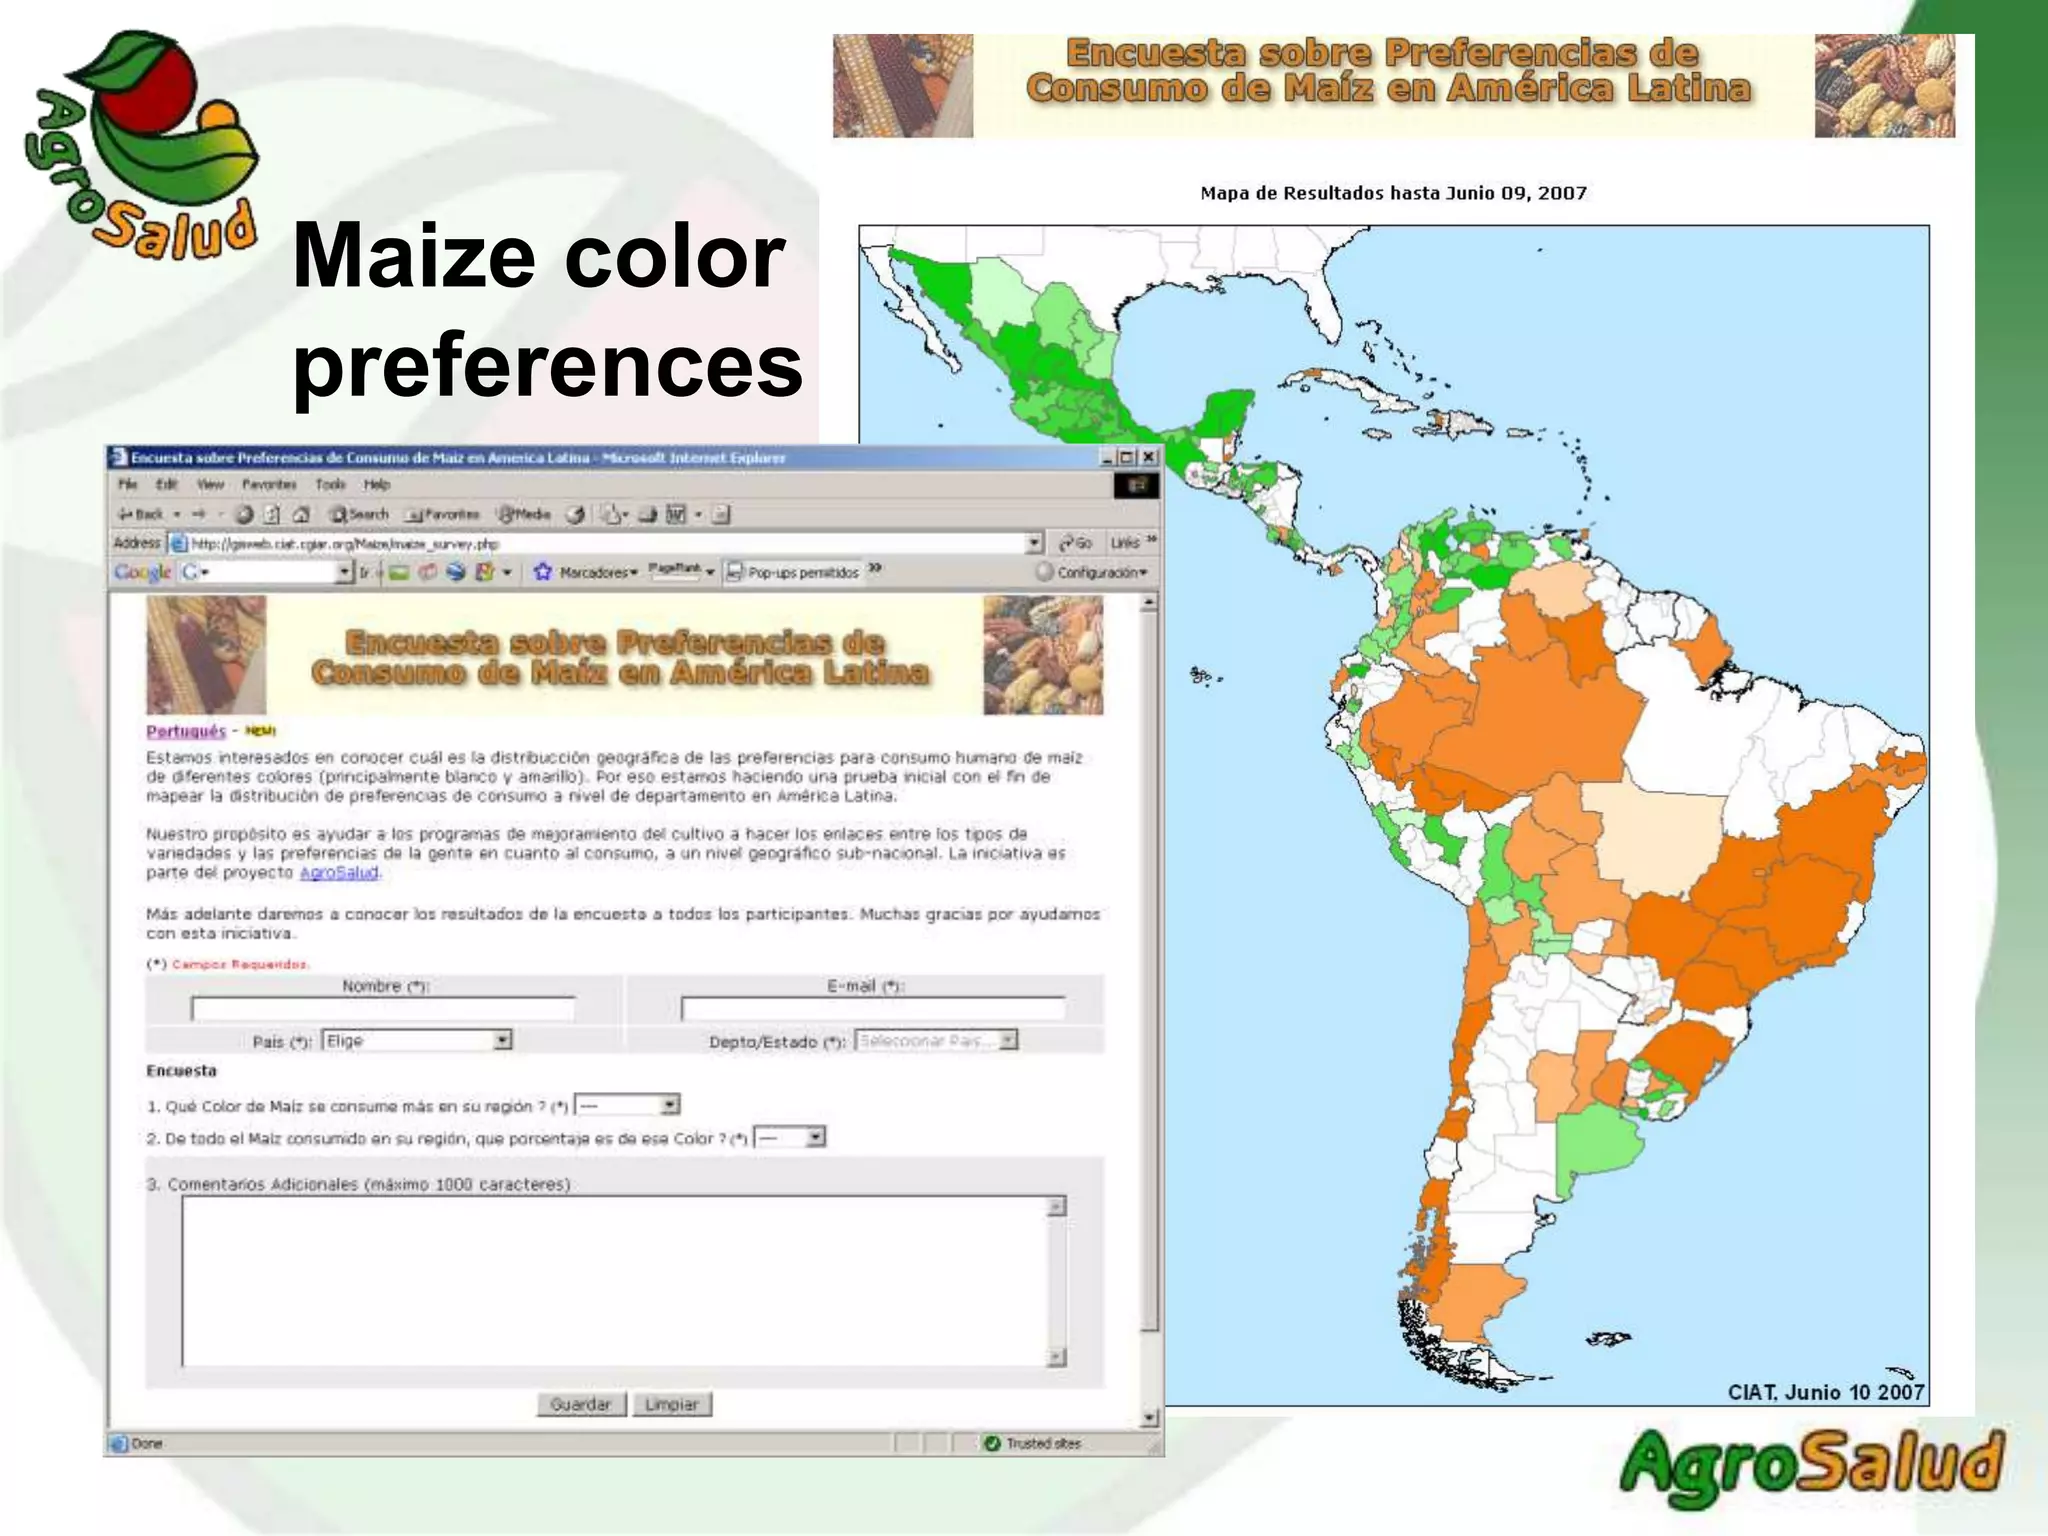
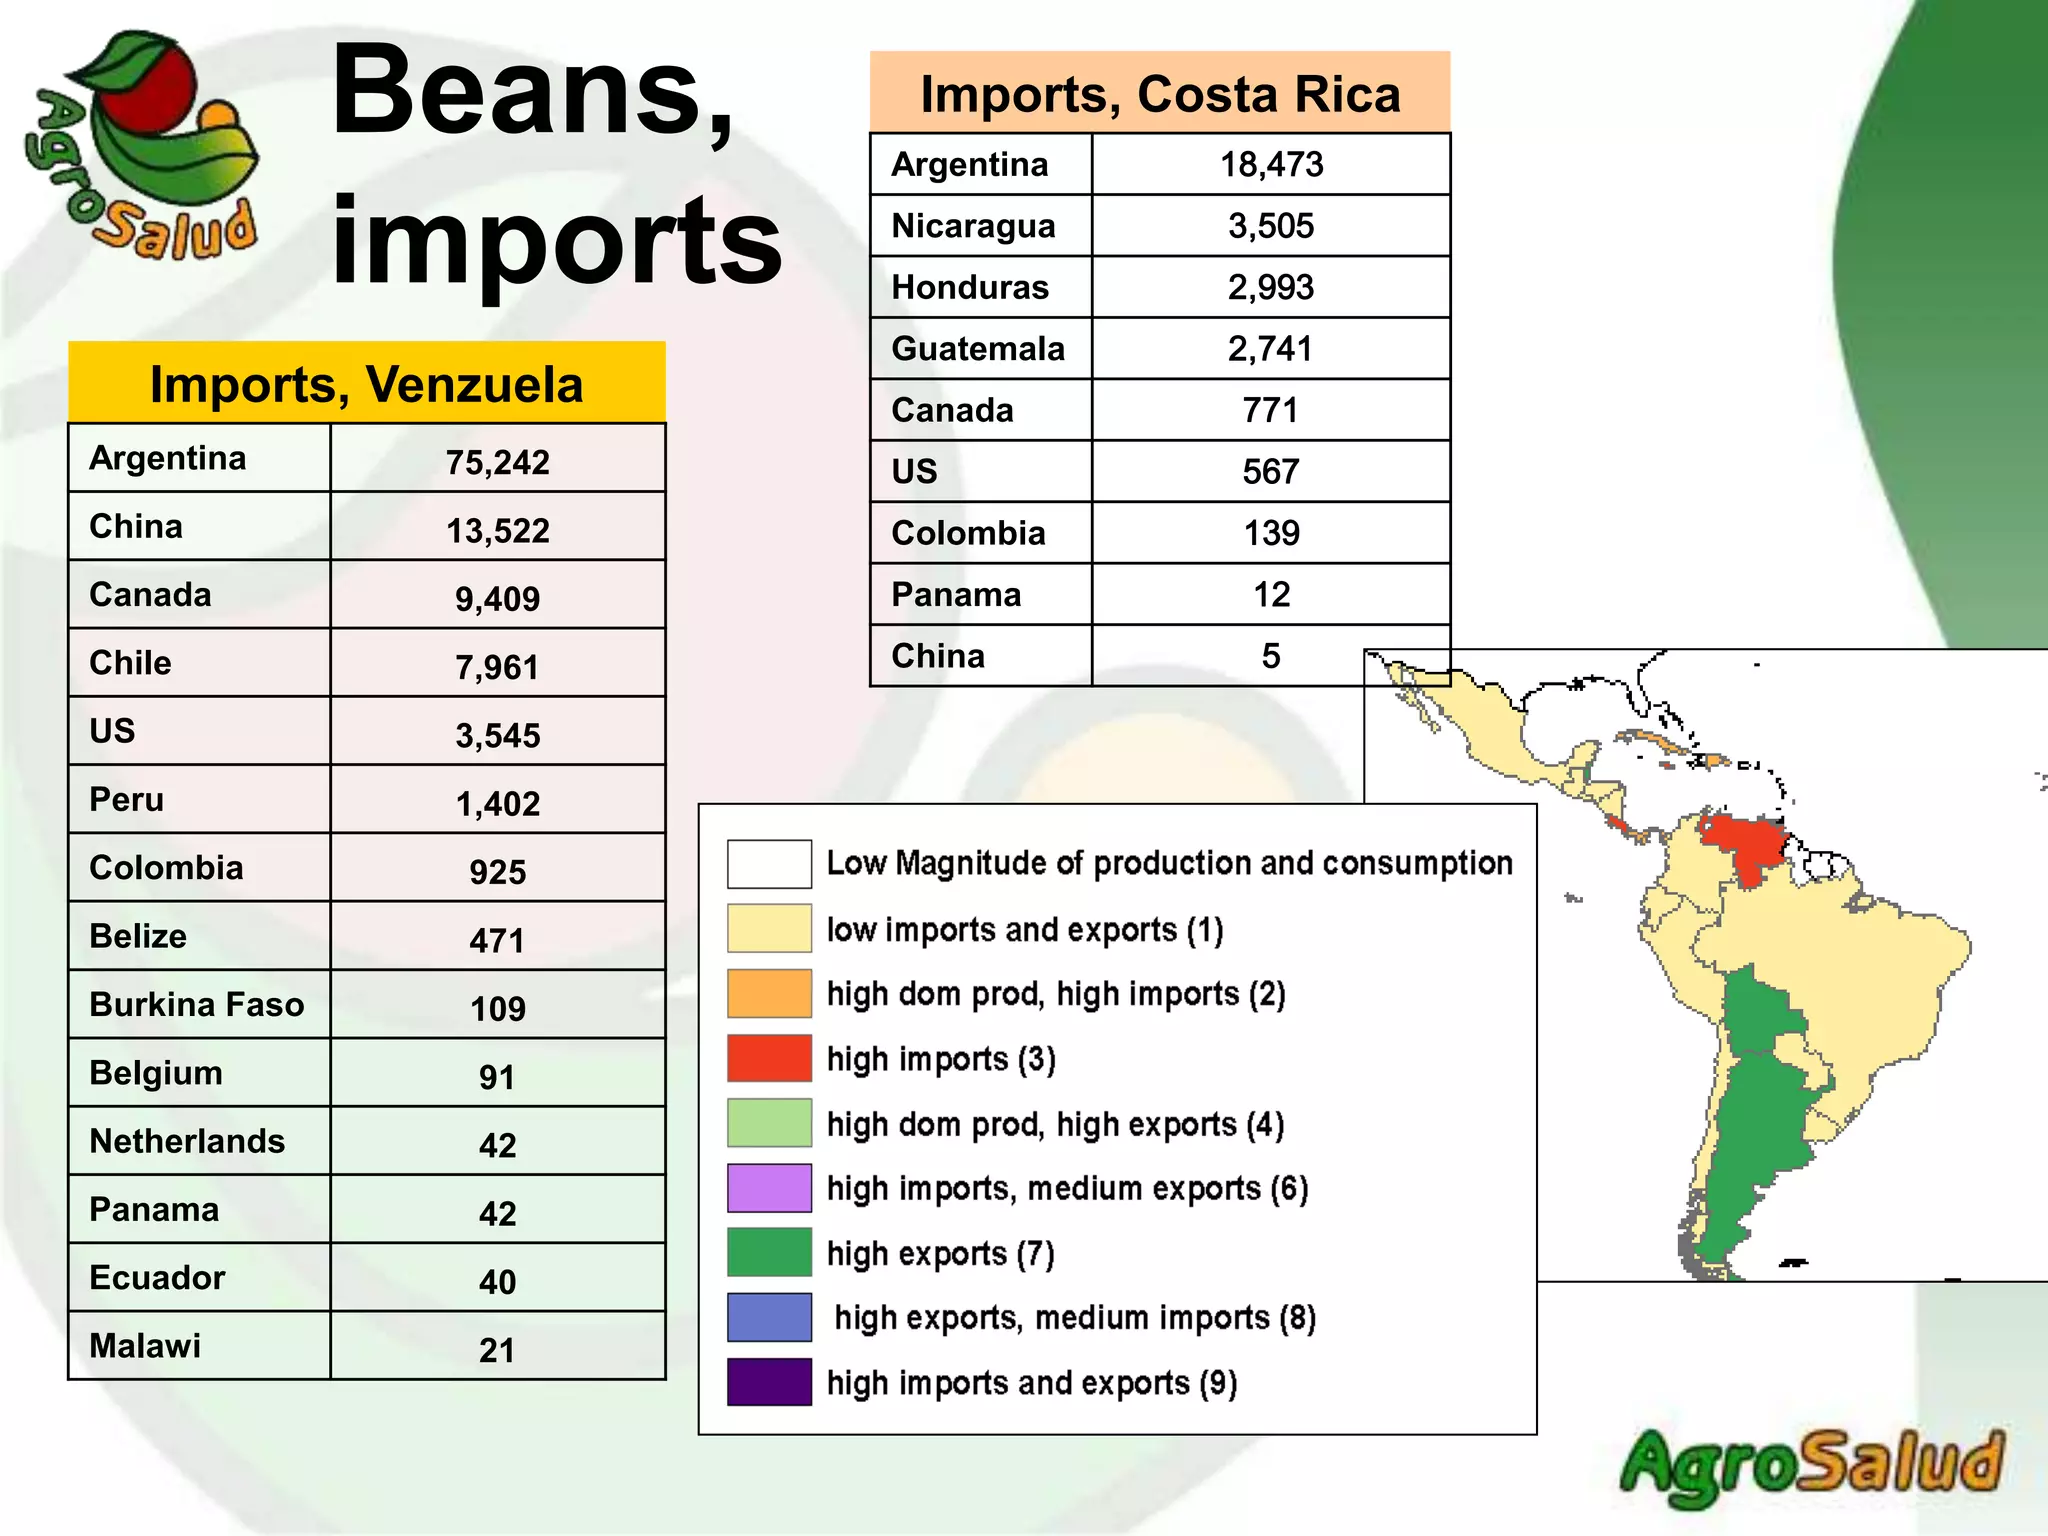
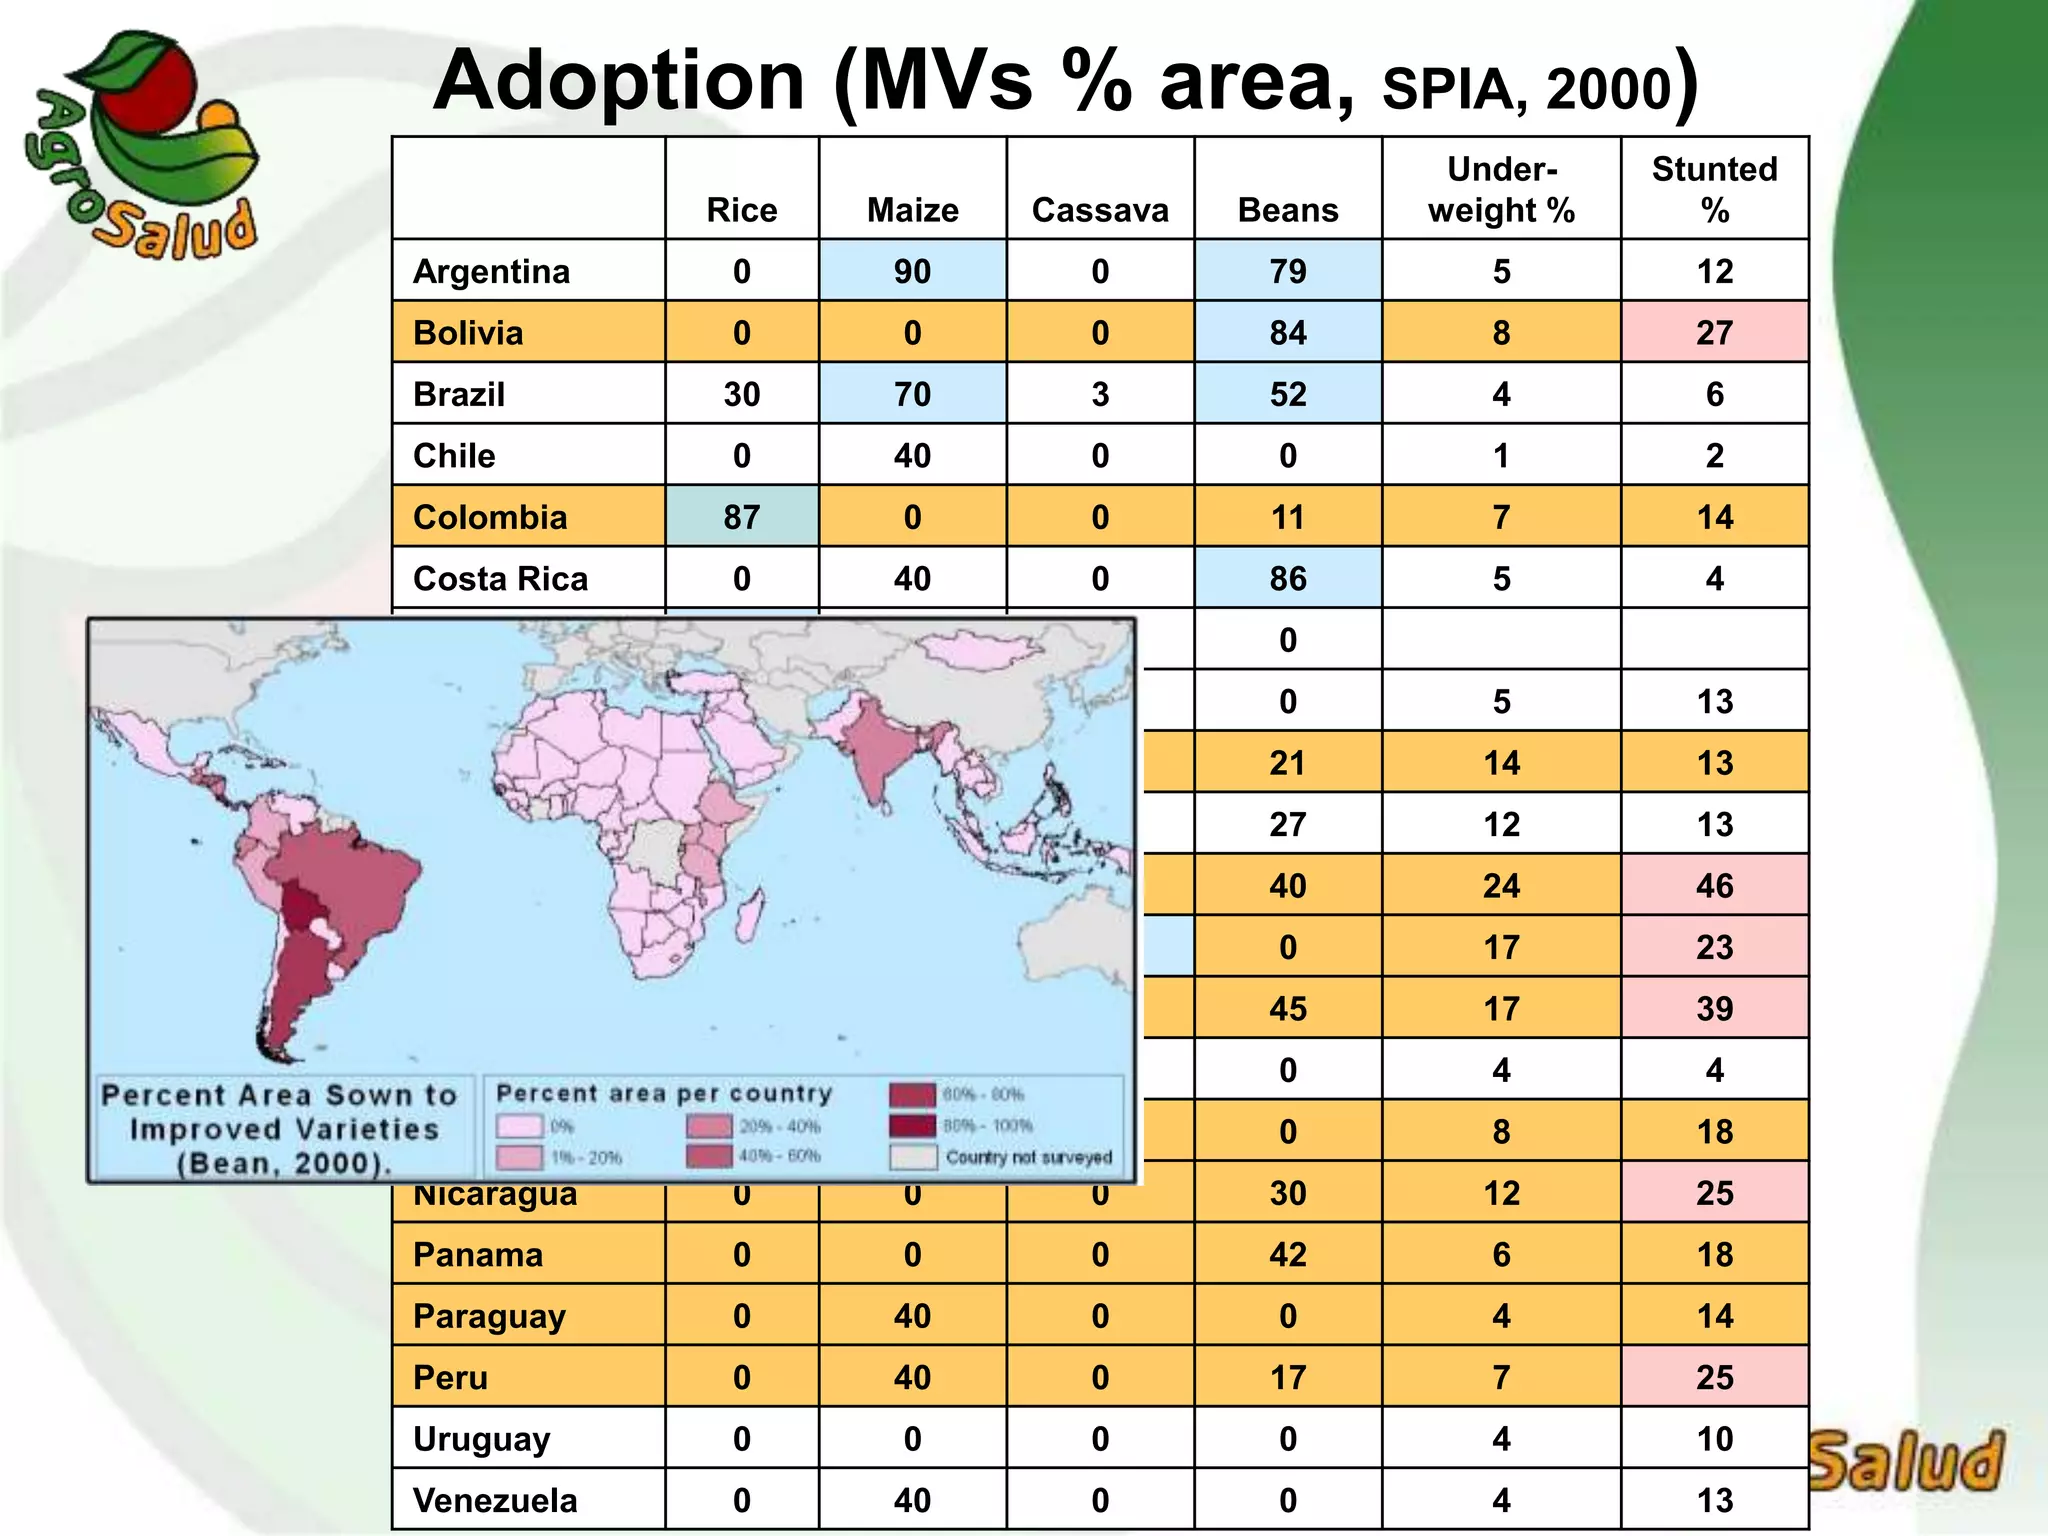
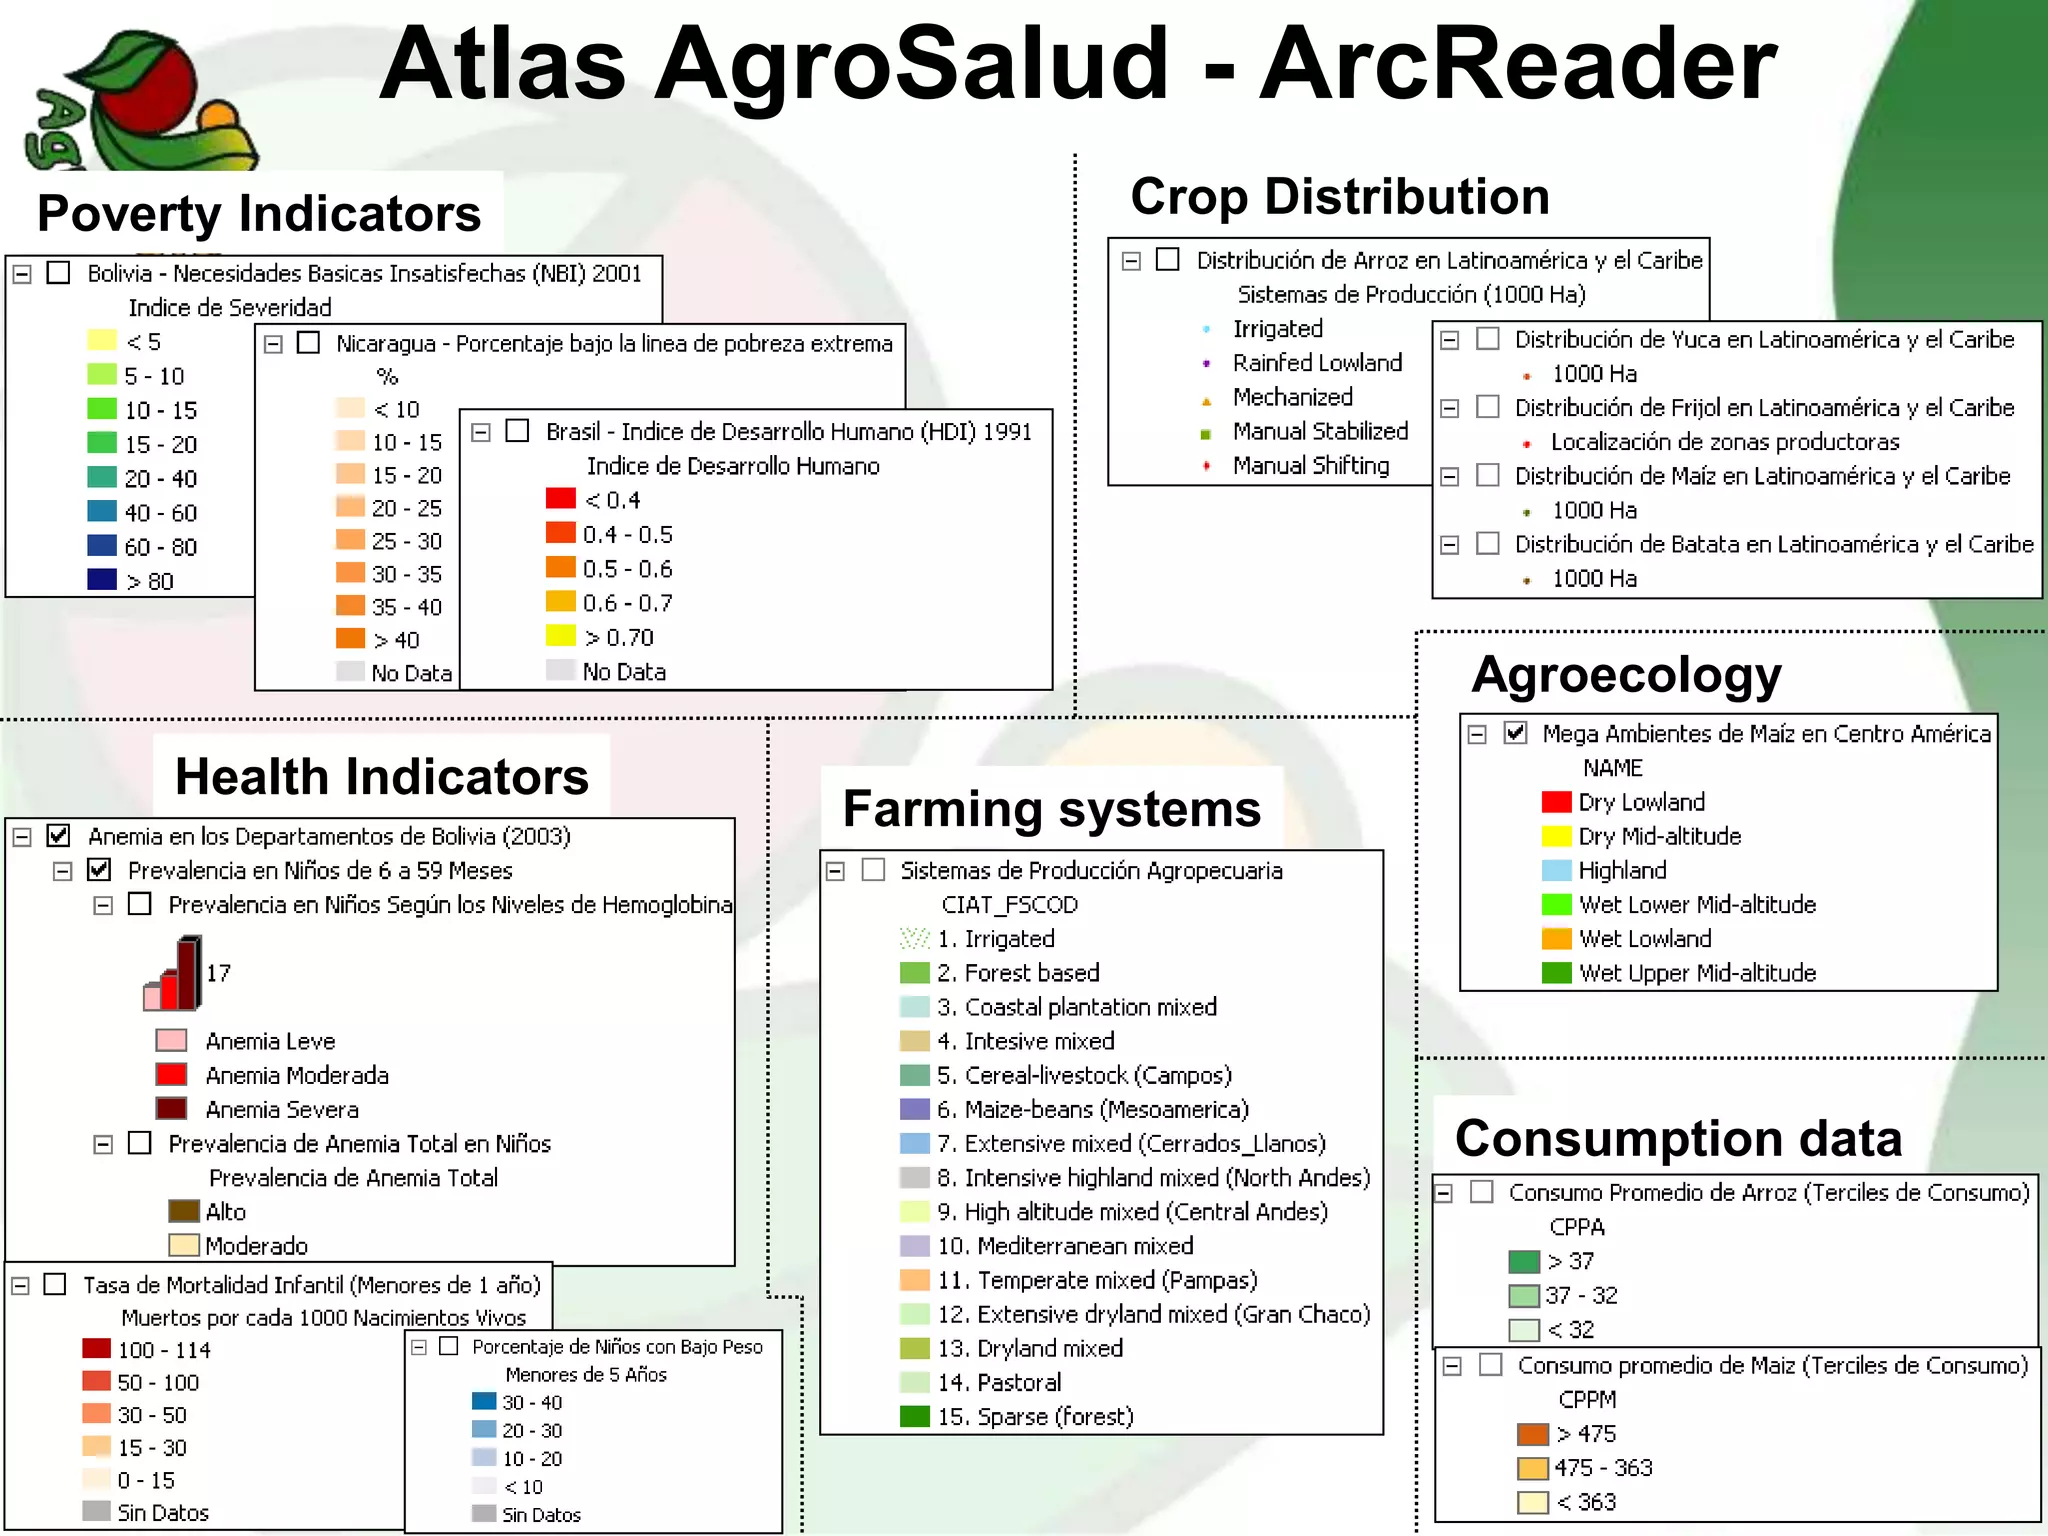


This document discusses objectives and ongoing work for improving micronutrient deficiencies in Latin America through biofortified crops. The objectives are to: 1) improve impacts of biofortified products on micronutrient deficient populations; 2) identify production and consumption chains for delivering biofortified crops to those in need; and 3) analyze this for researchers and beneficiaries. The ongoing work includes analyzing crop production locations, consumption patterns, targeting priority areas, and determining trial sites based on climate similarities to priority areas.


